संक्षिप्त परिचय बबई गाउँपालिका
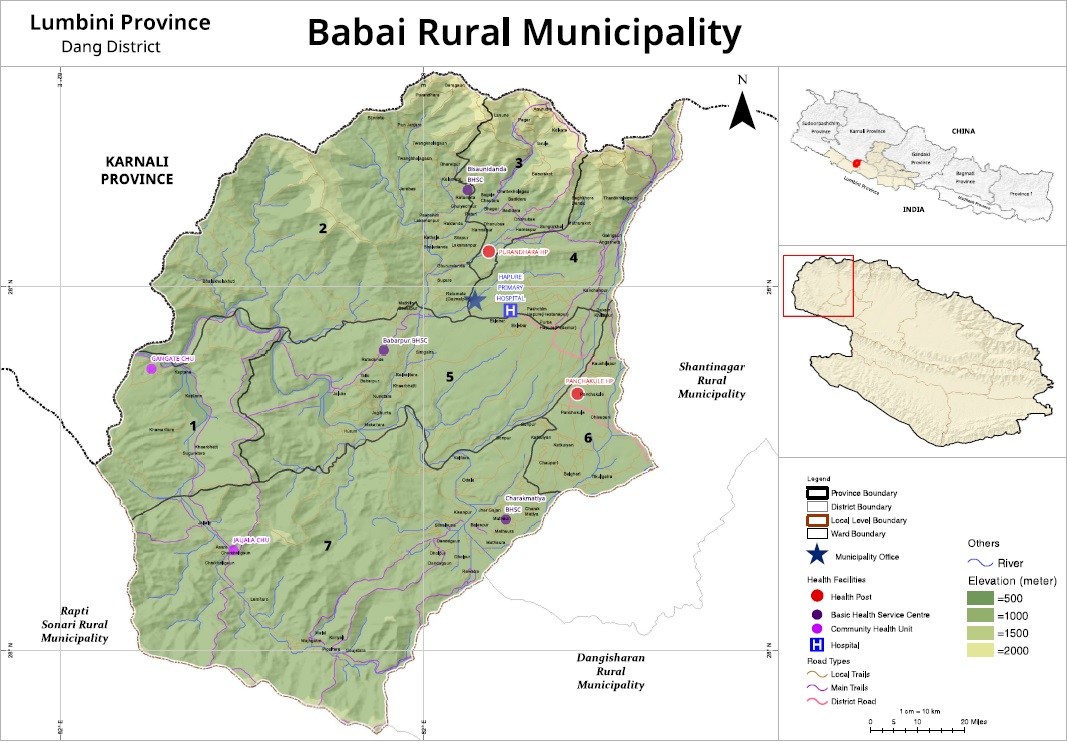
बबई गाउँपालिका नेपालको संविधान २०७२ को धारा २९५ को उपधारा (३) बमोजिम गठीत गाउँपालिका, नगरपालिका, स्वायत्त, संरक्षित वा विशेष क्षेत्रको नाम, संख्या तथा सिमाना निर्धारण आयोगको सिफारिसमा बनेको ७५३ वटा स्थानीय तह मध्येको लुम्विनी प्रदेश अन्तर्गतको दाङ जिल्लामा पर्ने एक स्थानीय तह हो । बबई गाउँपालिका जिल्ला सदरमुकाम घोराही देखि ४६ किलोमीटर पश्चिममा पर्दछ।पूर्वमा शान्तिनगर गाउँ पालिका पश्चिममा बाँके र सल्यान जिल्ला उत्तरमा सल्यान जिल्ला र दक्षिणमा दंगिसरण गाउँ पालिका र बाँके जिल्ला रहेको छ । साबिकका पुरन्धारा र पंचकुले गा.वि.स. समायोजन भई यस गाउँपालिकाको निर्माण भएको हो | यस गाउँपालिकाको कुल क्षेत्रफल २५७.४७ वर्ग किलोमिटर रहेको छ । २०६८ सालको जनगणना अनुसार यहाँको कूल जनसंख्या २८००० रहेको छ। यस गाउँपालिका ७ वटा वडा रहेका छन् | यस गाउँ पालिका समुद्र सतह देखि ६७६ मीटर उचाइमा रहेको छ । यस गाउँ पालिकामा बाहुन ,क्षत्रीय ,दलित चौधरी लगायतका जतिको बाहुल्यता रहेको छ । यस गाउँ पालिकाका मुख्य भाषा नेपाली, थारु रहेका छन् |
जनसाङ्खिक सूचक
-
कूल जनसंख्या ७
३१,९२२
/ -
१ बर्ष भन्दा मुनिको जनसंख्या ७
५८९
/ -
पाँच बर्ष भन्दा मुनिको जनसंख्या ७
२,९८३
/ -
किशोरावस्था (१०-१९ बर्ष) को जनसंख्या ७
६,१९०
/ -
प्रजनन उमेरका महिला (१५ -४९ बर्ष ) ७
९,५९५
/ -
अनुमानित गर्भवती महिलाहरु ७
७५१
/ -
अनुमानित जिवित जन्मको संख्या ७
५९०
/ -
परिवारमा अनुपस्थित (विदेशमा बस्ने) जनसंख्या २
३,१०७
-
मोबाइल फोन भएका घरधुरी (%) २
५४
-
टेलिभिजन भएका घरधुरी (%) २
१४
-
लैङ्गिक अनुपात २
८४
-
१४ बर्ष र सो भन्दा कम उमेरका जनसंख्या ७
७,८६४
-
६५ बर्ष र सो भन्दा माथि उमेरका जनसंख्या २
१,०५३
उमेर र लिंगको आधारमा जनसंख्या वितरण
जनगणना २०६८जातिगत आधारमा जनसंख्या वितरण
जनगणना २०६८वार्ड अनुसार जनसंख्या वितरण
जनगणना २०६८स्वास्थ्य सेवा प्रवाह गर्ने संस्थाहरु

- अस्पताल १
- प्रास्वाके -
- स्वास्थ्य चौकी २
- सामुदायिक स्वास्थ्य ईकाई १
- शहरी स्वास्थ्य केन्द्र -
- गाउँघर क्लिनिक २
- खोप क्लिनिक ९
- आधारभूत स्वस्थ सेवाकेन्द्र ४
- बर्थिंग सेन्टर ३
सरकारी संस्था
- अस्पताल तथा नर्सिंग होम -
- पोलिक्लिनिक १
- औषधि पसल ८
निजी (गैर-सरकारी संस्था समेत)
अन्य स्वास्थ्य केन्द्रहरु
- माइक्रोस्कोपी केन्द्र २
- एआरटि केन्द्र -
- एचाईभी परीक्षण केन्द्र -
- क्षयरोग उपचार केन्द्र २
- आयुर्वेद अस्पताल/केन्द्र १
- आँखा अस्पताल/केन्द्र -
अस्पताल शैयाहरू
- सार्वजनिक -
- निजी -
वडा अनुसार स्वास्थ्य संस्थाको जानकारी
| स्वास्थ्यसंस्थाको नाम | वार्ड न | बर्थिंग सेन्टर BEONC/CEONC | महिला स्वास्थ्य स्वयं सेवक संख्या | दक्ष प्रसुतिकर्मी संख्या | परिवार नियोजन *सेवा | स्वीकृत दरबन्दी | दरबन्दी अनुसार पदपूर्ति | करारका कर्मचारी |
|---|---|---|---|---|---|---|---|---|
| पुरनधारा स्वास्थ्य चौकी | ३ | प्रसुती केन्द्र | २६ | २ | ५ साधनहरू | ६ | ६ | ३ |
| पंचकुले स्वास्थ्य चौकी | ६ | प्रसुती केन्द्र | १९ | १ | ५ साधनहरू | ६ | ८ | ३ |
| हापुरे प्राथमिक अस्पताल | ४ | - | ७ | ० | ३ साधनहरू | ० | १ | ८ |
| आधारभुत स्वास्थ्य सेवा केन्द्र गंगटे | १ | - | ३ | १ | ४ साधनहरू | ० | १ | ३ |
| आधारभुत स्वास्थ्य सेवा बबरपुर | ५ | - | - | - | ३ साधनहरू | ० | ३ | - |
| आधारभुत स्वास्थ्य सेवा बिसौनिडाडा | २ | - | - | - | ३ साधनहरू | ० | २ | - |
| आधारभुत स्वास्थ्य सेवा चरकमटिया | ७ | - | - | - | ३ साधनहरू | ० | ३ | - |
| सामुदाईक स्वास्थ्य ईकाई जलजला | ७ | - | - | - | - | - | - | - |
| कुल कर्मचारी संख्या | ५५ | ४ | १२ | २४ | १७ | |||
स्वास्थ्य सेवाको लागि मानव संसाधन
- CEONC साइटहरू-
- BEONC साइटहरू-
- आइयुसीडी तथा इम्पलान्ट सेवा प्रदायक२
- एकीकृत बालरोग व्यवस्थापन (IMCI) प्रशिक्षित कर्मचारी४
- जनसंख्या (प्रति मस्वास्वका) ५८०
- जनसंख्या (प्रति स्वास्थ्यकर्मी) १३३०
- अनुमानित गर्भवति (प्रति दक्ष प्रसुतिकर्मी) १८८
- अनुमानित गर्भवति (प्रति बर्थिङ्ग सेन्टर) २५०
- जनसंख्या (प्रति स्वास्थ्य संस्था) (अस्पताल,प्रस्वाके र स्वाचौ सहित) -
- जनसंख्या (प्रति सरकारी अस्पताल) ३१९२२
- जनसंख्या (प्रति अस्पताल र नर्सिंग होम (सबै) ३१९२२
मातृशिशु बालस्वास्थ्य र परिवार नियोजन सेवा उपयोगको अवस्था
स्वास्थ्य सूचना व्यवस्थापन प्रणाली २०७८प्रमूख स्वास्थ्य सेवाहरूको उपयोगको तुलनात्मक अवस्था
| सूचक | बबई गाउँपालिका | लुम्बिनी प्रदेश २०७८/७९ | राष्ट्रीय २०७८/७९ | |||
|---|---|---|---|---|---|---|
| २०७६/७७ | २०७७/७८ | २०७८/७९ | ||||
| खाेप |
ग्राफ
तालिका
|
|||||
| बि.सि.जि. कभरेज | ८५.८ | ८९.४ | ९०.८ | १०३.१ | १०३.५ | |
| २३ महिनाभित्र पूर्ण खोप प्राप्त गरेका बालबालिका (%) | ० | ० | ० | ० | ० | |
| डि.पि.टि. - हेप बि - हिव ३ कभरेज | ८०.८ | ९६.१ | ११३.९ | ९६.६ | ९५.२ | |
| दादुरा रूबेला १ (९-११ महिना) कभरेज | ८८.६ | ९६.७ | १०८.१ | ९६.७ | ९४.७ | |
| जे.इ कभरेज | ७९.३ | ९८.४ | १०९ | ९८.९ | ९५.९ | |
| टि.डी. २ र टि. डी. २+ कभरेज | ५७.६ | ६६.५ | ७२.७ | ७३.९ | ७१.७ | |
| पोषण |
ग्राफ
तालिका
|
|||||
| कम जन्म तौल भएका नवजात शिशुको प्रतिशत | ०.४ | १.३ | ०.८१ | १२ | ९.४ | |
| नयाँ तौल लिएका १ वर्ष मुनिका शिशुहरुको प्रतिशत | ८२.७ | ८२.२ | १४५.४ | १०९ | १०४.१ | |
| नयाँ तौल लिएका २ वर्ष मुनिका शिशुहरु मध्ये अति जोखिम अवस्थाका बालबालिकाहरुको प्रतिशत | २.५ | ०.९ | ६६.९ | ३.५ | ३.६ | |
| गर्भवती अवस्थामा १८० दिन आइरन चक्की प्राप्त गरेका गर्भवती महिलाहरुको प्रतिशत | ५९.३ | ७२.८ | ५०.३ | ७५.८ | ६० | |
| सुत्केरी अवस्थामा भिटामिन ए प्राप्त गरेका महिलाहरुको प्रतिशत | ३८.६ | ३८.८ | ९३.७ | ९८.२ | ७६.३ | |
| नवजात शिशु तथा बाल रोगको एकीकृत व्यस्थापन |
ग्राफ
तालिका
|
|||||
| नाभी मलम लगाएका नवजात शिशुको प्रतिशत | ९९.३ | ९७.८ | ९३.७ | ९४.२ | ८२.९ | |
| ब्याक्टेरियाको गम्भीर संक्रमण भएकामध्ये जेन्टामाईसिन सुईद्वारा पूर्ण उपचार पाएको प्रतिशत | ५० | ० | २४.९ | ३९.५ | ४७.४ | |
| नयाँ निमोनिया बिरामीको दर (प्रति हजार पाँच वर्षमुनिका बालबालिकाहरुमा) | ७१.७ | ३५२.२ | ८७ | २९.३ | ३६.८ | |
| नयाँ एआरआई (स्वाशप्रश्वाका) बिरामी मध्ये कडा निमोनिया भएका बिरामीको प्रतिशत | ० | ० | १०१.६ | ०.०५ | ०.१८ | |
| नयाँ झाडापखालाका बिरामीको दर (प्रति हजार पाँच वर्ष मुनिका बालबालिकाहरुमा) | ४०९.५ | १६७.६ | २ | ३३९ | ३५२.४ | |
| ५ वर्ष मुनिका झाडापखालाका बिरामी मध्ये जिंक र पुनर्जलीय झोलबाट उपचार गरेको प्रतिशत | १०१.१ | ९६ | १०१.६ | ९८.७ | ९४.५ | |
| जम्मा नवजात शिशु मृत्यु संख्या | १ | १ | २ | ५७३ | १९१४ | |
| सुरक्षित मातृत्व तथा परिवार नियोजन |
ग्राफ
तालिका
|
|||||
| प्परोटोकल अनुसार पहिलो पटक गर्भवती जाँच गराएका गर्भवती महिलाहरुको प्रतिशत | ९९ | ७०.३ | ८६ | ९३.५ | ९१.४ | |
| प्रजनन् उमेरका महिलाहरुमा परिवार नियोजनको प्रयोगकर्ता दर (आधुनिक साधन) | ० | ० | ० | ० | ० | |
| ४ पटक गर्भवती जाँच (महिना: ४,६,८,९/हप्ता: १६, २०-२४,३२ र ३६) महिलाहरुको प्रतिशत | ५९.३ | ७२.६ | ६६.३ | ७९.७ | ७९.४ | |
| स्वास्थ्य संस्था प्रसुति दर | ३३.८ | ३२.८ | ३४ | ९४.२ | ७९ | |
| दक्ष प्रसुतिकर्मी/स्वास्थ्यकर्मीद्वारा प्रसुति गराएको प्रतिशत | ३३.८ | १०० | ३१.३ | ८९.८ | ७५ | |
| प्रोटोकल अनुसार ४ पटक (आ.व २०७८/७९ सम्म ३ पटक) सुत्केरी जाँच गराउने आमाहरुको प्रतिशत | ११.२ | १३ | २७ | ५३.७ | ४०.८ | |
| जम्मा मातृ मृत्यु संख्या | ० | ० | ० | ७४ | २३१ | |
| परिवार नियोजन सेवाका नयाँ सेवाग्राही दर (प्रजनन उमेरका महिलाहरु मध्ये) | १०.५ | ९ | १३.६ | १२.४ | ११.५ | |
| औलो रोग, क्षय रोग, कुष्ठरोग र एचआईभी |
ग्राफ
तालिका
|
|||||
| औलोको स्लाइड नमुना पोजेटिभ दर | १.४ | ० | ०.२९ | ०.२७ | ०.१७ | |
| डेंगुको जम्मा विरामी संख्या | ० | ० | ० | ० | ० | |
| आयातित औलोरोगको प्रतिशत (नयाँ औलो रोग मध्ये | ० | ० | १०० | ९५.५ | ८९.५ | |
| जम्मा औलो रोग मध्ये प्लाज्मोडियम फाल्सिपारमको अनुपात | ० | ० | ० | ३८.७ | २२.८ | |
| नयाँ क्षयरोगी बिरामी पत्ता लागेको दर | ११७ | १५२.४ | ० | १५७.४ | १२९.१ | |
| क्षयरोगको उपचार सफलता दर | ८० | ८९.१ | ० | ९१ | ९१.५ | |
| कुष्ठरोगको रोग प्रकोप दर (प्रति १०००० मा) | ० | ०.१३ | ० | ०.९ | ० | |
| ए. आर. टी. उपचारमा रहेका जम्मा एच. आइ. भी. पोजेटिभको संख्या | ० | ० | ० | ४३२६ | २२१५२ | |
| उपचारात्मक सेवा |
ग्राफ
तालिका
|
|||||
| ओ पि डी मा आएका बिरामी मध्ये नयाँ बिरामीको दर | ४५.७ | ३४.२ | ४८.७ | ९४.५ | ९२ | |
शीर्ष १० स्वास्थ्य अवस्थाको सूची
स्वास्थ्य सूचना व्यवस्थापन प्रणाली २०७८७९स्वास्थ्य क्षेत्रमा बजेट
- सशर्त स्वास्थ्यमा छुट्याएको बजेट
- समानीकरणबाट विनियोजित स्वास्थ्य बजेट
- अन्य श्रोतबाट बिनियोजित स्वास्थ्य बजेट
| बजेट | बबई गाउँपालिका | |||||
|---|---|---|---|---|---|---|
| २०७७/७८ | २०७८/७९ | २०७९/८० | ||||
| ग्राफ | ||||||
| पालिकाको कुल बजेट (रु ) | ५०९,८५८,००० | ५२८,३२५,००० | ५६०,०२४,५०० | |||
| स्वास्थ्य बजेट (सबै स्रोत) | २४,४००,००० | २९,०००,००० | ३०,५००,००० | |||
| सशर्त स्वास्थ्यमा छुट्याएको बजेट | १५,४००,००० | १७,७००,००० | २०,५००,००० | |||
| समानीकरणबाट विनियोजित स्वास्थ्य बजेट | ४,०००,००० | ११,३००,००० | १०,०००,००० | |||
| अन्य श्रोतबाट बिनियोजित स्वास्थ्य बजेट | ५,०००,००० | |||||
| बजेट खर्च (%) | ८५ | - | ९८ | |||
| तालिका | ||||||
महत्वपूर्ण सम्पर्क
सूचना तथा संचार प्रविधि अधिकृत
नाम : भुबन चन्द बालन
सम्पर्क : ९८४३१५५५१०
ईमेल : ito.babaimun@gmail.com

यो प्रोफाइल अमेरिकी अन्तर्राष्ट्रिय विकास नियोग (युएसएआइडी) मार्फत अमेरिकी जनताहरुको सहयोगका कारण सम्भव बनेको हो । यो प्रतिवेदन भित्रका विषयवस्तु र सामग्री स्वास्थ्यका लागि सक्षम प्रणालीका एकल जिम्मेवारी हुन् र तिनले युएसएआइडी वा अमेरिकी सरकारको विचारको प्रतिविम्बित गर्छन् भन्ने जरुरी छैन ।