संक्षिप्त परिचय बागचौर नगरपालिका
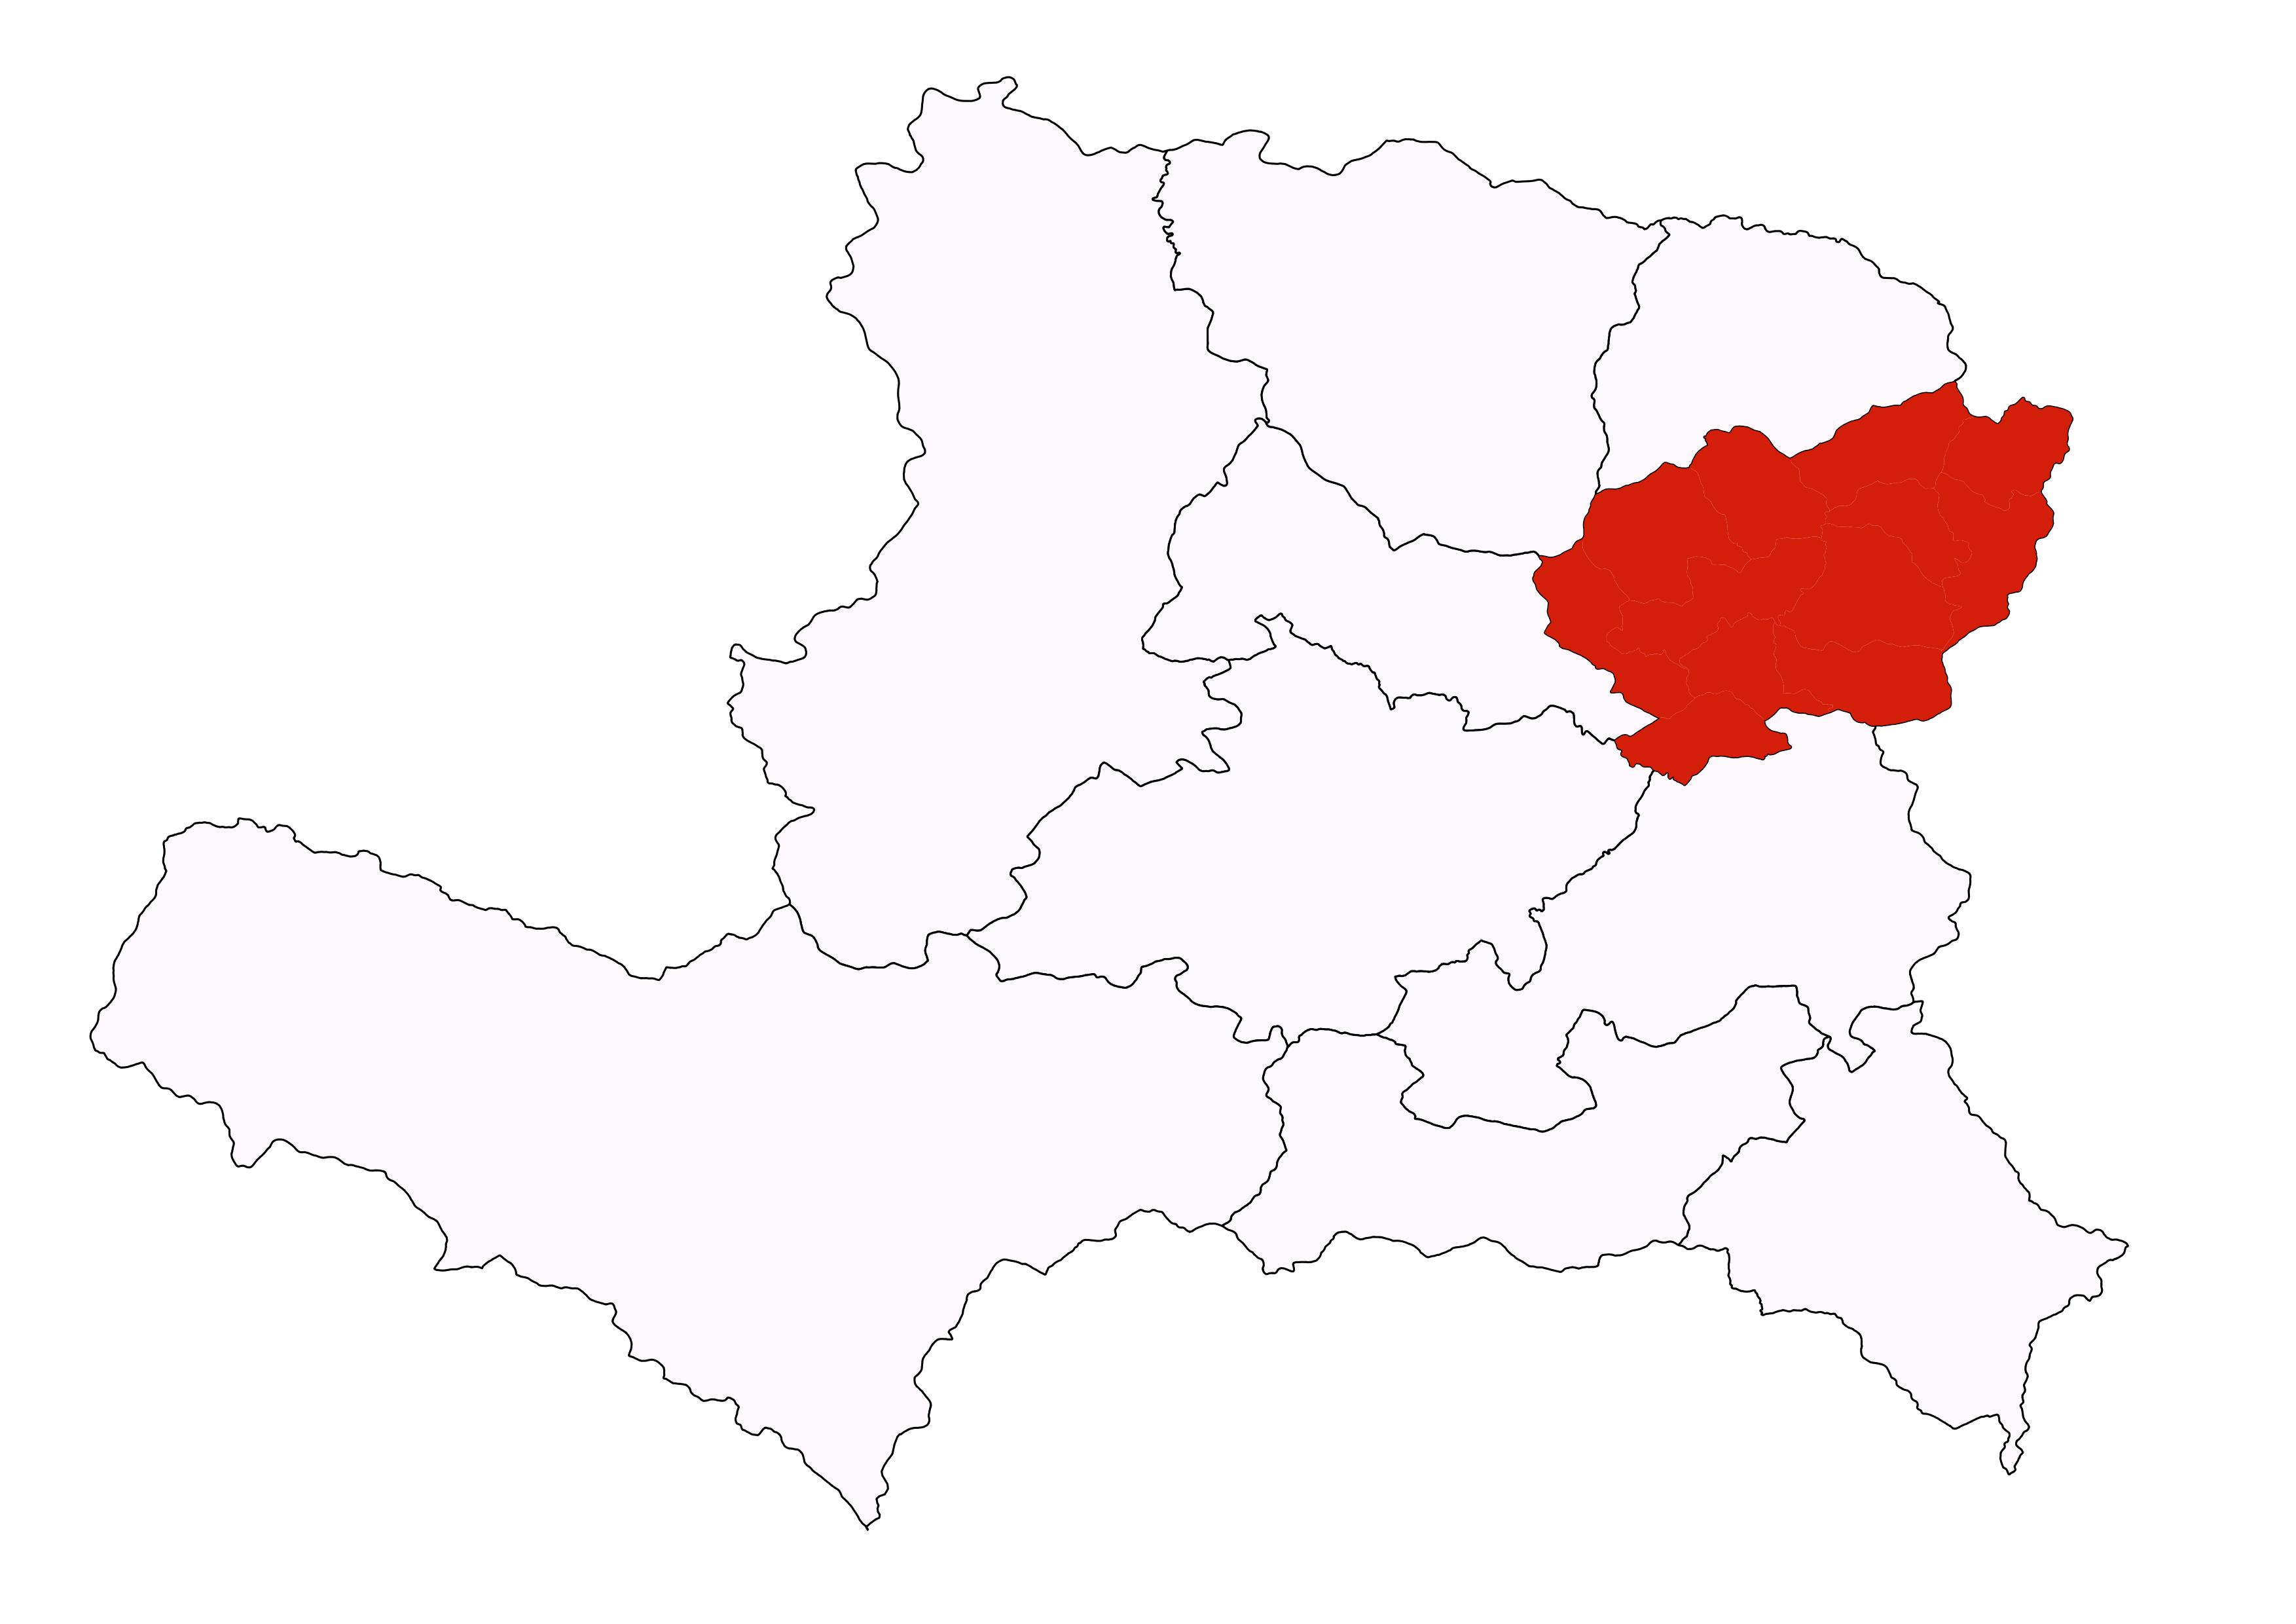
पश्चिम नेपालकाे मध्य पहाडी भूभागमा रहेकाे कर्णाली प्रदेश अन्तर्गत साविककाे राप्ती अञ्चलकाे सल्यान जिल्लामा पर्ने बागचाैर नगरपालिकाकाे उत्तर तर्फ पश्चिम रूकुम तथा दार्मा गाउँपालिका, दक्षिणतर्फ छत्रेश्वरी गाउँपालिका, पश्चिम तर्फ सिध्दकुमाख गाउँपालिका तथा शारदा नगरपालिका र पूर्व तिर राेल्पा जिल्ला रहेकाे छ । यस नगरपालिकाकाे कुल क्षेत्रफल १६३.१४ बर्ग कि.मी. रहेकाे छ । यस नगरपालिका समुद्रि सतहबाट करिब ११०० देखी २२०० मी. काे उचाइमा रहेकाे छ ।
जनसाङ्खिक सूचक
-
कूल जनसंख्या २
३४,०२१
-
१ बर्ष भन्दा मुनिको जनसंख्या १
६७१
-
पाँच बर्ष भन्दा मुनिको जनसंख्या २
३,१९४
-
किशोरावस्था (१०-१९ बर्ष) को जनसंख्या २
७,८६०
-
प्रजनन उमेरका महिला (१५ -४९ बर्ष ) २
९,९५०
-
अनुमानित गर्भवती महिलाहरु १
१,०७०
/ -
अनुमानित जिवित जन्मको संख्या १
६८३
-
परिवारमा अनुपस्थित (विदेशमा बस्ने) जनसंख्या २
२,९९१
-
मोबाइल फोन भएका घरधुरी (%) २
६,१८९
-
टेलिभिजन भएका घरधुरी (%) २
८०९
-
लैङ्गिक अनुपात २
९४
-
१४ बर्ष र सो भन्दा कम उमेरका जनसंख्या २
१०,५१७
-
६५ बर्ष र सो भन्दा माथि उमेरका जनसंख्या २
१,९७२
उमेर र लिंगको आधारमा जनसंख्या वितरण
जनगणना २०७८जातिगत आधारमा जनसंख्या वितरण
जनगणना २०७८वार्ड अनुसार जनसंख्या वितरण
घरघुरी सर्वेक्षण २०७८स्वास्थ्य सेवा प्रवाह गर्ने संस्थाहरु

- अस्पताल -
- प्रास्वाके १
- स्वास्थ्य चौकी ५
- सामुदायिक स्वास्थ्य ईकाई -
- शहरी स्वास्थ्य केन्द्र १
- गाउँघर क्लिनिक २४
- खोप क्लिनिक २८
- आधारभूत स्वस्थ सेवाकेन्द्र ५
- बर्थिंग सेन्टर ६
सरकारी संस्था
- अस्पताल तथा नर्सिंग होम -
- पोलिक्लिनिक ४
- औषधि पसल १३
निजी (गैर-सरकारी संस्था समेत)
अन्य स्वास्थ्य केन्द्रहरु
- माइक्रोस्कोपी केन्द्र १
- एआरटि केन्द्र -
- एचाईभी परीक्षण केन्द्र -
- क्षयरोग उपचार केन्द्र ६
- आयुर्वेद अस्पताल/केन्द्र -
- आँखा अस्पताल/केन्द्र १
अस्पताल शैयाहरू
- सार्वजनिक -
- निजी -
वडा अनुसार स्वास्थ्य संस्थाको जानकारी
| स्वास्थ्यसंस्थाको नाम | वार्ड न | बर्थिंग सेन्टर BEONC/CEONC | महिला स्वास्थ्य स्वयं सेवक संख्या | दक्ष प्रसुतिकर्मी संख्या | परिवार नियोजन *सेवा | स्वीकृत दरबन्दी | दरबन्दी अनुसार पदपूर्ति | करारका कर्मचारी |
|---|---|---|---|---|---|---|---|---|
| थारमारे प्रा. स्वा. के | २ | BEONC | ९ | २ | ५ साधनहरू | ११ | ११ | ३ |
| बाफुखाेला स्वा. के. | १२ | बर्थिङ सेन्टर | ९ | २ | ५ साधनहरू | ६ | ६ | १ |
| काेटबारा स्वा. के. | ७ | बर्थिङ सेन्टर | ९ | २ | ४ साधनहरू | ६ | ६ | १ |
| शिवरथ स्वा. के. | ४ | बर्थिङ सेन्टर | ९ | २ | ४ साधनहरू | ६ | ६ | ३ |
| काेटमाैला स्वा. के. | ८ | बर्थिङ सेन्टर | ९ | २ | ४ साधनहरू | ६ | ६ | १ |
| पिपलनेटा स्वा. के. | १० | बर्थिङ सेन्टर | ९ | १ | ४ साधनहरू | ६ | ६ | १ |
| चाैरपानी आधारभुत स्वास्थ्य केन्द्र | ३ | - | - | - | ३ साधनहरू | - | - | ३ |
| खाेरबारे आधारभुत स्वास्थ्य केन्द्र | ९ | - | - | - | ३ साधनहरू | - | - | २ |
| जामुनेचाैर आधारभूत स्वास्थ्य केन्द्र | ६ | - | - | - | ३ साधनहरू | - | - | २ |
| आधारभूत स्वास्थ्य सेवा केन्द्र पानीचौर | ११ | - | - | - | ३ साधनहरू | - | - | २ |
| आधारभूत स्वास्थ्य सेवा केन्द्र बाहुनथाना | ५ | - | - | - | ३ साधनहरू | - | - | ३ |
| कुल कर्मचारी संख्या | ५४ | ११ | ४१ | ४१ | २२ | |||
स्वास्थ्य सेवाको लागि मानव संसाधन
- CEONC साइटहरू-
- BEONC साइटहरू१
- आइयुसीडी तथा इम्पलान्ट सेवा प्रदायक६
- एकीकृत बालरोग व्यवस्थापन (IMCI) प्रशिक्षित कर्मचारी२३
- जनसंख्या (प्रति मस्वास्वका) ६३०
- जनसंख्या (प्रति स्वास्थ्यकर्मी) ८३०
- अनुमानित गर्भवति (प्रति दक्ष प्रसुतिकर्मी) ९७
- अनुमानित गर्भवति (प्रति बर्थिङ्ग सेन्टर) १७८
- जनसंख्या (प्रति स्वास्थ्य संस्था) (अस्पताल,प्रस्वाके र स्वाचौ सहित) ५६७०
- जनसंख्या (प्रति सरकारी अस्पताल) -
- जनसंख्या (प्रति अस्पताल र नर्सिंग होम (सबै) -
मातृशिशु बालस्वास्थ्य र परिवार नियोजन सेवा उपयोगको अवस्था
स्वास्थ्य सूचना व्यवस्थापन प्रणाली २०७९प्रमूख स्वास्थ्य सेवाहरूको उपयोगको तुलनात्मक अवस्था
| सूचक | बागचौर नगरपालिका | कर्णाली प्रदेश २०७८/७९ | राष्ट्रीय २०७८/७९ | |||
|---|---|---|---|---|---|---|
| २०७६/७७ | २०७७/७८ | २०७८/७९ | ||||
| खाेप |
ग्राफ
तालिका
|
|||||
| बि.सि.जि. कभरेज | ८२.९ | ९३.४ | ९४.४ | ९२ | १०३.५ | |
| २३ महिनाभित्र पूर्ण खोप प्राप्त गरेका बालबालिका (%) | ० | ० | ० | ० | ० | |
| डि.पि.टि. - हेप बि - हिव ३ कभरेज | ८२.३ | ८९.८ | १०८ | ९४ | ९५.२ | |
| दादुरा रूबेला १ (९-११ महिना) कभरेज | ८२.६ | ८७ | १०० | ९५ | ९४.७ | |
| जे.इ कभरेज | ९१.१ | ९९.७ | १०८.६ | ९६ | ९५.९ | |
| टि.डी. २ र टि. डी. २+ कभरेज | ४५.५ | ५६.२ | ५९.५ | ६६ | ७१.७ | |
| पोषण |
ग्राफ
तालिका
|
|||||
| कम जन्म तौल भएका नवजात शिशुको प्रतिशत | ४.४ | ३.४ | ७.७९ | ६.८ | ९.४ | |
| नयाँ तौल लिएका १ वर्ष मुनिका शिशुहरुको प्रतिशत | १०१.१ | ११०.४ | १५९.४ | १२० | १०४.१ | |
| नयाँ तौल लिएका २ वर्ष मुनिका शिशुहरु मध्ये अति जोखिम अवस्थाका बालबालिकाहरुको प्रतिशत | २ | १.५ | १.७ | ४.१ | ३.६ | |
| गर्भवती अवस्थामा १८० दिन आइरन चक्की प्राप्त गरेका गर्भवती महिलाहरुको प्रतिशत | ६५.३ | ६४.७ | ७५.३ | ७३ | ६० | |
| सुत्केरी अवस्थामा भिटामिन ए प्राप्त गरेका महिलाहरुको प्रतिशत | ६९.२ | ६५.९ | ७५.२ | ८८ | ७६.३ | |
| नवजात शिशु तथा बाल रोगको एकीकृत व्यस्थापन |
ग्राफ
तालिका
|
|||||
| नाभी मलम लगाएका नवजात शिशुको प्रतिशत | ९७.२ | ९८.६ | १०० | ९६ | ८२.९ | |
| ब्याक्टेरियाको गम्भीर संक्रमण भएकामध्ये जेन्टामाईसिन सुईद्वारा पूर्ण उपचार पाएको प्रतिशत | ८२.९ | ९२ | ९५.८९ | ७५ | ४७.४ | |
| नयाँ निमोनिया बिरामीको दर (प्रति हजार पाँच वर्षमुनिका बालबालिकाहरुमा) | ११२.६ | १४६.८ | १३४.७ | ११३ | ३६.८ | |
| नयाँ एआरआई (स्वाशप्रश्वाका) बिरामी मध्ये कडा निमोनिया भएका बिरामीको प्रतिशत | ०.१ | ० | ० | ०.४१ | ०.१८ | |
| नयाँ झाडापखालाका बिरामीको दर (प्रति हजार पाँच वर्ष मुनिका बालबालिकाहरुमा) | ५९६.९ | ५८६ | ६३०.४ | ५७९ | ३५२.४ | |
| ५ वर्ष मुनिका झाडापखालाका बिरामी मध्ये जिंक र पुनर्जलीय झोलबाट उपचार गरेको प्रतिशत | ९८.६ | १००.६ | १०० | ९५ | ९४.५ | |
| जम्मा नवजात शिशु मृत्यु संख्या | ३ | २ | १ | १९९ | १९१४ | |
| सुरक्षित मातृत्व तथा परिवार नियोजन |
ग्राफ
तालिका
|
|||||
| प्परोटोकल अनुसार पहिलो पटक गर्भवती जाँच गराएका गर्भवती महिलाहरुको प्रतिशत | ८९.३ | ९५.५ | ९४.४ | १२२ | ९१.४ | |
| प्रजनन् उमेरका महिलाहरुमा परिवार नियोजनको प्रयोगकर्ता दर (आधुनिक साधन) | ० | २९ | ३४ | ० | ० | |
| ४ पटक गर्भवती जाँच (महिना: ४,६,८,९/हप्ता: १६, २०-२४,३२ र ३६) महिलाहरुको प्रतिशत | ६४.५ | ६२.४ | ७२.७ | ७३ | ७९.४ | |
| स्वास्थ्य संस्था प्रसुति दर | ६५.१ | ६३.४ | ७२ | ८३ | ७९ | |
| दक्ष प्रसुतिकर्मी/स्वास्थ्यकर्मीद्वारा प्रसुति गराएको प्रतिशत | ६५ | ५९.३ | ५१ | ७० | ७५ | |
| प्रोटोकल अनुसार ४ पटक (आ.व २०७८/७९ सम्म ३ पटक) सुत्केरी जाँच गराउने आमाहरुको प्रतिशत | ७.२ | ५.६ | ६०.९ | ५३ | ४०.८ | |
| जम्मा मातृ मृत्यु संख्या | ० | ० | ० | १७ | २३१ | |
| परिवार नियोजन सेवाका नयाँ सेवाग्राही दर (प्रजनन उमेरका महिलाहरु मध्ये) | १४.९ | १८.४ | १७ | १९ | ११.५ | |
| औलो रोग, क्षय रोग, कुष्ठरोग र एचआईभी |
ग्राफ
तालिका
|
|||||
| औलोको स्लाइड नमुना पोजेटिभ दर | ० | ० | ० | ०.२५ | ०.१७ | |
| डेंगुको जम्मा विरामी संख्या | ० | ० | ० | ० | ० | |
| आयातित औलोरोगको प्रतिशत (नयाँ औलो रोग मध्ये | ० | ० | ० | ६३ | ८९.५ | |
| जम्मा औलो रोग मध्ये प्लाज्मोडियम फाल्सिपारमको अनुपात | ० | ० | ० | २.१ | २२.८ | |
| नयाँ क्षयरोगी बिरामी पत्ता लागेको दर | २०.९ | २५.८ | ० | ९७ | १२९.१ | |
| क्षयरोगको उपचार सफलता दर | ९० | ८३.३ | ० | ९१ | ९१.५ | |
| कुष्ठरोगको रोग प्रकोप दर (प्रति १०००० मा) | ०..४७ | ०..३८ | ० | ०.५ | ० | |
| ए. आर. टी. उपचारमा रहेका जम्मा एच. आइ. भी. पोजेटिभको संख्या | ० | ० | ० | ६९१ | २२१५२ | |
| उपचारात्मक सेवा |
ग्राफ
तालिका
|
|||||
| ओ पि डी मा आएका बिरामी मध्ये नयाँ बिरामीको दर | ७८.८ | ७२.९ | ० | १०५ | ९२ | |
शीर्ष १० स्वास्थ्य अवस्थाको सूची
स्वास्थ्य सूचना व्यवस्थापन प्रणाली २०७८-७९स्वास्थ्य क्षेत्रमा बजेट
- सशर्त स्वास्थ्यमा छुट्याएको बजेट
- समानीकरणबाट विनियोजित स्वास्थ्य बजेट
- अन्य श्रोतबाट बिनियोजित स्वास्थ्य बजेट
| बजेट | बागचौर नगरपालिका | |||||
|---|---|---|---|---|---|---|
| २०७७/७८ | २०७८/७९ | २०७९/८० | ||||
| ग्राफ | ||||||
| पालिकाको कुल बजेट (रु ) | ७१६,३६३,००० | ७२४,१४०,००० | ८१३,१७२,००० | |||
| स्वास्थ्य बजेट (सबै स्रोत) | ५८,८००,००० | ५०,४४०,१२० | ४१,७१६,००० | |||
| सशर्त स्वास्थ्यमा छुट्याएको बजेट | ३५,३००,००० | ३७,५१६,००० | ३७,५१६,००० | |||
| समानीकरणबाट विनियोजित स्वास्थ्य बजेट | २३,५००,००० | १२,९२४,१२० | ४,२००,००० | |||
| अन्य श्रोतबाट बिनियोजित स्वास्थ्य बजेट | - | |||||
| बजेट खर्च (%) | ८१ | ९९ | ९९ | |||
| तालिका | ||||||
महत्वपूर्ण सम्पर्क

यो प्रोफाइल अमेरिकी अन्तर्राष्ट्रिय विकास नियोग (युएसएआइडी) मार्फत अमेरिकी जनताहरुको सहयोगका कारण सम्भव बनेको हो । यो प्रतिवेदन भित्रका विषयवस्तु र सामग्री स्वास्थ्यका लागि सक्षम प्रणालीका एकल जिम्मेवारी हुन् र तिनले युएसएआइडी वा अमेरिकी सरकारको विचारको प्रतिविम्बित गर्छन् भन्ने जरुरी छैन ।