संक्षिप्त परिचय बंगलाचुली गाउँपालिका
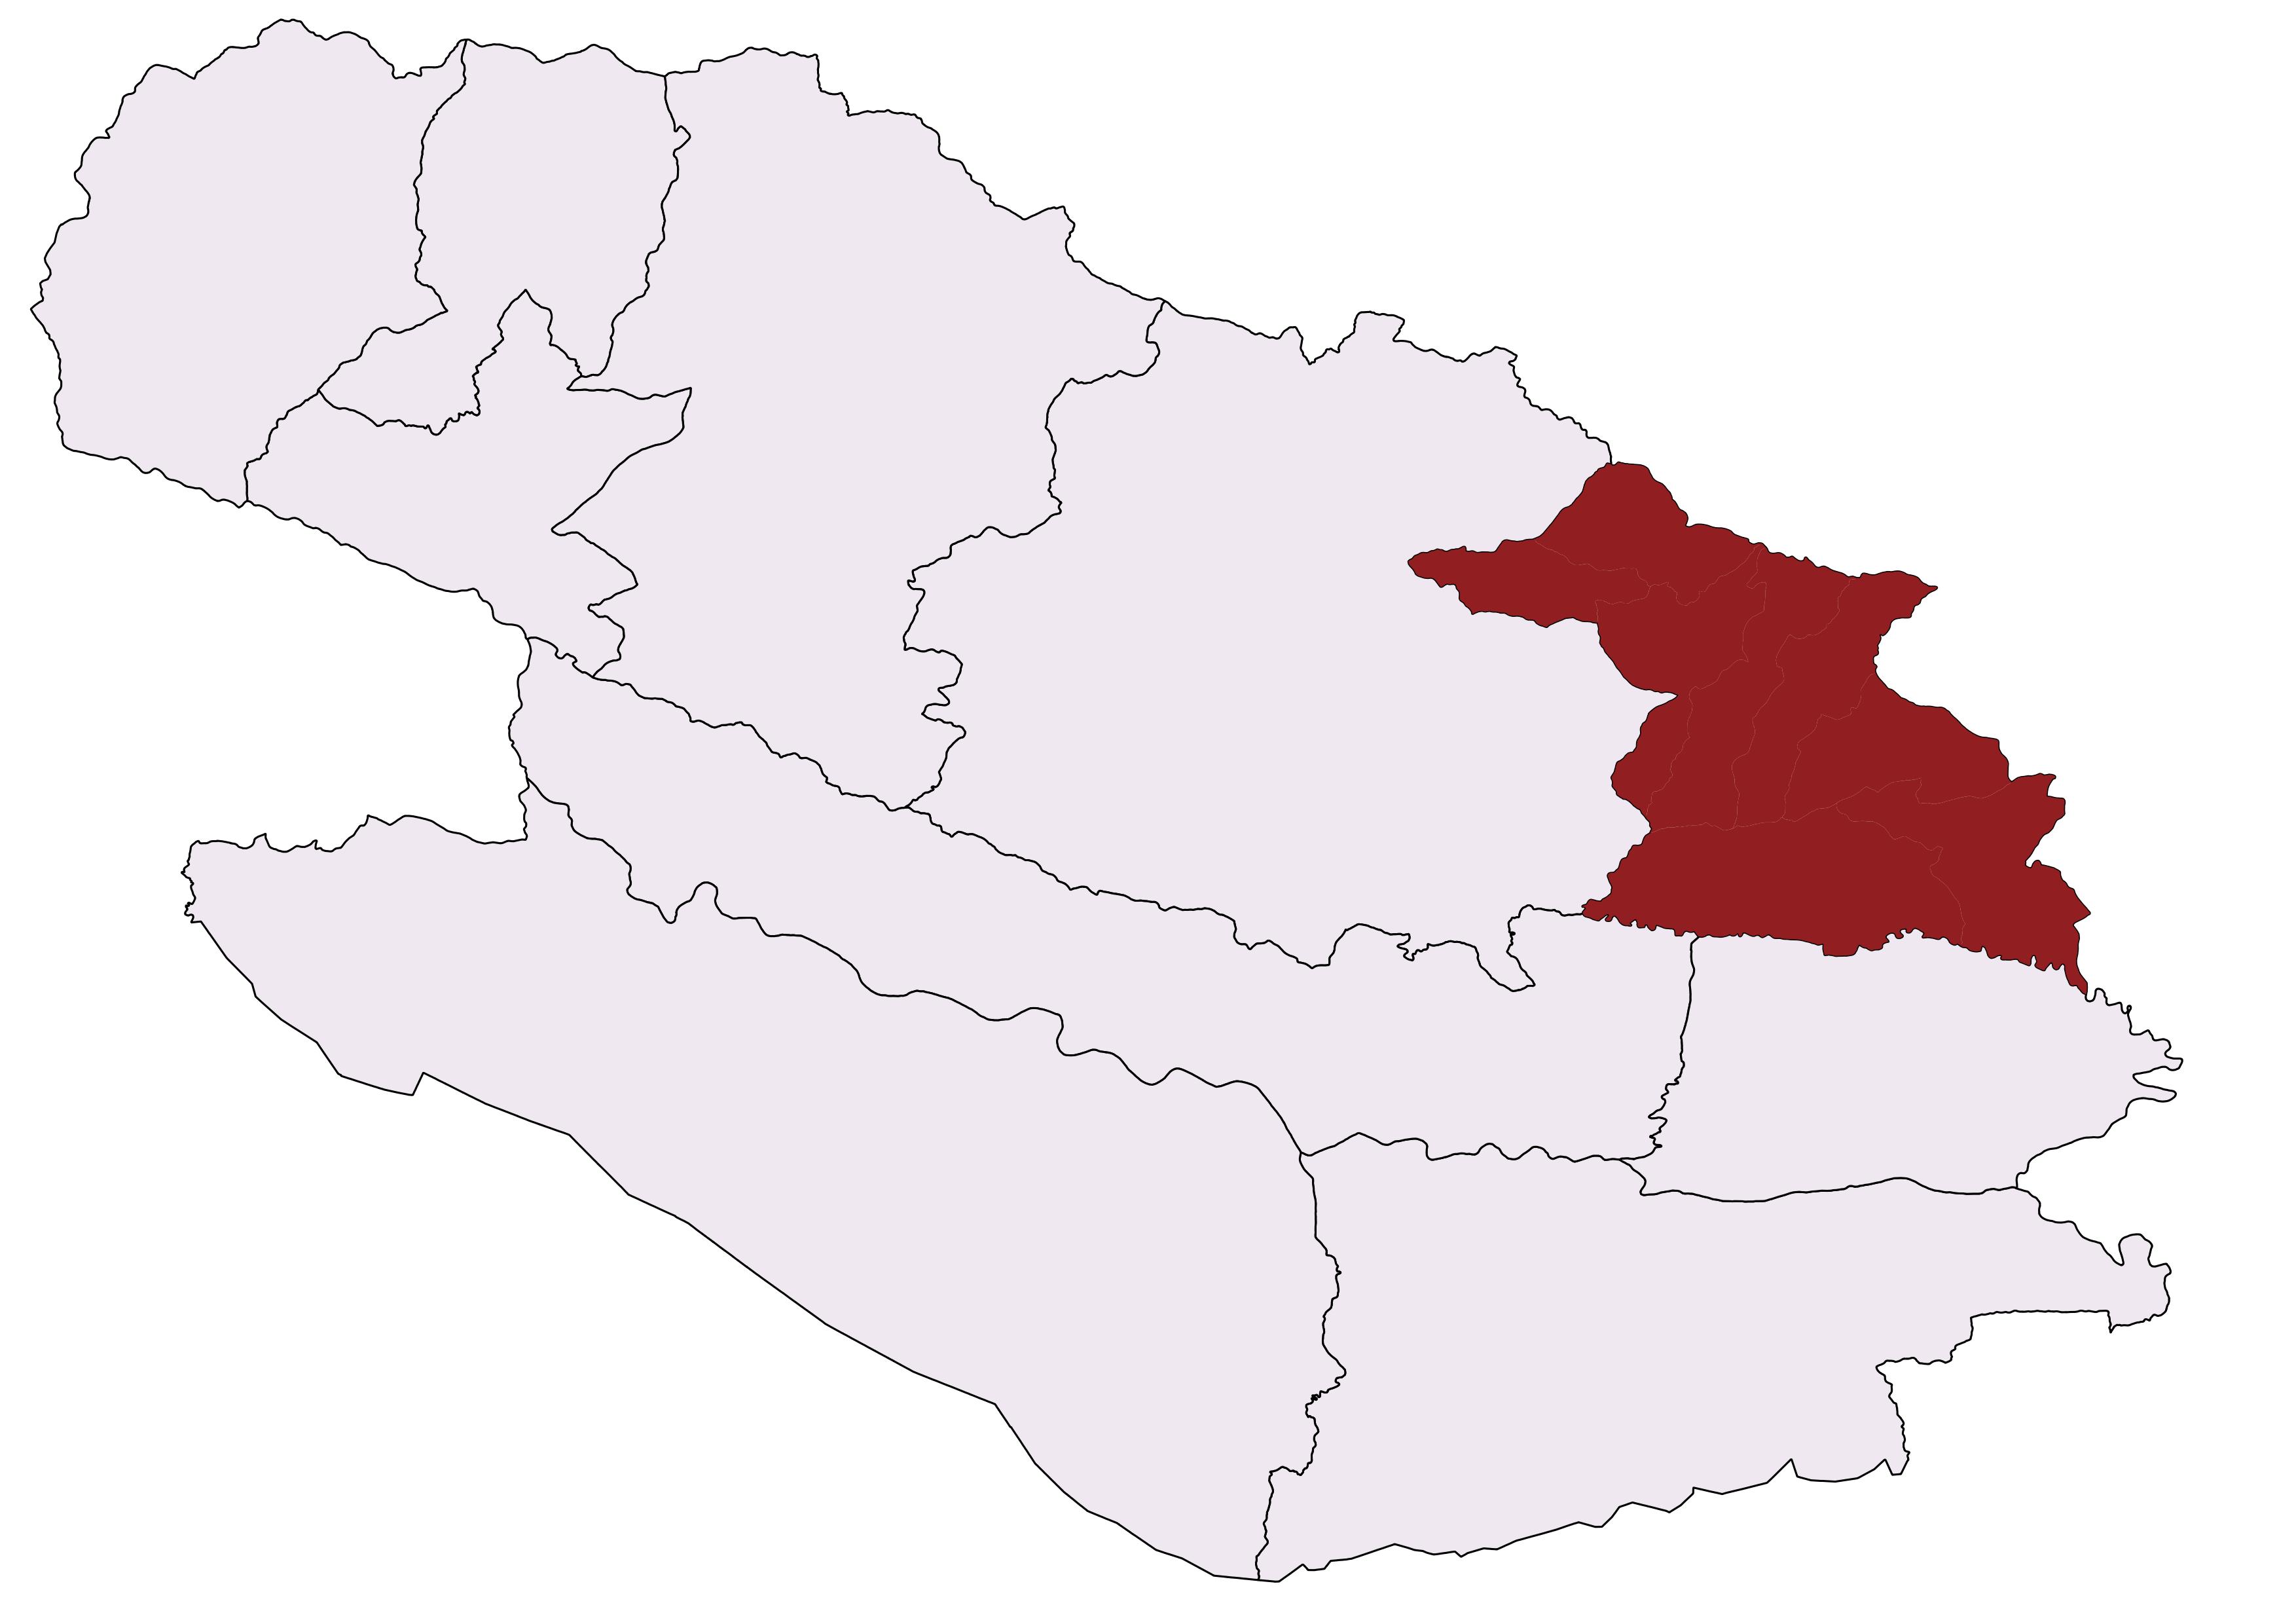
बंगलाचुली गाउँपालिका नेपाल को लुम्विनी प्रदेशको दाङ जिल्ला मा पर्दछ। यस गाउँपलिकाको स्थापना साबिकका स्युजा (१-९), काभ्रे(१-९), लोहारपानी(१-९) र हासिपुर(३-९) ४ वटा साबिकका गा.बि.स समाबेस गरी गाउँपालिका स्थापना गरिएको हो । २४५.१४ वर्ग कि.मी. क्षेत्रफल रहेको यस गाउँपालिकाको पूर्व र उत्तरमा प्युठान, पश्चिममा घोराही उ.म.न.पा., दक्षिणमा राप्ति गाउँपालिका र लमही नगरपालिका पर्दछ । राष्ट्रिय जनगणना, २०६८ का अनुसार यस गाउँपालिकाको जनसंख्या २४,२४५ रहेको छ जसमध्ये पुरुष १०,८७९ र महिला १३,३६६ रहेका छन् ।
जनसाङ्खिक सूचक
-
कूल जनसंख्या ७
२३,४५८
-
१ बर्ष भन्दा मुनिको जनसंख्या ७
५९४
-
पाँच बर्ष भन्दा मुनिको जनसंख्या ७
२,९९८
-
किशोरावस्था (१०-१९ बर्ष) को जनसंख्या ७
५,४६२
-
प्रजनन उमेरका महिला (१५ -४९ बर्ष ) ७
६,४२७
-
अनुमानित गर्भवती महिलाहरु ७
७६६
-
अनुमानित जिवित जन्मको संख्या ७
६१२
-
परिवारमा अनुपस्थित (विदेशमा बस्ने) जनसंख्या २
३,४५०
-
मोबाइल फोन भएका घरधुरी (%) २
५२
-
टेलिभिजन भएका घरधुरी (%) २
२
-
लैङ्गिक अनुपात २
७८
-
१४ बर्ष र सो भन्दा कम उमेरका जनसंख्या ७
९,००१
-
६५ बर्ष र सो भन्दा माथि उमेरका जनसंख्या २
६३१
उमेर र लिंगको आधारमा जनसंख्या वितरण
जनगणना २०७८जातिगत आधारमा जनसंख्या वितरण
जनगणना २०६८वार्ड अनुसार जनसंख्या वितरण
जनगणना २०६८स्वास्थ्य सेवा प्रवाह गर्ने संस्थाहरु

- अस्पताल १
- प्रास्वाके १
- स्वास्थ्य चौकी २
- सामुदायिक स्वास्थ्य ईकाई १
- शहरी स्वास्थ्य केन्द्र -
- गाउँघर क्लिनिक १३
- खोप क्लिनिक १९
- आधारभूत स्वस्थ सेवाकेन्द्र ४
- बर्थिंग सेन्टर ६
सरकारी संस्था
- अस्पताल तथा नर्सिंग होम -
- पोलिक्लिनिक -
- औषधि पसल ७
निजी (गैर-सरकारी संस्था समेत)
अन्य स्वास्थ्य केन्द्रहरु
- माइक्रोस्कोपी केन्द्र ४
- एआरटि केन्द्र -
- एचाईभी परीक्षण केन्द्र -
- क्षयरोग उपचार केन्द्र ५
- आयुर्वेद अस्पताल/केन्द्र १
- आँखा अस्पताल/केन्द्र -
अस्पताल शैयाहरू
- सार्वजनिक -
- निजी -
वडा अनुसार स्वास्थ्य संस्थाको जानकारी
| स्वास्थ्यसंस्थाको नाम | वार्ड न | बर्थिंग सेन्टर BEONC/CEONC | महिला स्वास्थ्य स्वयं सेवक संख्या | दक्ष प्रसुतिकर्मी संख्या | परिवार नियोजन *सेवा | स्वीकृत दरबन्दी | दरबन्दी अनुसार पदपूर्ति | करारका कर्मचारी |
|---|---|---|---|---|---|---|---|---|
| काभ्रे स्वास्थ्य चौकी | ३ | प्रसुती केन्द्र | १२ | ३ | ५ साधनहरू | ६ | ५ | ६ |
| लोहारपानि स्वास्थ्य चौकी | ५ | प्रसुती केन्द्र | ६ | ३ | ३ साधनहरू | ६ | ४ | २ |
| सिउजा स्वास्थ्य चौकी | १ | प्रसुती केन्द्र | ७ | २ | ४ साधनहरू | १० | ६ | ४ |
| हाँसिपुर स्वास्थ्य चौकी | ८ | प्रसुती केन्द्र | ६ | १ | ४ साधनहरू | ६ | १ | ३ |
| बढिपोखरा आधारभुत स्वास्थ्य सेवा केन्द्र | २ | - | ५ | ० | ३ साधनहरू | ० | १ | ३ |
| डाबर आधारभुत स्वास्थ्य सेवा केन्द्र | ४ | प्रसुती केन्द्र | ५ | ० | ३ साधनहरू | ० | २ | ३ |
| भुटनेटा आधारभुत स्वास्थ्य सेवा केन्द्र | ६ | - | ६ | १ | ५ साधनहरू | ० | ० | ४ |
| लहपे आधारभुत स्वास्थ्य सेवा केन्द्र | ७ | प्रसुती केन्द्र | ८ | ० | ३ साधनहरू | ० | ० | ४ |
| तापा सामुदायिक स्वास्थ्य ईकाई | ३ | - | ० | ० | ३ साधनहरू | ० | ० | ३ |
| कुल कर्मचारी संख्या | ५५ | १० | २८ | १९ | ३२ | |||
स्वास्थ्य सेवाको लागि मानव संसाधन
- CEONC साइटहरू-
- BEONC साइटहरू१
- आइयुसीडी तथा इम्पलान्ट सेवा प्रदायक२
- एकीकृत बालरोग व्यवस्थापन (IMCI) प्रशिक्षित कर्मचारी७
- जनसंख्या (प्रति मस्वास्वका) ४२७
- जनसंख्या (प्रति स्वास्थ्यकर्मी) १२३५
- अनुमानित गर्भवति (प्रति दक्ष प्रसुतिकर्मी) ७७
- अनुमानित गर्भवति (प्रति बर्थिङ्ग सेन्टर) १२८
- जनसंख्या (प्रति स्वास्थ्य संस्था) (अस्पताल,प्रस्वाके र स्वाचौ सहित) ५८६५
- जनसंख्या (प्रति सरकारी अस्पताल) २३४५८
- जनसंख्या (प्रति अस्पताल र नर्सिंग होम (सबै) २३४५८
मातृशिशु बालस्वास्थ्य र परिवार नियोजन सेवा उपयोगको अवस्था
स्वास्थ्य सूचना व्यवस्थापन प्रणाली २०७९प्रमूख स्वास्थ्य सेवाहरूको उपयोगको तुलनात्मक अवस्था
| सूचक | बंगलाचुली गाउँपालिका | लुम्बिनी प्रदेश २०७८/७९ | राष्ट्रीय २०७८/७९ | |||
|---|---|---|---|---|---|---|
| २०७६/७७ | २०७७/७८ | २०७८/७९ | ||||
| खाेप |
ग्राफ
तालिका
|
|||||
| बि.सि.जि. कभरेज | ७२ | १२२.८ | ८४.६ | १०३.१ | १०३.५ | |
| २३ महिनाभित्र पूर्ण खोप प्राप्त गरेका बालबालिका (%) | ० | ० | ० | ० | ० | |
| डि.पि.टि. - हेप बि - हिव ३ कभरेज | ६४ | १०४.७ | १०५ | ९६.६ | ९५.२ | |
| दादुरा रूबेला १ (९-११ महिना) कभरेज | ७९ | ७८.२ | ११५.९ | ९६.७ | ९४.७ | |
| जे.इ कभरेज | ५० | ४९.४ | १०९.५ | ९८.९ | ९५.९ | |
| टि.डी. २ र टि. डी. २+ कभरेज | ४७ | ८५.२ | ५५.१ | ७३.९ | ७१.७ | |
| पोषण |
ग्राफ
तालिका
|
|||||
| कम जन्म तौल भएका नवजात शिशुको प्रतिशत | १ | १.३ | २.३ | १२ | ९.४ | |
| नयाँ तौल लिएका १ वर्ष मुनिका शिशुहरुको प्रतिशत | १३५ | १२१.८ | १२९.१ | १०९ | १०४.१ | |
| नयाँ तौल लिएका २ वर्ष मुनिका शिशुहरु मध्ये अति जोखिम अवस्थाका बालबालिकाहरुको प्रतिशत | ४ | १.८ | ३.९ | ३.५ | ३.६ | |
| गर्भवती अवस्थामा १८० दिन आइरन चक्की प्राप्त गरेका गर्भवती महिलाहरुको प्रतिशत | ३३ | ७३.२ | ५४.५ | ७५.८ | ६० | |
| सुत्केरी अवस्थामा भिटामिन ए प्राप्त गरेका महिलाहरुको प्रतिशत | ५४ | ८४.३ | ५६.४ | ९८.२ | ७६.३ | |
| नवजात शिशु तथा बाल रोगको एकीकृत व्यस्थापन |
ग्राफ
तालिका
|
|||||
| नाभी मलम लगाएका नवजात शिशुको प्रतिशत | ८२ | ९३.७ | ९९.६ | ९४.२ | ८२.९ | |
| ब्याक्टेरियाको गम्भीर संक्रमण भएकामध्ये जेन्टामाईसिन सुईद्वारा पूर्ण उपचार पाएको प्रतिशत | १७ | ० | ३३.२ | ३९.५ | ४७.४ | |
| नयाँ निमोनिया बिरामीको दर (प्रति हजार पाँच वर्षमुनिका बालबालिकाहरुमा) | १८७ | ८७.६ | ११३५.१ | २९.३ | ३६.८ | |
| नयाँ एआरआई (स्वाशप्रश्वाका) बिरामी मध्ये कडा निमोनिया भएका बिरामीको प्रतिशत | ० | ०.०७ | ०.०६ | ०.०५ | ०.१८ | |
| नयाँ झाडापखालाका बिरामीको दर (प्रति हजार पाँच वर्ष मुनिका बालबालिकाहरुमा) | ४४४ | २०९८ | ६६९.६ | ३३९ | ३५२.४ | |
| ५ वर्ष मुनिका झाडापखालाका बिरामी मध्ये जिंक र पुनर्जलीय झोलबाट उपचार गरेको प्रतिशत | १०२ | ९८.२ | १०० | ९८.७ | ९४.५ | |
| जम्मा नवजात शिशु मृत्यु संख्या | १ | ४ | ० | ५७३ | १९१४ | |
| सुरक्षित मातृत्व तथा परिवार नियोजन |
ग्राफ
तालिका
|
|||||
| प्परोटोकल अनुसार पहिलो पटक गर्भवती जाँच गराएका गर्भवती महिलाहरुको प्रतिशत | ९७ | ९४.२ | ७२.४ | ९३.५ | ९१.४ | |
| प्रजनन् उमेरका महिलाहरुमा परिवार नियोजनको प्रयोगकर्ता दर (आधुनिक साधन) | ० | ० | ० | ० | ० | |
| ४ पटक गर्भवती जाँच (महिना: ४,६,८,९/हप्ता: १६, २०-२४,३२ र ३६) महिलाहरुको प्रतिशत | ३५ | ७६.६ | ५४.५ | ७९.७ | ७९.४ | |
| स्वास्थ्य संस्था प्रसुति दर | २८ | ६०.९ | ४२.९ | ९४.२ | ७९ | |
| दक्ष प्रसुतिकर्मी/स्वास्थ्यकर्मीद्वारा प्रसुति गराएको प्रतिशत | २६ | ६०.९ | ३६. | ८९.८ | ७५ | |
| प्रोटोकल अनुसार ४ पटक (आ.व २०७८/७९ सम्म ३ पटक) सुत्केरी जाँच गराउने आमाहरुको प्रतिशत | ३ | २५.५ | ३६.३ | ५३.७ | ४०.८ | |
| जम्मा मातृ मृत्यु संख्या | ० | ० | ० | ७४ | २३१ | |
| परिवार नियोजन सेवाका नयाँ सेवाग्राही दर (प्रजनन उमेरका महिलाहरु मध्ये) | १६ | १८.६ | २२ | १२.४ | ११.५ | |
| औलो रोग, क्षय रोग, कुष्ठरोग र एचआईभी |
ग्राफ
तालिका
|
|||||
| औलोको स्लाइड नमुना पोजेटिभ दर | १४ | ० | ० | ०.२७ | ०.१७ | |
| डेंगुको जम्मा विरामी संख्या | ० | ० | ० | ० | ० | |
| आयातित औलोरोगको प्रतिशत (नयाँ औलो रोग मध्ये | १०० | ० | ० | ९५.५ | ८९.५ | |
| जम्मा औलो रोग मध्ये प्लाज्मोडियम फाल्सिपारमको अनुपात | ० | ० | ० | ३८.७ | २२.८ | |
| नयाँ क्षयरोगी बिरामी पत्ता लागेको दर | १६२ | १३५ | ३००.५ | १५७.४ | १२९.१ | |
| क्षयरोगको उपचार सफलता दर | ९० | ९१.८ | ८१.६ | ९१ | ९१.५ | |
| कुष्ठरोगको रोग प्रकोप दर (प्रति १०००० मा) | ० | ० | ० | ०.९ | ० | |
| ए. आर. टी. उपचारमा रहेका जम्मा एच. आइ. भी. पोजेटिभको संख्या | ० | ० | ० | ४३२६ | २२१५२ | |
| उपचारात्मक सेवा |
ग्राफ
तालिका
|
|||||
| ओ पि डी मा आएका बिरामी मध्ये नयाँ बिरामीको दर | ७५ | ९६.४ | ११०.७ | ९४.५ | ९२ | |
शीर्ष १० स्वास्थ्य अवस्थाको सूची
स्वास्थ्य सूचना व्यवस्थापन प्रणाली २०७९स्वास्थ्य क्षेत्रमा बजेट
- सशर्त स्वास्थ्यमा छुट्याएको बजेट
- समानीकरणबाट विनियोजित स्वास्थ्य बजेट
- अन्य श्रोतबाट बिनियोजित स्वास्थ्य बजेट
| बजेट | बंगलाचुली गाउँपालिका | |||||
|---|---|---|---|---|---|---|
| २०७८/७९ | ||||||
| ग्राफ | ||||||
| पालिकाको कुल बजेट (रु ) | २२८,९४४,००० | |||||
| स्वास्थ्य बजेट (सबै स्रोत) | १,७६०,००० | |||||
| सशर्त स्वास्थ्यमा छुट्याएको बजेट | ||||||
| समानीकरणबाट विनियोजित स्वास्थ्य बजेट | १,७६०,००० | |||||
| अन्य श्रोतबाट बिनियोजित स्वास्थ्य बजेट | - | |||||
| बजेट खर्च (%) | १,७६०,००० | |||||
| तालिका | ||||||
महत्वपूर्ण सम्पर्क
Bangalachuli Rural Municipality
ठेगाना : बंगलाचुली गाउँपालिका, प्रदेश नं ५, कमिरेचौर, दाङ
टेलिफोन : -
वेबसाइट : bangalachulimun.gov.np
उप-प्रमुख, स्वास्थ्य शाखा
नाम : ईन्द्र कुमारि घर्ति मगर
सम्पर्क : ९८५७८५८३३०
ईमेल : miindragm39@gmail.com

यो प्रोफाइल अमेरिकी अन्तर्राष्ट्रिय विकास नियोग (युएसएआइडी) मार्फत अमेरिकी जनताहरुको सहयोगका कारण सम्भव बनेको हो । यो प्रतिवेदन भित्रका विषयवस्तु र सामग्री स्वास्थ्यका लागि सक्षम प्रणालीका एकल जिम्मेवारी हुन् र तिनले युएसएआइडी वा अमेरिकी सरकारको विचारको प्रतिविम्बित गर्छन् भन्ने जरुरी छैन ।