संक्षिप्त परिचय बराहताल गाउँपालिका
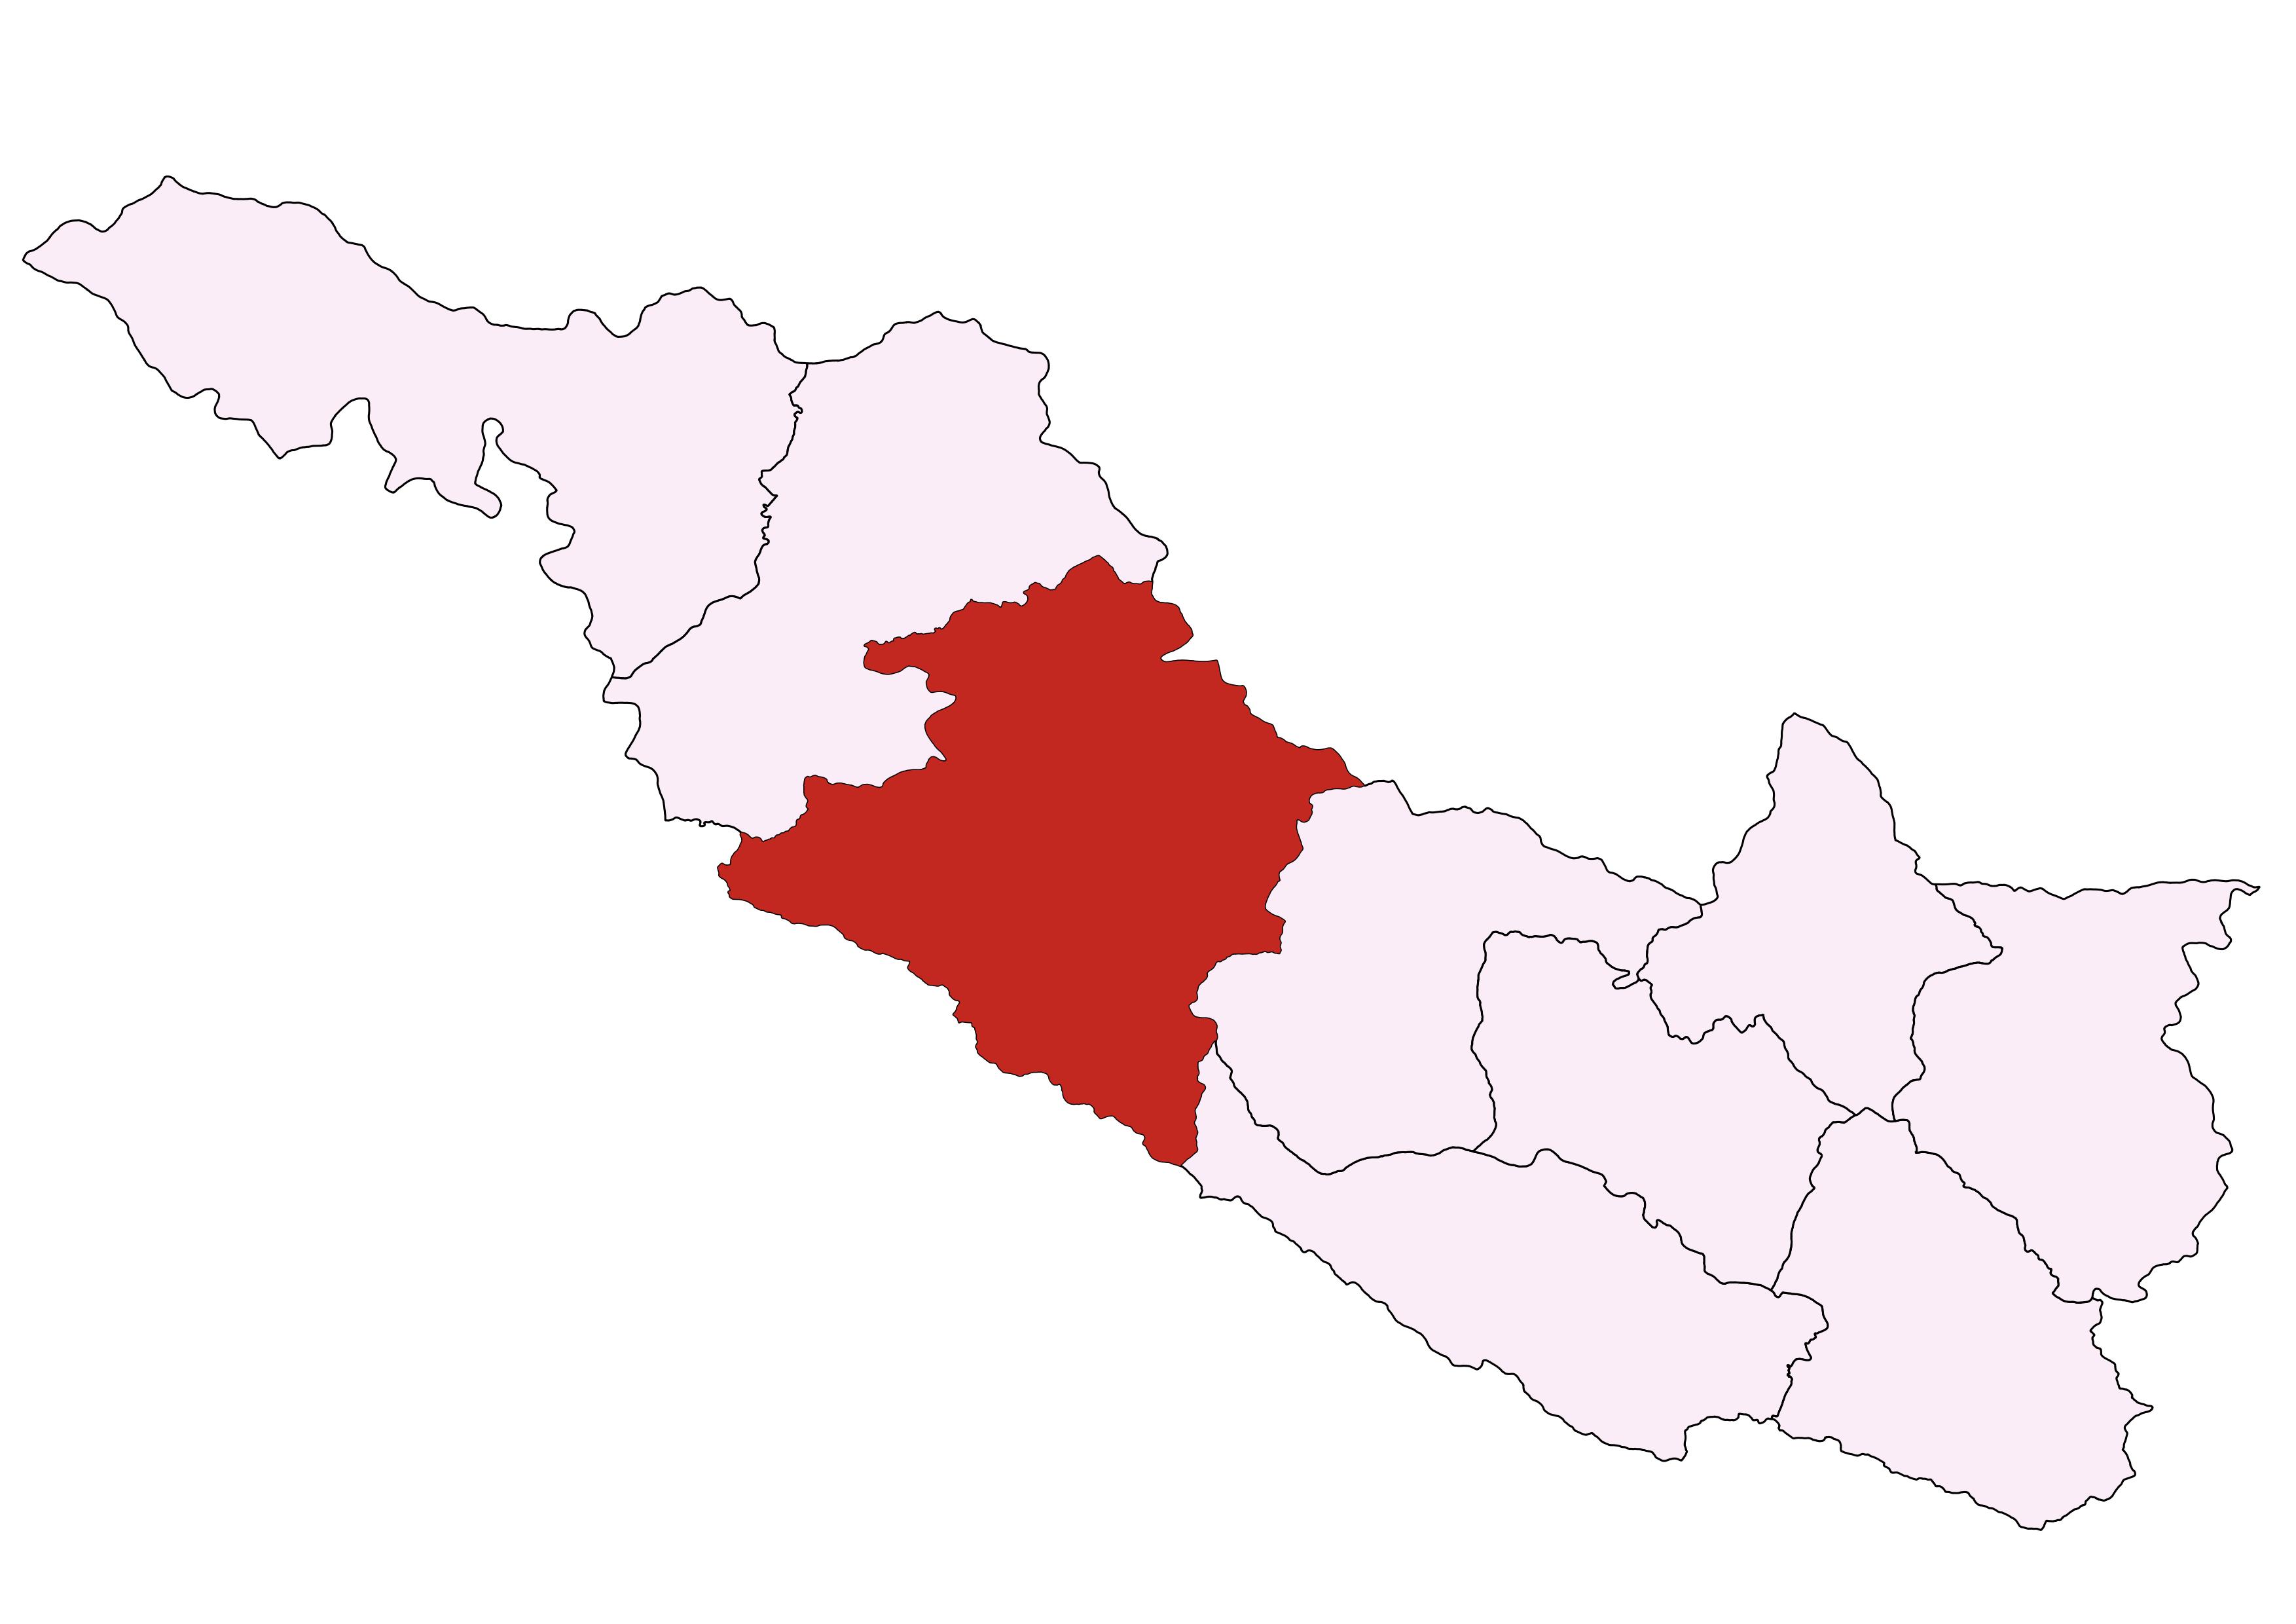
बराहताल गाउँपलिका सुर्खेत जिल्लाको पश्चिम क्षेत्रको रमणीय स्थानमा अबस्थित गाउँपालिका हो | बिरेन्द्रनगर नगरपालिकादेखि पश्चिम क्षेत्रमा अवस्थित ३० किलोमिटर दुरीको यात्रामा यो गाउँपलिका पुग्न सकिन्छ ।जिल्लाका ९ वटा स्थानीय निकायहरुमा क्षेत्रफलका हिसाबले बरहताल सबैभन्दा ठुलाे ४५५.०९ वर्ग कि. मि रहेको छ । हाल प्रस्ताब वडा संख्या १० भएको यो गाउँपलिका साविकका हरिहरपुर , तरङगा , कुनाथरी , पोखरीकाडा र लेकगाँउ गरी ५ वटा गा. वि.स. समावेश गरी बराहताल गाउँपालिका बनेको छ । मुख्य गरि बनजंगल,बनपैदाबार र कृषि उत्पादनलाई मुख्य आम्दानीको श्रोत मानिने यस गाउँपालिका को मुख्य केन्द्र कुनाथारी हो |
जनसाङ्खिक सूचक
-
कूल जनसंख्या १
२५,३७१
/ -
१ बर्ष भन्दा मुनिको जनसंख्या १
४६५
/ -
पाँच बर्ष भन्दा मुनिको जनसंख्या १
२,२६५
/ -
किशोरावस्था (१०-१९ बर्ष) को जनसंख्या १
५,५३८
/ -
प्रजनन उमेरका महिला (१५ -४९ बर्ष ) १
७,२५६
/ -
अनुमानित गर्भवती महिलाहरु १
७३०
/ -
अनुमानित जिवित जन्मको संख्या १
४६९
/ -
परिवारमा अनुपस्थित (विदेशमा बस्ने) जनसंख्या २
१,९२७
-
मोबाइल फोन भएका घरधुरी (%) २
५,२९३
-
टेलिभिजन भएका घरधुरी (%) २
५१६
-
लैङ्गिक अनुपात २
९२
-
१४ बर्ष र सो भन्दा कम उमेरका जनसंख्या १
७,२८६
/ -
६५ बर्ष र सो भन्दा माथि उमेरका जनसंख्या २
१,५३९
उमेर र लिंगको आधारमा जनसंख्या वितरण
जनगणना २०७८जातिगत आधारमा जनसंख्या वितरण
जनगणना २०७८वार्ड अनुसार जनसंख्या वितरण
जनगणना २०७८स्वास्थ्य सेवा प्रवाह गर्ने संस्थाहरु

- अस्पताल -
- प्रास्वाके -
- स्वास्थ्य चौकी ५
- सामुदायिक स्वास्थ्य ईकाई ४
- शहरी स्वास्थ्य केन्द्र -
- गाउँघर क्लिनिक ११
- खोप क्लिनिक २४
- आधारभूत स्वस्थ सेवाकेन्द्र ५
- बर्थिंग सेन्टर ६
सरकारी संस्था
- अस्पताल तथा नर्सिंग होम -
- पोलिक्लिनिक -
- औषधि पसल ४
निजी (गैर-सरकारी संस्था समेत)
अन्य स्वास्थ्य केन्द्रहरु
- माइक्रोस्कोपी केन्द्र ५
- एआरटि केन्द्र -
- एचाईभी परीक्षण केन्द्र -
- क्षयरोग उपचार केन्द्र ५
- आयुर्वेद अस्पताल/केन्द्र १
- आँखा अस्पताल/केन्द्र -
अस्पताल शैयाहरू
- सार्वजनिक -
- निजी -
वडा अनुसार स्वास्थ्य संस्थाको जानकारी
| स्वास्थ्यसंस्थाको नाम | वार्ड न | बर्थिंग सेन्टर BEONC/CEONC | महिला स्वास्थ्य स्वयं सेवक संख्या | दक्ष प्रसुतिकर्मी संख्या | परिवार नियोजन *सेवा | स्वीकृत दरबन्दी | दरबन्दी अनुसार पदपूर्ति | करारका कर्मचारी |
|---|---|---|---|---|---|---|---|---|
| हरिहरपुर स्वास्थ्य चौकी | २ | बर्थिंग सेन्टर | ८ | २ | ३ साधनहरू | ६ | ६ | ३ |
| तरँगा स्वास्थ्य चौकी | ४ | बर्थिंग सेन्टर | ८ | १ | ५ साधनहरू | ६ | ६ | ३ |
| कुनाथरी स्वास्थ्य चौकी | ५ | बर्थिंग सेन्टर | ११ | २ | ५ साधनहरू | ६ | ६ | ३ |
| पोखरिकाँडा स्वास्थ्य चौकी | ७ | बर्थिंग सेन्टर | ८ | २ | ४ साधनहरू | ६ | ६ | ४ |
| लेखगाऊ स्वास्थ्य चौकी | ९ | बर्थिंग सेन्टर | ९ | २ | ५ साधनहरू | ६ | ६ | ४ |
| तेलपानी आधारभूत स्वास्थ्य सेवा केन्द | १ | - | ७ | ० | ३ साधनहरू | ० | ० | २ |
| पग्मा सामुदायिक स्वास्थ्य इकाइ | २ | - | ० | ० | ३ साधनहरू | ० | ० | ३ |
| गाइनेकाडा सामुदायिक आधारभूत स्वास्थ्य सेवा केन्द | ३ | - | १० | ० | ३ साधनहरू | ० | ० | ३ |
| चेपाङ सामुदायिक स्वास्थ्य इकाइ | ५ | बर्थिंग सेन्टर | ० | १ | ३ साधनहरू | ० | ० | ४ |
| ब्युरेनी आधारभूत स्वास्थ्य सेवा केन्द | ६ | - | ७ | ० | ३ साधनहरू | ० | ० | ३ |
| नयाबन सामुदायिक स्वास्थ्य इकाइ | ७ | - | ० | ० | ३ साधनहरू | ० | ० | ३ |
| रानिबन् आधारभूत स्वास्थ्य सेवा केन्द | ८ | - | १० | ० | ३ साधनहरू | ० | ० | २ |
| थारी सामुदायिक स्वास्थ्य इकाइ | ९ | - | ० | ० | ३ साधनहरू | ० | ० | ३ |
| सलैना आधारभूत स्वास्थ्य सेवा केन्द | १० | - | ९ | ० | ३ साधनहरू | ० | ० | २ |
| कुल कर्मचारी संख्या | ८७ | १० | ३० | ३० | ४२ | |||
स्वास्थ्य सेवाको लागि मानव संसाधन
- CEONC साइटहरू-
- BEONC साइटहरू-
- आइयुसीडी तथा इम्पलान्ट सेवा प्रदायक४
- एकीकृत बालरोग व्यवस्थापन (IMCI) प्रशिक्षित कर्मचारी२५
- जनसंख्या (प्रति मस्वास्वका) २९२
- जनसंख्या (प्रति स्वास्थ्यकर्मी) ८४६
- अनुमानित गर्भवति (प्रति दक्ष प्रसुतिकर्मी) ७३
- अनुमानित गर्भवति (प्रति बर्थिङ्ग सेन्टर) १२२
- जनसंख्या (प्रति स्वास्थ्य संस्था) (अस्पताल,प्रस्वाके र स्वाचौ सहित) -
- जनसंख्या (प्रति सरकारी अस्पताल) -
- जनसंख्या (प्रति अस्पताल र नर्सिंग होम (सबै) -
मातृशिशु बालस्वास्थ्य र परिवार नियोजन सेवा उपयोगको अवस्था
स्वास्थ्य सूचना व्यवस्थापन प्रणाली २०७९०८०प्रमूख स्वास्थ्य सेवाहरूको उपयोगको तुलनात्मक अवस्था
| सूचक | बराहताल गाउँपालिका | कर्णाली प्रदेश २०७८/७९ | राष्ट्रीय २०७८/७९ | |||
|---|---|---|---|---|---|---|
| २०७९/८० | २०७७/७८ | २०७८/७९ | ||||
| खाेप |
ग्राफ
तालिका
|
|||||
| बि.सि.जि. कभरेज | ५३ | ६१ | ६३.६ | ९२ | १०३.५ | |
| २३ महिनाभित्र पूर्ण खोप प्राप्त गरेका बालबालिका (%) | ८२ | ७८.५ | ९४ | ० | ० | |
| डि.पि.टि. - हेप बि - हिव ३ कभरेज | ८२ | १०६.४ | १०६.४ | ९४ | ९५.२ | |
| दादुरा रूबेला १ (९-११ महिना) कभरेज | ७८ | ११०.३ | ११० | ९५ | ९४.७ | |
| जे.इ कभरेज | ९४ | ७१ | १०४ | ९६ | ९५.९ | |
| टि.डी. २ र टि. डी. २+ कभरेज | ५६ | ६१ | ६५ | ६६ | ७१.७ | |
| पोषण |
ग्राफ
तालिका
|
|||||
| कम जन्म तौल भएका नवजात शिशुको प्रतिशत | ६ | २ | २.४ | ६.८ | ९.४ | |
| नयाँ तौल लिएका १ वर्ष मुनिका शिशुहरुको प्रतिशत | ९७ | ८० | १२० | १२० | १०४.१ | |
| नयाँ तौल लिएका २ वर्ष मुनिका शिशुहरु मध्ये अति जोखिम अवस्थाका बालबालिकाहरुको प्रतिशत | २.८ | २ | २.९ | ४.१ | ३.६ | |
| गर्भवती अवस्थामा १८० दिन आइरन चक्की प्राप्त गरेका गर्भवती महिलाहरुको प्रतिशत | ६० | ५४ | ६७ | ७३ | ६० | |
| सुत्केरी अवस्थामा भिटामिन ए प्राप्त गरेका महिलाहरुको प्रतिशत | ३८ | ४५ | ४७ | ८८ | ७६.३ | |
| नवजात शिशु तथा बाल रोगको एकीकृत व्यस्थापन |
ग्राफ
तालिका
|
|||||
| नाभी मलम लगाएका नवजात शिशुको प्रतिशत | ९७ | ९६ | ९९.६ | ९६ | ८२.९ | |
| ब्याक्टेरियाको गम्भीर संक्रमण भएकामध्ये जेन्टामाईसिन सुईद्वारा पूर्ण उपचार पाएको प्रतिशत | १०० | ६७ | ९९.७ | ७५ | ४७.४ | |
| नयाँ निमोनिया बिरामीको दर (प्रति हजार पाँच वर्षमुनिका बालबालिकाहरुमा) | ५६ | २८ | ६८.६ | ११३ | ३६.८ | |
| नयाँ एआरआई (स्वाशप्रश्वाका) बिरामी मध्ये कडा निमोनिया भएका बिरामीको प्रतिशत | ० | ०.०५ | ०.०९ | ०.४१ | ०.१८ | |
| नयाँ झाडापखालाका बिरामीको दर (प्रति हजार पाँच वर्ष मुनिका बालबालिकाहरुमा) | १८८ | ५१३ | ५७३ | ५७९ | ३५२.४ | |
| ५ वर्ष मुनिका झाडापखालाका बिरामी मध्ये जिंक र पुनर्जलीय झोलबाट उपचार गरेको प्रतिशत | ९८.८ | ९९ | ९७.४ | ९५ | ९४.५ | |
| जम्मा नवजात शिशु मृत्यु संख्या | ० | १ | ० | १९९ | १९१४ | |
| सुरक्षित मातृत्व तथा परिवार नियोजन |
ग्राफ
तालिका
|
|||||
| प्परोटोकल अनुसार पहिलो पटक गर्भवती जाँच गराएका गर्भवती महिलाहरुको प्रतिशत | ८९ | ६७ | ८१ | १२२ | ९१.४ | |
| प्रजनन् उमेरका महिलाहरुमा परिवार नियोजनको प्रयोगकर्ता दर (आधुनिक साधन) | १३ | १७.४ | १५.६ | ० | ० | |
| ४ पटक गर्भवती जाँच (महिना: ४,६,८,९/हप्ता: १६, २०-२४,३२ र ३६) महिलाहरुको प्रतिशत | ६२ | ५६ | ६०.४ | ७३ | ७९.४ | |
| स्वास्थ्य संस्था प्रसुति दर | ३३ | ३६ | ४२.९ | ८३ | ७९ | |
| दक्ष प्रसुतिकर्मी/स्वास्थ्यकर्मीद्वारा प्रसुति गराएको प्रतिशत | ३३ | २४ | ३९.८ | ७० | ७५ | |
| प्रोटोकल अनुसार ४ पटक (आ.व २०७८/७९ सम्म ३ पटक) सुत्केरी जाँच गराउने आमाहरुको प्रतिशत | २२ | ९ | २०.७ | ५३ | ४०.८ | |
| जम्मा मातृ मृत्यु संख्या | ० | ० | ० | १७ | २३१ | |
| परिवार नियोजन सेवाका नयाँ सेवाग्राही दर (प्रजनन उमेरका महिलाहरु मध्ये) | १३ | १९ | १५.६ | १९ | ११.५ | |
| औलो रोग, क्षय रोग, कुष्ठरोग र एचआईभी |
ग्राफ
तालिका
|
|||||
| औलोको स्लाइड नमुना पोजेटिभ दर | ०.१३ | ० | ० | ०.२५ | ०.१७ | |
| डेंगुको जम्मा विरामी संख्या | ० | ० | ० | ० | ० | |
| आयातित औलोरोगको प्रतिशत (नयाँ औलो रोग मध्ये | १०० | ० | ० | ६३ | ८९.५ | |
| जम्मा औलो रोग मध्ये प्लाज्मोडियम फाल्सिपारमको अनुपात | ० | ० | ० | २.१ | २२.८ | |
| नयाँ क्षयरोगी बिरामी पत्ता लागेको दर | ११९.२ | ७१ | १६३.९ | ९७ | १२९.१ | |
| क्षयरोगको उपचार सफलता दर | ९२.९ | ९६ | ९६ | ९१ | ९१.५ | |
| कुष्ठरोगको रोग प्रकोप दर (प्रति १०००० मा) | ०.७७ | ० | ०.७८ | ०.५ | ० | |
| ए. आर. टी. उपचारमा रहेका जम्मा एच. आइ. भी. पोजेटिभको संख्या | ० | ० | ० | ६९१ | २२१५२ | |
| उपचारात्मक सेवा |
ग्राफ
तालिका
|
|||||
| ओ पि डी मा आएका बिरामी मध्ये नयाँ बिरामीको दर | ६३ | ७५ | ८८.९ | १०५ | ९२ | |
शीर्ष १० स्वास्थ्य अवस्थाको सूची
स्वास्थ्य सूचना व्यवस्थापन प्रणाली २०७९-८०स्वास्थ्य क्षेत्रमा बजेट
- सशर्त स्वास्थ्यमा छुट्याएको बजेट
- समानीकरणबाट विनियोजित स्वास्थ्य बजेट
- अन्य श्रोतबाट बिनियोजित स्वास्थ्य बजेट
| बजेट | बराहताल गाउँपालिका | |||||
|---|---|---|---|---|---|---|
| २०७८/७९ | २०७९/८० | २०८०/८१ | ||||
| ग्राफ | ||||||
| पालिकाको कुल बजेट (रु ) | ५२९,१६२,८०९ | ७२५,१३२,००० | ५९५,८८७,००० | |||
| स्वास्थ्य बजेट (सबै स्रोत) | ३१,२००,००० | १३,१००,००० | ३५,१९४,००० | |||
| सशर्त स्वास्थ्यमा छुट्याएको बजेट | २८,५००,००० | १०,१००,००० | ३३,६९४,००० | |||
| समानीकरणबाट विनियोजित स्वास्थ्य बजेट | २,२००,००० | ३,०००,००० | १,५००,००० | |||
| अन्य श्रोतबाट बिनियोजित स्वास्थ्य बजेट | ५००,००० | - | - | |||
| बजेट खर्च (%) | ९६ | ९४ | - | |||
| तालिका | ||||||
महत्वपूर्ण सम्पर्क
Barahatal Rural Municipality
ठेगाना : बराहताल गाउँपालिका
टेलिफोन : ९८५८०८७९००
वेबसाइट : http://barahatalmun.gov.np
स्वास्थ्य शाखा प्रमुख
नाम : महेन्द्र बहादुर खत्री
सम्पर्क : ९८४८०४७०१२
ईमेल : Khatrimahendra2022@gmail.com

यो प्रोफाइल अमेरिकी अन्तर्राष्ट्रिय विकास नियोग (युएसएआइडी) मार्फत अमेरिकी जनताहरुको सहयोगका कारण सम्भव बनेको हो । यो प्रतिवेदन भित्रका विषयवस्तु र सामग्री स्वास्थ्यका लागि सक्षम प्रणालीका एकल जिम्मेवारी हुन् र तिनले युएसएआइडी वा अमेरिकी सरकारको विचारको प्रतिविम्बित गर्छन् भन्ने जरुरी छैन ।