संक्षिप्त परिचय बारेकोट गाउँपालिका
बारेकोट गाउँपालिका जाजरकोट जिल्लाको उत्तर पूर्वमा अवस्थित सुन्दर गाउँपालिका हो । यो गाउँपालिका साबिकका ४ वटा नायकवाडा, सक्ला, रोकायगाउँ र रामीडाँडा गाविसहरु मिलेर बनेको छ । यस गाउँपालिकाको केन्द्र रोकायगाउँको लिम्सामा रहेको छ । यस गाउँपालिकाको क्षेत्रफल ५ सय ७७ वर्ग किलोमिटर रहेको छ । २०७८ सालको जनगणना अनुसार यहाँको जनसंख्या २२००३ रहेको छ ।
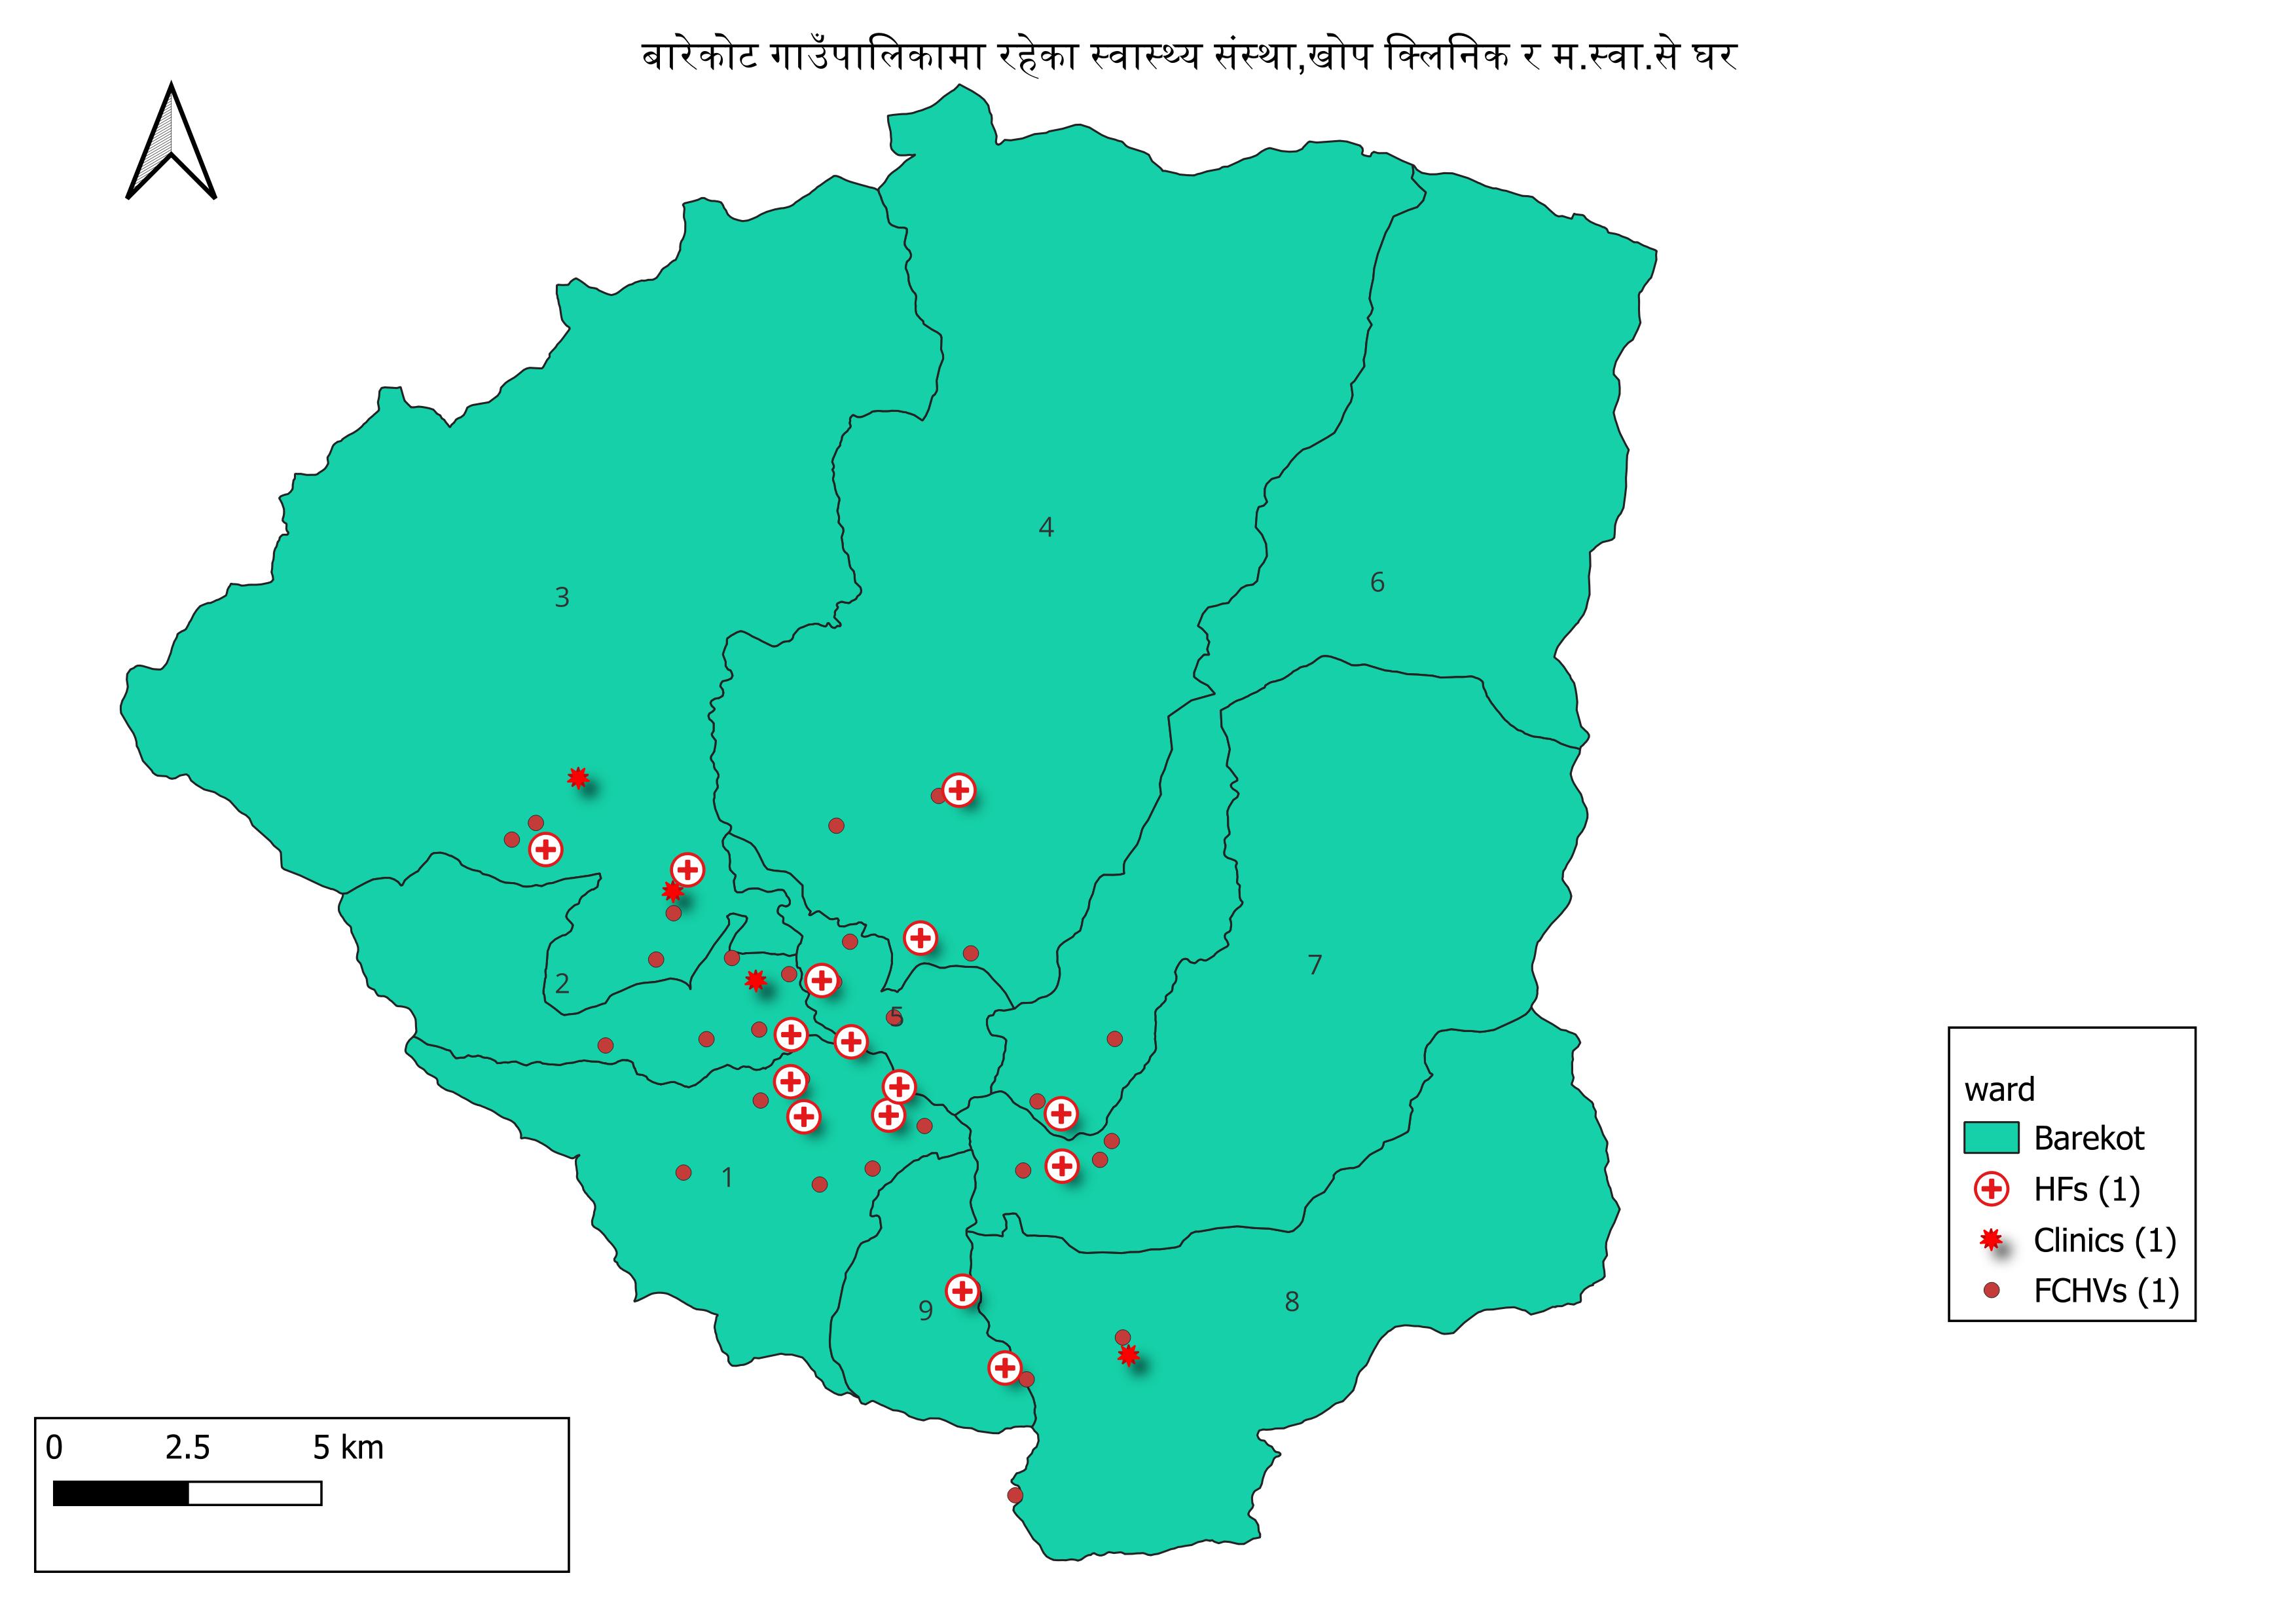
यहाँ १ आधारभुत अस्पताल ३ वटा स्वास्थ्य चाैकी र ५ वटा अाधारभुत स्वास्थ्य सेवा केन्द्र र 5 वटा सामुदायिक स्वास्थ्य इकाई मार्फत स्वास्थ्य सेवा प्रदान गरिदै आएको छ।
जनसाङ्खिक सूचक
-
कूल जनसंख्या १
२२,००३
-
१ बर्ष भन्दा मुनिको जनसंख्या १
५३४
-
पाँच बर्ष भन्दा मुनिको जनसंख्या १
२,४२५
-
किशोरावस्था (१०-१९ बर्ष) को जनसंख्या १
५,७१५
-
प्रजनन उमेरका महिला (१५ -४९ बर्ष ) १
५,५९१
-
अनुमानित गर्भवती महिलाहरु १
८४१
-
अनुमानित जिवित जन्मको संख्या १
५४५
-
मोबाइल फोन भएका घरधुरी (%) २
४०
-
टेलिभिजन भएका घरधुरी (%) २
३
२०७८ -
लैङ्गिक अनुपात २
१०२
२०७८ -
१४ बर्ष र सो भन्दा कम उमेरका जनसंख्या १
७,९३७
-
६५ बर्ष र सो भन्दा माथि उमेरका जनसंख्या १
६०४
उमेर र लिंगको आधारमा जनसंख्या वितरण
जनगणना २०७८जातिगत आधारमा जनसंख्या वितरण
जनगणना २०७८वार्ड अनुसार जनसंख्या वितरण
जनगणना २०७८स्वास्थ्य सेवा प्रवाह गर्ने संस्थाहरु
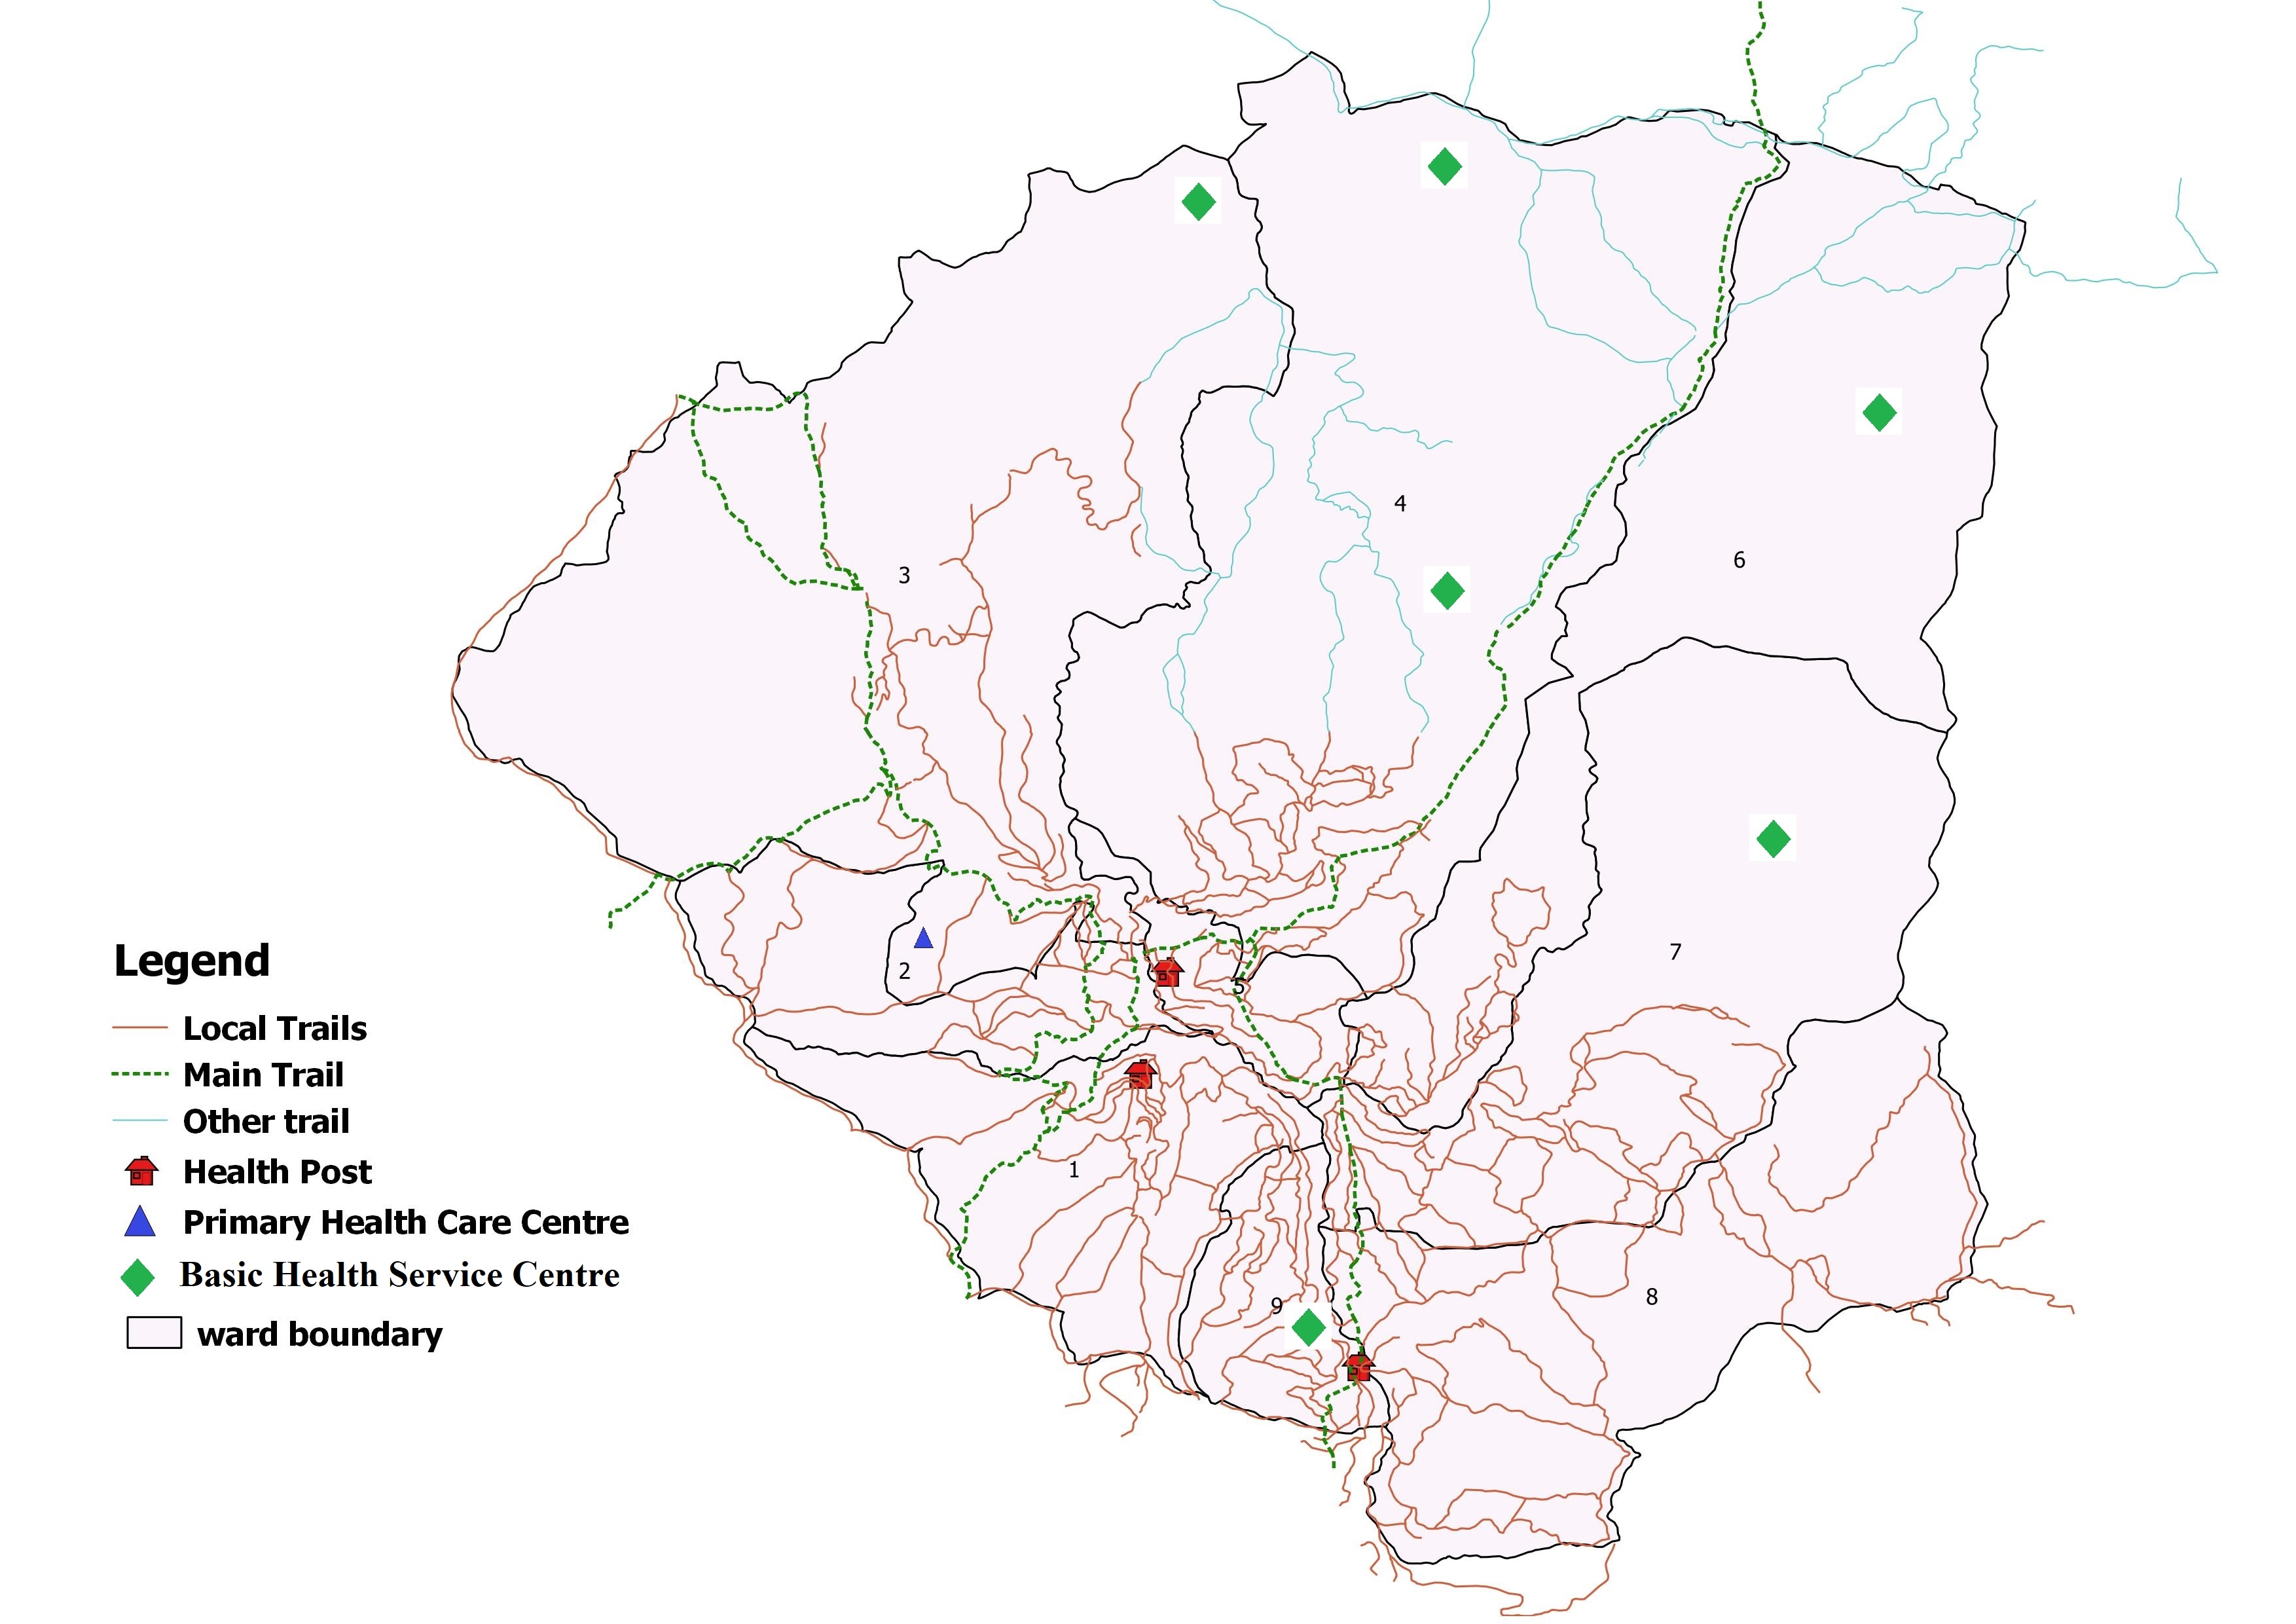
- अस्पताल १
- प्रास्वाके -
- स्वास्थ्य चौकी ३
- सामुदायिक स्वास्थ्य ईकाई ४
- शहरी स्वास्थ्य केन्द्र -
- गाउँघर क्लिनिक ५
- खोप क्लिनिक १६
- आधारभूत स्वस्थ सेवाकेन्द्र ५
- बर्थिंग सेन्टर ४
सरकारी संस्था
- अस्पताल तथा नर्सिंग होम -
- पोलिक्लिनिक -
- औषधि पसल ४
निजी (गैर-सरकारी संस्था समेत)
अन्य स्वास्थ्य केन्द्रहरु
- माइक्रोस्कोपी केन्द्र १
- एआरटि केन्द्र -
- एचाईभी परीक्षण केन्द्र -
- क्षयरोग उपचार केन्द्र ४
- आयुर्वेद अस्पताल/केन्द्र -
- आँखा अस्पताल/केन्द्र -
अस्पताल शैयाहरू
- सार्वजनिक ३
- निजी -
वडा अनुसार स्वास्थ्य संस्थाको जानकारी
| स्वास्थ्यसंस्थाको नाम | वार्ड न | बर्थिंग सेन्टर BEONC/CEONC | महिला स्वास्थ्य स्वयं सेवक संख्या | दक्ष प्रसुतिकर्मी संख्या | परिवार नियोजन *सेवा | स्वीकृत दरबन्दी | दरबन्दी अनुसार पदपूर्ति | करारका कर्मचारी |
|---|---|---|---|---|---|---|---|---|
| लिम्सा प्रा. स्वा. केन्द्र | २ | बबर्थिंग सेन्टर | ५ | ४ | ५ साधनहरू | १० | ७ | १६ |
| स्वास्थ्य चाैकी सेपुखाेला | ८ | बर्थिंग सेन्टर | ३ | ३ | ४ साधनहरू | ५ | ४ | ५ |
| नायक बडा स्वास्थ्य चौकी | ५ | बर्थिंग सेन्टर | ४ | ३ | ४ साधनहरू | ५ | ६ | ५ |
| रामी डाँडा स्वास्थ्य चौकी | १ | बर्थिंग सेन्टर | ९ | २ | ४ साधनहरू | ५ | ५ | ५ |
| मुल्साम आधारभुत स्वास्थ्य सेवा केन्द्र | ३ | 0 | ४ | १ | ३ साधनहरू | २ | - | २ |
| जिरी आधारभुत स्वास्थ्य सेवा केन्द्र | ४ | 0 | २ | १ | ३ साधनहरू | २ | - | २ |
| मैना सामुदायीक स्वास्थ्य | ४ | 0 | १ | - | ३ साधनहरू | २ | - | २ |
| घर्ति गाउँ आधारभुत स्वास्थ्य सेवा केन्द्र | ६ | 0 | २ | - | ३ साधनहरू | २ | - | २ |
| स्याला आधारभुत स्वास्थ्य सेवा केन्द्र | ७ | 0 | ३ | - | ३ साधनहरू | २ | - | २ |
| सक्ला आधारभुत स्वास्थ्य सेवा केन्द्र | ९ | 0 | ३ | - | ३ साधनहरू | २ | - | २ |
| कुल कर्मचारी संख्या | ३६ | १४ | ३७ | २२ | ४३ | |||
स्वास्थ्य सेवाको लागि मानव संसाधन
- CEONC साइटहरू-
- BEONC साइटहरू१
- आइयुसीडी तथा इम्पलान्ट सेवा प्रदायक१
- एकीकृत बालरोग व्यवस्थापन (IMCI) प्रशिक्षित कर्मचारी२०
- जनसंख्या (प्रति मस्वास्वका) ६११
- जनसंख्या (प्रति स्वास्थ्यकर्मी) १०००
- अनुमानित गर्भवति (प्रति दक्ष प्रसुतिकर्मी) ६०
- अनुमानित गर्भवति (प्रति बर्थिङ्ग सेन्टर) २१०
- जनसंख्या (प्रति स्वास्थ्य संस्था) (अस्पताल,प्रस्वाके र स्वाचौ सहित) -
- जनसंख्या (प्रति सरकारी अस्पताल) २२००३
- जनसंख्या (प्रति अस्पताल र नर्सिंग होम (सबै) २२००३
मातृशिशु बालस्वास्थ्य र परिवार नियोजन सेवा उपयोगको अवस्था
स्वास्थ्य सूचना व्यवस्थापन प्रणाली २०७९प्रमूख स्वास्थ्य सेवाहरूको उपयोगको तुलनात्मक अवस्था
| सूचक | बारेकोट गाउँपालिका | कर्णाली प्रदेश २०७८/७९ | राष्ट्रीय २०७८/७९ | |||
|---|---|---|---|---|---|---|
| २०७६/७७ | २०७७/७८ | २०७८/७९ | ||||
| खाेप |
ग्राफ
तालिका
|
|||||
| बि.सि.जि. कभरेज | ९०.६ | १३९.७ | ८८ | ९२ | १०३.५ | |
| २३ महिनाभित्र पूर्ण खोप प्राप्त गरेका बालबालिका (%) | ० | ० | ९२ | ० | ० | |
| डि.पि.टि. - हेप बि - हिव ३ कभरेज | १००.७ | १२२.४ | ९० | ९४ | ९५.२ | |
| दादुरा रूबेला १ (९-११ महिना) कभरेज | ९४.५ | १२६.२ | ९७ | ९५ | ९४.७ | |
| जे.इ कभरेज | १०२.६ | ११७.१ | ९४ | ९६ | ९५.९ | |
| टि.डी. २ र टि. डी. २+ कभरेज | ८०.४ | ११८.४ | ७२ | ६६ | ७१.७ | |
| पोषण |
ग्राफ
तालिका
|
|||||
| कम जन्म तौल भएका नवजात शिशुको प्रतिशत | २.८ | ५.४ | ५ | ६.८ | ९.४ | |
| नयाँ तौल लिएका १ वर्ष मुनिका शिशुहरुको प्रतिशत | १११.६ | १२८.६ | ८०.५ | १२० | १०४.१ | |
| नयाँ तौल लिएका २ वर्ष मुनिका शिशुहरु मध्ये अति जोखिम अवस्थाका बालबालिकाहरुको प्रतिशत | ६.६ | ३.३ | ३.३ | ४.१ | ३.६ | |
| गर्भवती अवस्थामा १८० दिन आइरन चक्की प्राप्त गरेका गर्भवती महिलाहरुको प्रतिशत | ७७.३ | ८६.७ | ७५ | ७३ | ६० | |
| सुत्केरी अवस्थामा भिटामिन ए प्राप्त गरेका महिलाहरुको प्रतिशत | १०७.५ | १३६.९ | ९९.८ | ८८ | ७६.३ | |
| नवजात शिशु तथा बाल रोगको एकीकृत व्यस्थापन |
ग्राफ
तालिका
|
|||||
| नाभी मलम लगाएका नवजात शिशुको प्रतिशत | १००.८ | ९८.८ | ९४ | ९६ | ८२.९ | |
| ब्याक्टेरियाको गम्भीर संक्रमण भएकामध्ये जेन्टामाईसिन सुईद्वारा पूर्ण उपचार पाएको प्रतिशत | १०० | १०० | ९२ | ७५ | ४७.४ | |
| नयाँ निमोनिया बिरामीको दर (प्रति हजार पाँच वर्षमुनिका बालबालिकाहरुमा) | १८६ | १५८.२ | १५० | ११३ | ३६.८ | |
| नयाँ एआरआई (स्वाशप्रश्वाका) बिरामी मध्ये कडा निमोनिया भएका बिरामीको प्रतिशत | ० | ०.०६ | १.१ | ०.४१ | ०.१८ | |
| नयाँ झाडापखालाका बिरामीको दर (प्रति हजार पाँच वर्ष मुनिका बालबालिकाहरुमा) | ६४९.६ | ७१४.६ | २६६ | ५७९ | ३५२.४ | |
| ५ वर्ष मुनिका झाडापखालाका बिरामी मध्ये जिंक र पुनर्जलीय झोलबाट उपचार गरेको प्रतिशत | १०० | ९९.९ | १०० | ९५ | ९४.५ | |
| जम्मा नवजात शिशु मृत्यु संख्या | २ | ९ | ० | १९९ | १९१४ | |
| सुरक्षित मातृत्व तथा परिवार नियोजन |
ग्राफ
तालिका
|
|||||
| प्परोटोकल अनुसार पहिलो पटक गर्भवती जाँच गराएका गर्भवती महिलाहरुको प्रतिशत | ८५.५ | ११५.७ | २१ | १२२ | ९१.४ | |
| प्रजनन् उमेरका महिलाहरुमा परिवार नियोजनको प्रयोगकर्ता दर (आधुनिक साधन) | ० | ० | ० | ० | ० | |
| ४ पटक गर्भवती जाँच (महिना: ४,६,८,९/हप्ता: १६, २०-२४,३२ र ३६) महिलाहरुको प्रतिशत | ८२.९ | ८६.७ | ७६ | ७३ | ७९.४ | |
| स्वास्थ्य संस्था प्रसुति दर | ९९.३ | १३०.६ | ८२.४ | ८३ | ७९ | |
| दक्ष प्रसुतिकर्मी/स्वास्थ्यकर्मीद्वारा प्रसुति गराएको प्रतिशत | ७४.८ | ९९.८ | ८१.८ | ७० | ७५ | |
| प्रोटोकल अनुसार ४ पटक (आ.व २०७८/७९ सम्म ३ पटक) सुत्केरी जाँच गराउने आमाहरुको प्रतिशत | ३३.६ | ६८.९ | ६६.६ | ५३ | ४०.८ | |
| जम्मा मातृ मृत्यु संख्या | ० | २ | १ | १७ | २३१ | |
| परिवार नियोजन सेवाका नयाँ सेवाग्राही दर (प्रजनन उमेरका महिलाहरु मध्ये) | २१.४ | २१.५ | १३.१ | १९ | ११.५ | |
| औलो रोग, क्षय रोग, कुष्ठरोग र एचआईभी |
ग्राफ
तालिका
|
|||||
| औलोको स्लाइड नमुना पोजेटिभ दर | ० | ० | ० | ०.२५ | ०.१७ | |
| डेंगुको जम्मा विरामी संख्या | ० | ० | ० | ० | ० | |
| आयातित औलोरोगको प्रतिशत (नयाँ औलो रोग मध्ये | ० | ० | ० | ६३ | ८९.५ | |
| जम्मा औलो रोग मध्ये प्लाज्मोडियम फाल्सिपारमको अनुपात | ० | ० | ० | २.१ | २२.८ | |
| नयाँ क्षयरोगी बिरामी पत्ता लागेको दर | ७७ | १०८.९ | ११३ | ९७ | १२९.१ | |
| क्षयरोगको उपचार सफलता दर | ८५.७ | १०० | ९५.५ | ९१ | ९१.५ | |
| कुष्ठरोगको रोग प्रकोप दर (प्रति १०००० मा) | ० | १.९ | ०.४५ | ०.५ | ० | |
| ए. आर. टी. उपचारमा रहेका जम्मा एच. आइ. भी. पोजेटिभको संख्या | ० | ० | ० | ६९१ | २२१५२ | |
| उपचारात्मक सेवा |
ग्राफ
तालिका
|
|||||
| ओ पि डी मा आएका बिरामी मध्ये नयाँ बिरामीको दर | ७१.८ | ९६.४ | ६१.८ | १०५ | ९२ | |
शीर्ष १० स्वास्थ्य अवस्थाको सूची
स्वास्थ्य सूचना व्यवस्थापन प्रणाली २०७९०८०स्वास्थ्य क्षेत्रमा बजेट
- सशर्त स्वास्थ्यमा छुट्याएको बजेट
- समानीकरणबाट विनियोजित स्वास्थ्य बजेट
- अन्य श्रोतबाट बिनियोजित स्वास्थ्य बजेट
| बजेट | बारेकोट गाउँपालिका | |||||
|---|---|---|---|---|---|---|
| २०७८/७९ | २०८०/८१ | २०७९/८० | ||||
| ग्राफ | ||||||
| पालिकाको कुल बजेट (रु ) | ४७,५८५,००० | ४५०,६३८,९०७ | ४६४,१९२,००० | |||
| स्वास्थ्य बजेट (सबै स्रोत) | ४७,५८५,००० | २२,०००,००० | ५३,७४१,००० | |||
| सशर्त स्वास्थ्यमा छुट्याएको बजेट | २६,४००,००० | २२,०००,००० | ३०,७००,००० | |||
| समानीकरणबाट विनियोजित स्वास्थ्य बजेट | २१,१८५,००० | २२,६८१,००० | ||||
| अन्य श्रोतबाट बिनियोजित स्वास्थ्य बजेट | - | ३६०,००० | ||||
| बजेट खर्च (%) | - | २२,०००,००० | ९४ | |||
| तालिका | ||||||
महत्वपूर्ण सम्पर्क
Barekot Rural Municipality
ठेगाना : बारेकोट गाउँपालिका गाउँ कार्यपालिकाको कार्यालय लिम्सा जाजरकोट ।
टेलिफोन : ०८९४३०३२२
वेबसाइट : http://barekotmun.gov.np/
स्वास्थ्य शाखा सह प्रमुख
नाम : कल्पना रोकाय
सम्पर्क : ९८६४७९२९३३

यो प्रोफाइल अमेरिकी अन्तर्राष्ट्रिय विकास नियोग (युएसएआइडी) मार्फत अमेरिकी जनताहरुको सहयोगका कारण सम्भव बनेको हो । यो प्रतिवेदन भित्रका विषयवस्तु र सामग्री स्वास्थ्यका लागि सक्षम प्रणालीका एकल जिम्मेवारी हुन् र तिनले युएसएआइडी वा अमेरिकी सरकारको विचारको प्रतिविम्बित गर्छन् भन्ने जरुरी छैन ।