संक्षिप्त परिचय भगवतीमाई गाउँपालिका
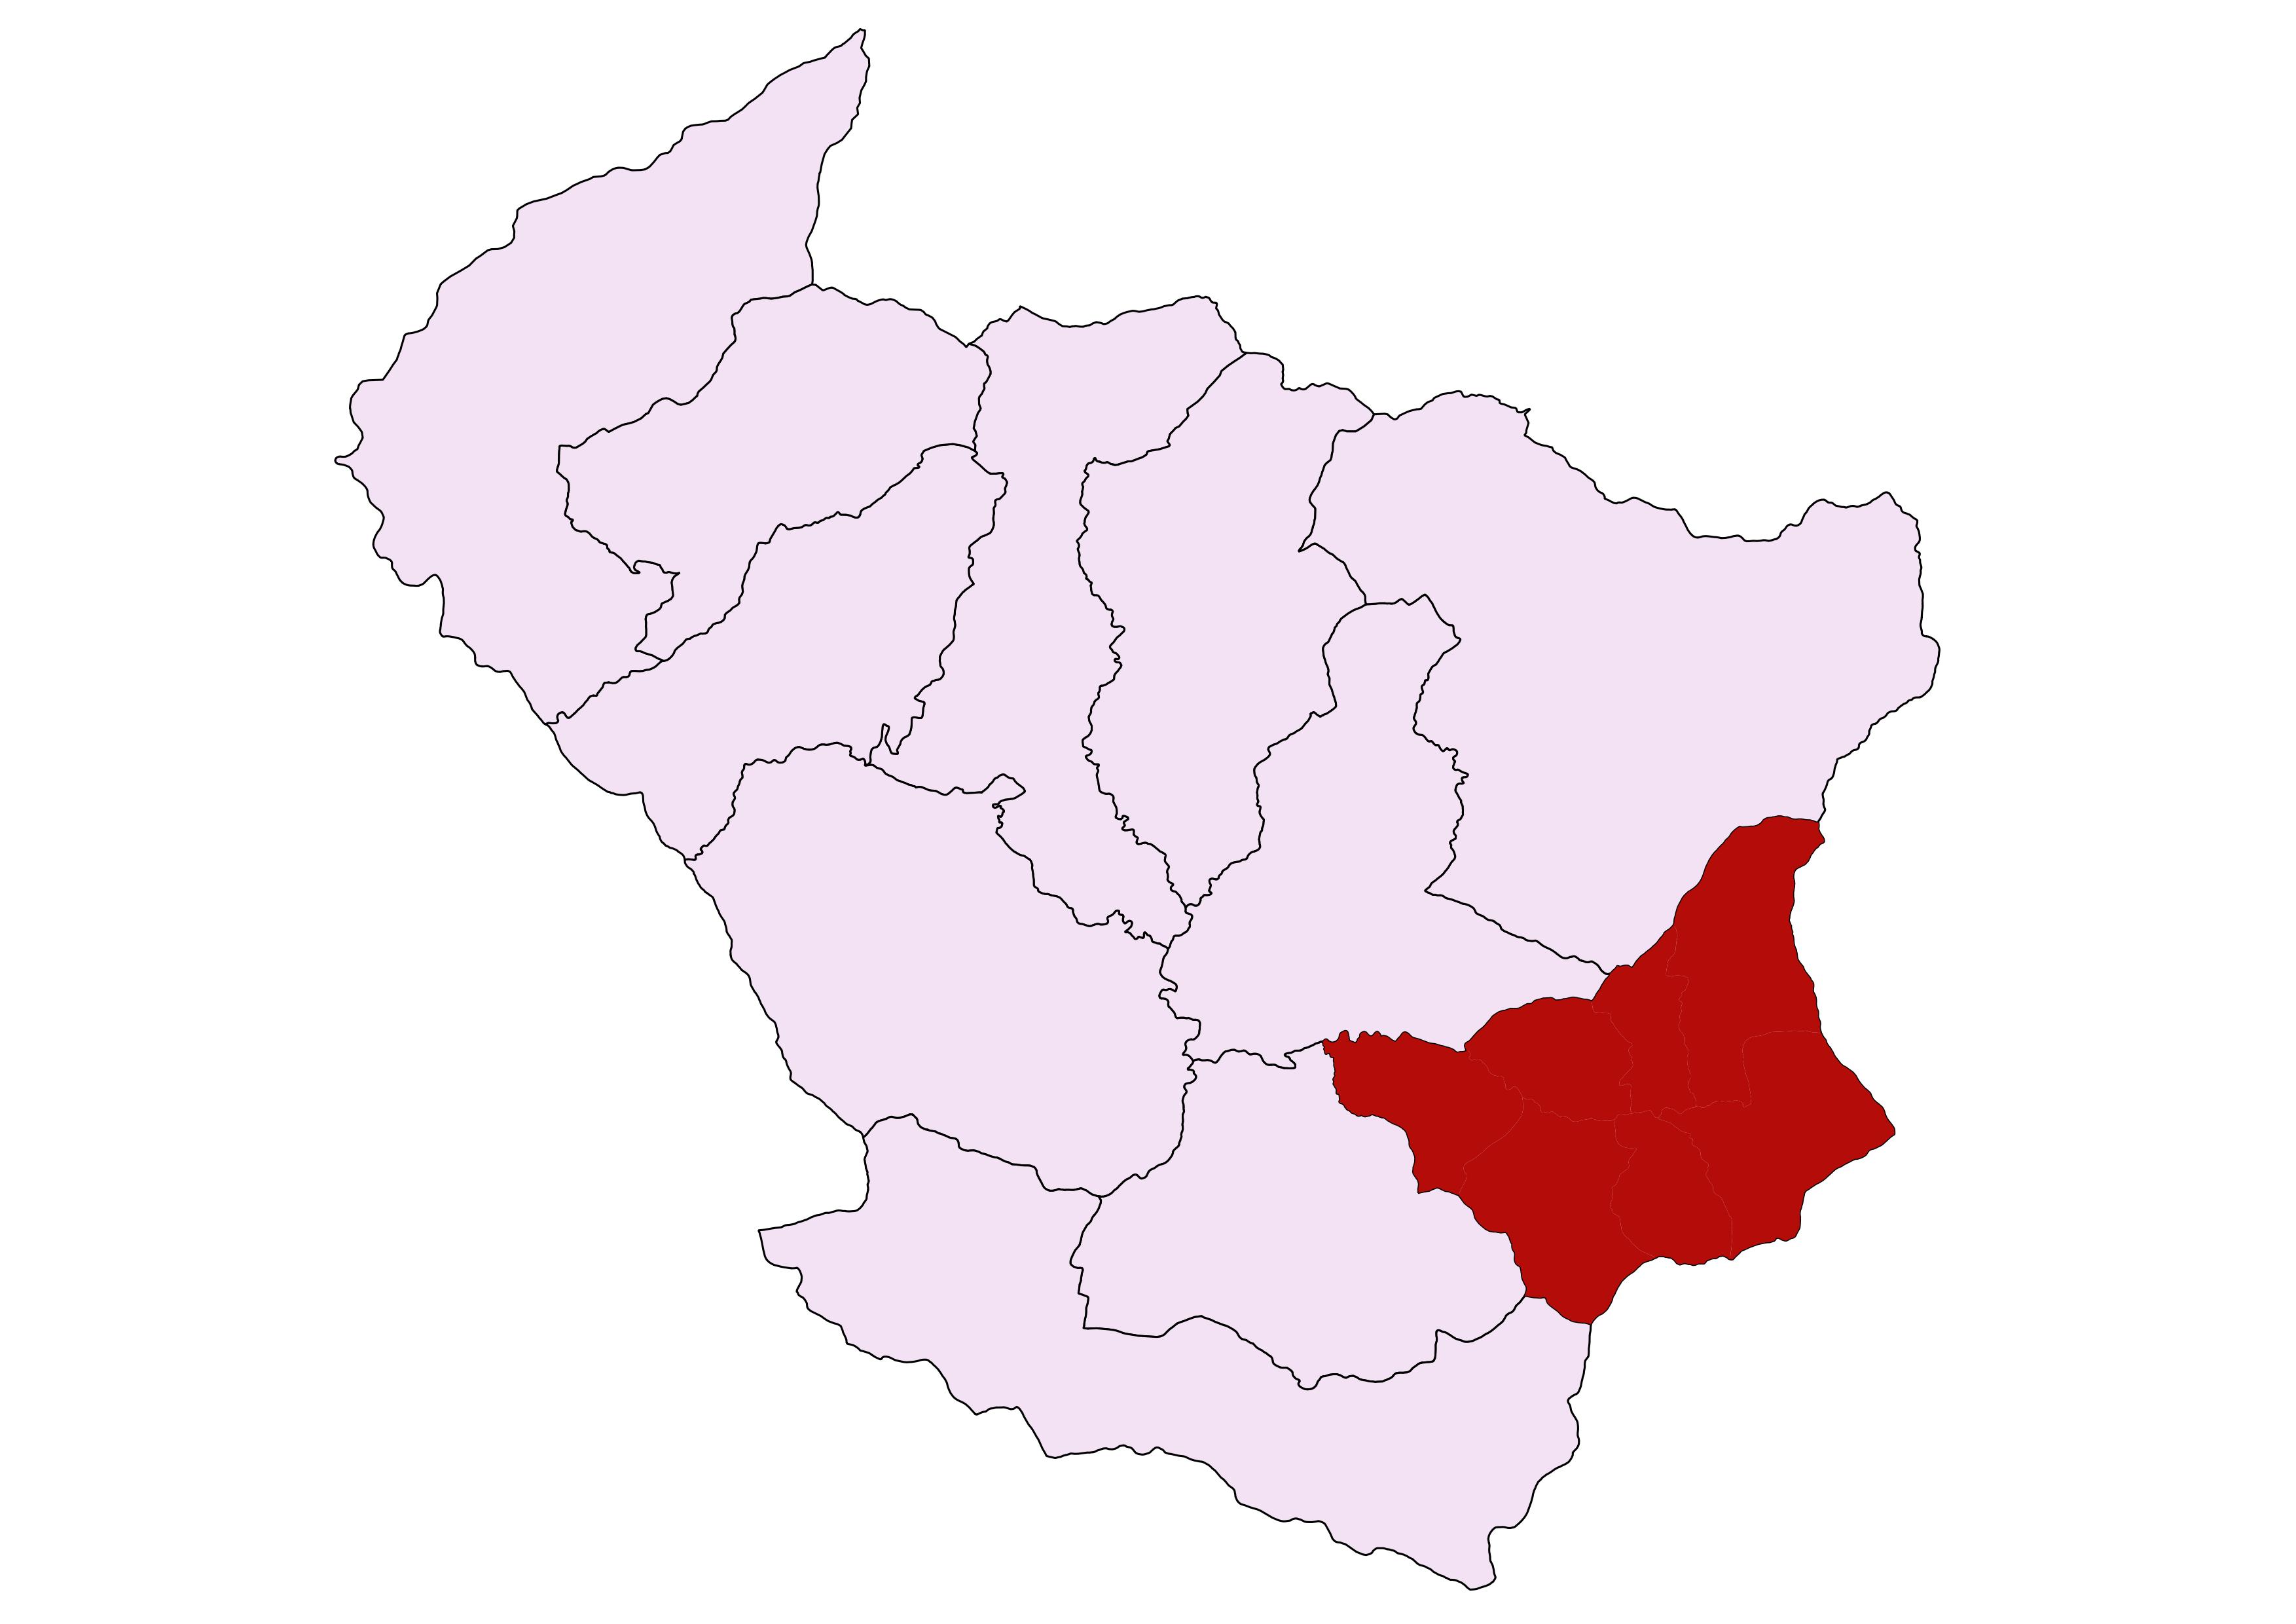
भगतिमाइ गाँउपालिका स्थानिय सरकार को रुपमा बि स २०७३ मा स्थापना भएको हो । भगवतिमाइ गाँउपालिका को मुख्यालय पगनाथ दैलेख मा अवस्थित छ । पुर्बमा डूङगेस्वर गाँउपालिका , पस्चिम नारयण नगरपालीका , ऊतर मा नाैमुले गाँउपलिका र दक्षिण मा गूराँस गाँउपालिका ले घेरियको छ । भगवतिमाइ गाँउपलिका को कुल क्षेत्रफल १२० बर्ग किलोमिटर रहेको छ ।
जनसाङ्खिक सूचक
-
कूल जनसंख्या २
१८,२०६
२०७८ -
१ बर्ष भन्दा मुनिको जनसंख्या ७
३८४
२०८०/०८१ -
पाँच बर्ष भन्दा मुनिको जनसंख्या ७
१,७८१
२०८०/०८१ -
किशोरावस्था (१०-१९ बर्ष) को जनसंख्या ७
४,०९५
२०८०/०८१ -
प्रजनन उमेरका महिला (१५ -४९ बर्ष ) ७
४,७१७
२०८०/०८१ -
अनुमानित गर्भवती महिलाहरु ७
६००
२०८०/०८१ -
अनुमानित जिवित जन्मको संख्या ७
३८७
२०८०/०८१ -
परिवारमा अनुपस्थित (विदेशमा बस्ने) जनसंख्या २
५९४
२०७८ -
मोबाइल फोन भएका घरधुरी (%) २
८९
२०७८ -
टेलिभिजन भएका घरधुरी (%) २
२
२०७८ -
लैङ्गिक अनुपात २
९८
२०७८ -
१४ बर्ष र सो भन्दा कम उमेरका जनसंख्या ७
५,४२१
०८०/०८१ -
६५ बर्ष र सो भन्दा माथि उमेरका जनसंख्या २
५६०
२०७८
उमेर र लिंगको आधारमा जनसंख्या वितरण
जनगणना २०७८जातिगत आधारमा जनसंख्या वितरण
जनगणना २०७८वार्ड अनुसार जनसंख्या वितरण
एचएमआईएस प्रक्षेपण २०७८स्वास्थ्य सेवा प्रवाह गर्ने संस्थाहरु

- अस्पताल १
- प्रास्वाके -
- स्वास्थ्य चौकी ५
- सामुदायिक स्वास्थ्य ईकाई २
- शहरी स्वास्थ्य केन्द्र -
- गाउँघर क्लिनिक १९
- खोप क्लिनिक २१
- आधारभूत स्वस्थ सेवाकेन्द्र -
- बर्थिंग सेन्टर ९
सरकारी संस्था
- अस्पताल तथा नर्सिंग होम -
- पोलिक्लिनिक -
- औषधि पसल -
निजी (गैर-सरकारी संस्था समेत)
अन्य स्वास्थ्य केन्द्रहरु
- माइक्रोस्कोपी केन्द्र -
- एआरटि केन्द्र -
- एचाईभी परीक्षण केन्द्र -
- क्षयरोग उपचार केन्द्र ६
- आयुर्वेद अस्पताल/केन्द्र १
- आँखा अस्पताल/केन्द्र -
अस्पताल शैयाहरू
- सार्वजनिक १५
- निजी -
थप सेवाहरू
वडा अनुसार स्वास्थ्य संस्थाको जानकारी
| स्वास्थ्यसंस्थाको नाम | वार्ड न | बर्थिंग सेन्टर BEONC/CEONC | महिला स्वास्थ्य स्वयं सेवक संख्या | दक्ष प्रसुतिकर्मी संख्या | परिवार नियोजन *सेवा | स्वीकृत दरबन्दी | दरबन्दी अनुसार पदपूर्ति | करारका कर्मचारी |
|---|---|---|---|---|---|---|---|---|
| पगनाथ स्वास्थ्य चौकि | १ | प्रसुति केन्द्र | १२ | १ | ३ साधनहरू | ५ | ५ | ३ |
| रूमा स्वास्थ्य चौकि | २ | प्रसुति केन्द्र | १० | १ | ३ साधनहरू | ५ | ३ | १ |
| बडाखोला स्वास्थ्य | ७ | प्रसुति केन्द्र | १० | १ | ३ साधनहरू | ५ | ५ | ३ |
| मैलतोली स्वास्थ्य चौकि | ३ | प्रसुति केन्द्र | १२ | १ | ४ साधनहरू | ५ | ३ | २ |
| जगनाथ स्वास्थ्य चौकि | ४ | प्रसुति केन्द्र | १८ | १ | ३ साधनहरू | ५ | ५ | २ |
| कट्टी स्वास्थ्य चौकि | ५ | प्रसुति केन्द्र | १९ | १ | ५ साधनहरू | ५ | ५ | ४ |
| चिपिन सामुदायिक स्वास्थ्य इकाइ | ६ | प्रसुति केन्द्र छैन | ० | ० | ३ साधनहरू | ० | ० | २ |
| बेस्तडा प्रसुति केन्द्र | २ | प्रसुति केन्द्र | ० | १ | ० साधनहरू | ० | ० | २ |
| आधारभुत अस्पताल | - | प्रसुति केन्द्र | - | - | - | - | - | ५ |
| कुल कर्मचारी संख्या | ८१ | ७ | ३० | २६ | २४ | |||
स्वास्थ्य सेवाको लागि मानव संसाधन
- CEONC साइटहरू-
- BEONC साइटहरू-
- आइयुसीडी तथा इम्पलान्ट सेवा प्रदायक३
- एकीकृत बालरोग व्यवस्थापन (IMCI) प्रशिक्षित कर्मचारी१०
- जनसंख्या (प्रति मस्वास्वका) २२५
- जनसंख्या (प्रति स्वास्थ्यकर्मी) ७००
- अनुमानित गर्भवति (प्रति दक्ष प्रसुतिकर्मी) ८६
- अनुमानित गर्भवति (प्रति बर्थिङ्ग सेन्टर) ६७
- जनसंख्या (प्रति स्वास्थ्य संस्था) (अस्पताल,प्रस्वाके र स्वाचौ सहित) -
- जनसंख्या (प्रति सरकारी अस्पताल) १८२०६
- जनसंख्या (प्रति अस्पताल र नर्सिंग होम (सबै) १८२०६
मातृशिशु बालस्वास्थ्य र परिवार नियोजन सेवा उपयोगको अवस्था
स्वास्थ्य सूचना व्यवस्थापन प्रणाली २०८०प्रमूख स्वास्थ्य सेवाहरूको उपयोगको तुलनात्मक अवस्था
| सूचक | भगवतीमाई गाउँपालिका | कर्णाली प्रदेश २०७८/७९ | राष्ट्रीय २०७८/७९ | |||
|---|---|---|---|---|---|---|
| २०७९/८० | २०७७/७८ | २०७८/७९ | ||||
| खाेप |
ग्राफ
तालिका
|
|||||
| बि.सि.जि. कभरेज | ६५.३ | १०१.७ | ६८.७ | ९२ | १०३.५ | |
| २३ महिनाभित्र पूर्ण खोप प्राप्त गरेका बालबालिका (%) | ६९.६ | ० | ० | ० | ० | |
| डि.पि.टि. - हेप बि - हिव ३ कभरेज | ६९.८ | ९६.४ | ८१.१ | ९४ | ९५.२ | |
| दादुरा रूबेला १ (९-११ महिना) कभरेज | ७०.७ | ९१.२ | ७९.६ | ९५ | ९४.७ | |
| जे.इ कभरेज | ७०.५ | ८४.९ | ७७ | ९६ | ९५.९ | |
| टि.डी. २ र टि. डी. २+ कभरेज | ५२.३ | ६८.४ | ४७.५ | ६६ | ७१.७ | |
| पोषण |
ग्राफ
तालिका
|
|||||
| कम जन्म तौल भएका नवजात शिशुको प्रतिशत | ४.८ | ५.७ | ५.३ | ६.८ | ९.४ | |
| नयाँ तौल लिएका १ वर्ष मुनिका शिशुहरुको प्रतिशत | ६५.५ | ११४.७ | ६७.५ | १२० | १०४.१ | |
| नयाँ तौल लिएका २ वर्ष मुनिका शिशुहरु मध्ये अति जोखिम अवस्थाका बालबालिकाहरुको प्रतिशत | ३.५ | २ | २.९ | ४.१ | ३.६ | |
| गर्भवती अवस्थामा १८० दिन आइरन चक्की प्राप्त गरेका गर्भवती महिलाहरुको प्रतिशत | ५७.७ | ६८.४ | ६०.१ | ७३ | ६० | |
| सुत्केरी अवस्थामा भिटामिन ए प्राप्त गरेका महिलाहरुको प्रतिशत | ६९.९ | ७९.५ | ७१.८ | ८८ | ७६.३ | |
| नवजात शिशु तथा बाल रोगको एकीकृत व्यस्थापन |
ग्राफ
तालिका
|
|||||
| नाभी मलम लगाएका नवजात शिशुको प्रतिशत | १०० | ९८.९ | ९९.३ | ९६ | ८२.९ | |
| ब्याक्टेरियाको गम्भीर संक्रमण भएकामध्ये जेन्टामाईसिन सुईद्वारा पूर्ण उपचार पाएको प्रतिशत | ० | ३७.५ | ० | ७५ | ४७.४ | |
| नयाँ निमोनिया बिरामीको दर (प्रति हजार पाँच वर्षमुनिका बालबालिकाहरुमा) | २७.७ | ३१.९ | ४०.९ | ११३ | ३६.८ | |
| नयाँ एआरआई (स्वाशप्रश्वाका) बिरामी मध्ये कडा निमोनिया भएका बिरामीको प्रतिशत | ० | ०.१५ | ०.०३ | ०.४१ | ०.१८ | |
| नयाँ झाडापखालाका बिरामीको दर (प्रति हजार पाँच वर्ष मुनिका बालबालिकाहरुमा) | १८७.९ | २५३.५ | २०६.३ | ५७९ | ३५२.४ | |
| ५ वर्ष मुनिका झाडापखालाका बिरामी मध्ये जिंक र पुनर्जलीय झोलबाट उपचार गरेको प्रतिशत | ९२.९ | १३७.८ | ९७.७ | ९५ | ९४.५ | |
| जम्मा नवजात शिशु मृत्यु संख्या | ० | २ | ० | १९९ | १९१४ | |
| सुरक्षित मातृत्व तथा परिवार नियोजन |
ग्राफ
तालिका
|
|||||
| प्परोटोकल अनुसार पहिलो पटक गर्भवती जाँच गराएका गर्भवती महिलाहरुको प्रतिशत | ४५.२ | ७६.५ | ७२.३ | १२२ | ९१.४ | |
| प्रजनन् उमेरका महिलाहरुमा परिवार नियोजनको प्रयोगकर्ता दर (आधुनिक साधन) | १६.४ | १४.२ | १७.६ | ० | ० | |
| ४ पटक गर्भवती जाँच (महिना: ४,६,८,९/हप्ता: १६, २०-२४,३२ र ३६) महिलाहरुको प्रतिशत | ५६.५ | ७५.६ | ६४.२ | ७३ | ७९.४ | |
| स्वास्थ्य संस्था प्रसुति दर | ७१.९ | ५१.६ | ४७.८ | ८३ | ७९ | |
| दक्ष प्रसुतिकर्मी/स्वास्थ्यकर्मीद्वारा प्रसुति गराएको प्रतिशत | ३६.२ | ० | ० | ७० | ७५ | |
| प्रोटोकल अनुसार ४ पटक (आ.व २०७८/७९ सम्म ३ पटक) सुत्केरी जाँच गराउने आमाहरुको प्रतिशत | ६०.१ | १९.६ | २१.६ | ५३ | ४०.८ | |
| जम्मा मातृ मृत्यु संख्या | ० | ० | ० | १७ | २३१ | |
| परिवार नियोजन सेवाका नयाँ सेवाग्राही दर (प्रजनन उमेरका महिलाहरु मध्ये) | ६.९ | ६.४ | ७.५ | १९ | ११.५ | |
| औलो रोग, क्षय रोग, कुष्ठरोग र एचआईभी |
ग्राफ
तालिका
|
|||||
| औलोको स्लाइड नमुना पोजेटिभ दर | ० | ० | ० | ०.२५ | ०.१७ | |
| डेंगुको जम्मा विरामी संख्या | ० | ० | ० | ० | ० | |
| आयातित औलोरोगको प्रतिशत (नयाँ औलो रोग मध्ये | ० | ० | ० | ६३ | ८९.५ | |
| जम्मा औलो रोग मध्ये प्लाज्मोडियम फाल्सिपारमको अनुपात | ० | ० | ० | २.१ | २२.८ | |
| नयाँ क्षयरोगी बिरामी पत्ता लागेको दर | ३७.३ | १९ | २७.२ | ९७ | १२९.१ | |
| क्षयरोगको उपचार सफलता दर | १०० | ८७.५ | ५० | ९१ | ९१.५ | |
| कुष्ठरोगको रोग प्रकोप दर (प्रति १०००० मा) | ० | ० | ० | ०.५ | ० | |
| ए. आर. टी. उपचारमा रहेका जम्मा एच. आइ. भी. पोजेटिभको संख्या | ० | ० | ० | ६९१ | २२१५२ | |
| उपचारात्मक सेवा |
ग्राफ
तालिका
|
|||||
| ओ पि डी मा आएका बिरामी मध्ये नयाँ बिरामीको दर | ८९.२ | ९२ | ८९.२ | १०५ | ९२ | |
शीर्ष १० स्वास्थ्य अवस्थाको सूची
स्वास्थ्य सूचना व्यवस्थापन प्रणाली २०८०स्वास्थ्य क्षेत्रमा बजेट
- सशर्त स्वास्थ्यमा छुट्याएको बजेट
- समानीकरणबाट विनियोजित स्वास्थ्य बजेट
- अन्य श्रोतबाट बिनियोजित स्वास्थ्य बजेट
| बजेट | भगवतीमाई गाउँपालिका | |||||
|---|---|---|---|---|---|---|
| २०७८/७९ | २०८०/८१ | २०७९/८० | ||||
| ग्राफ | ||||||
| पालिकाको कुल बजेट (रु ) | ५१२,३७३,३३४ | ४६९,७८४,००० | ५२५,९७१,३१४ | |||
| स्वास्थ्य बजेट (सबै स्रोत) | ३५,२००,००० | ४७,४८७,००० | ५०,२२०,००० | |||
| सशर्त स्वास्थ्यमा छुट्याएको बजेट | ३५,२००,००० | ४२,०९१,००० | ४४,८८५,००० | |||
| समानीकरणबाट विनियोजित स्वास्थ्य बजेट | ५,०९६,००० | ५,३३५,००० | ||||
| अन्य श्रोतबाट बिनियोजित स्वास्थ्य बजेट | ३००,००० | |||||
| बजेट खर्च (%) | - | - | ९३ | |||
| तालिका | ||||||
महत्वपूर्ण सम्पर्क
Bhagawatimai Rural Municipality
ठेगाना : पगनथ भगवतिमाइ गाँउपालिका दैलेख
टेलिफोन : ९७७-९८५८०२०८९९
वेबसाइट : http://bhagawatimaimun.gov.np/

यो प्रोफाइल अमेरिकी अन्तर्राष्ट्रिय विकास नियोग (युएसएआइडी) मार्फत अमेरिकी जनताहरुको सहयोगका कारण सम्भव बनेको हो । यो प्रतिवेदन भित्रका विषयवस्तु र सामग्री स्वास्थ्यका लागि सक्षम प्रणालीका एकल जिम्मेवारी हुन् र तिनले युएसएआइडी वा अमेरिकी सरकारको विचारको प्रतिविम्बित गर्छन् भन्ने जरुरी छैन ।