संक्षिप्त परिचय बीरेन्द्रनगर नगरपालिका
कर्णाली प्रदेशको राजधानीका रुपमा रहेको यस वीरेन्द्रनगर नगरपालिकाको स्थापना वि.सं. २०३३ सालमा सुर्खेत उपत्यका भित्र पर्ने कटकुवा, गोठीकाडा र जर्बुटा गाउँ पञ्चायत भित्र पर्ने केही भागलाई मिलाएर वीरेन्द्रनगर नगरपञ्चायतका रुपमा रहेकोमा नेपाल सरकारका विभिन्न समयका निर्णय बमोजिम हाल १६ वडामा विभाजन गरिएको छ । नेपालको राजधानी काठमाण्डौं देखि लगभग ६०० कि.मी. उत्तर पश्चिममा समुन्द्री सतहबाट लगभग ६६५ मी. मा अवस्थित यो नगरपालिकाको उत्तरमा महाभारत पर्वतको रानीमत्ता, रातानांङला र दक्षिणमा चुरे पहाडको हर्रे, देउरालीका मनोरम पहाडद्वारा घेरिएको कचौरा आकारमा दक्षिण तर्फ ढल्किएको सानो, न धेरै जाडो हुने न धेरै गर्मी हुने सुन्दर उपत्यका हो । नगरपालिकाको विस्तार अघि ३६ वर्ग कि.मी. क्षेत्रफल ओगटेकोमा हाल न.पा.को कूल क्षेत्रफल २४५.८५ वर्ग कि.मी. रहेको छ ।
यस नगरपालिका पूर्वमा पाम्का र साटाखानी गा.वि.स., पश्चिममा हरिहरपुर गा.वि.स., कुनाथरी गा.वि.स र लेखगांउ गा.वि.स., उत्तरमा दैलेख जिल्लाको गोगनपानी गा.वि.स., दक्षिणमा भेरी नदी रहेका छन् ।
वीरेन्द्रनगर नगरपालिकमा बसोबासको प्रारम्भ २०२३ सालबाट भएको पाइन्छ । यस भन्दा अगाडि नगरपालिकाको मैदानी भाग (उपत्यका क्षेत्रमा) औलो लाग्ने हु“दा जिल्ला सदरमुकाम गढी गा.वि.स. मा रहेको र उपत्यकामा फाटफुट रुपमा थारु र राजी समुदायको बसोबास रहेको थियो । औलो उन्मुलन भए पश्चात् उपत्यकामा बसोबास गर्न थालियो र सबै सरकारी कार्यालयहरुलाई स्थानान्तरण गरी सदरमुकाम तोकियो ।
वीरेन्द्रनगर नगरपालिकामा औलो उन्मुलन पश्चात् सुर्खेत जिल्लाका विकट पहाडी क्षेत्र लगायत दैलेख जिल्ला र कर्णाली अञ्चलका विभिन्न जिल्लाबाट बसाई सरी स्थायी बसोबास गर्दै आएका व्यक्तिहरुको बाहुल्यता पाइन्छ । ब्राह्मण, क्षेत्री, मगर, थारु, कामी, सार्की, दमाई, दशनामी÷सन्यासी आदि यहा“का प्रमुख जातिहरु हुन् । विभिन्न स्थानबाट बसाई सरी आएकाले यहा“को चालचलन रीतिथिति र स“स्कृतिमा समेत विविधता पाईन्छ ।
वीरेन्द्रनगर नगरपालिकामा वि.सं. २०२२ मा विमानस्थल स्थापना भई नियमित उडान र वि.सं. २०३८ मा रत्नराजमार्ग सडक निर्माण कार्य सम्पन्न भई नियमित रुपमा सडक यातायात सेवा शुरु भए पश्चात् वीरेन्द्रनगर कर्णाली अञ्चलका जिल्लाहरुको प्रवेशद्वारका रुपमा स्थापित भएको छ । कर्णाली अञ्चलमा उपभोग हुने सम्पूर्ण सामग्री वीरेन्द्रनगरबाट जाने हुंदा यो पश्चिम नेपाल कै प्रमुख व्यापारिक एवं शैक्षिक पर्यटकिय केन्द्र समेत बन्न पुगेको छ । यसको पूर्वबाट भेरी नदी र पश्चिमबाट कर्णाली नदी बगेकोले ¥याफ्टीङ् गरी आनन्द लिन आउने पर्यटकहरुका लागि समेत यो आकर्षक स्थलको रुपमा परिणत हुन पुगेको छ ।
पहिले चौहानचौर र २०२९ सालपछि वीरेन्द्रनगरको नामले परिचित यो नगरपालिका नेपालका राम्रा गुरुयोजना भएका नगरपालिका मध्येको एक हो । स्वर्गीय राजा वीरेन्द्रबाट देशको सन्तुलित विकासको निम्ति चार विकास क्ष्ँेत्रमा विभाजन गर्दा वीेरेन्द्रनगर सुदूर पश्चिमाञ्चल विकास क्षेत्रको सदरमुकाम घोषणा गरिएको थियो भने हाल मध्यपश्चिमाञ्चल विकास क्षेत्रको सदरमुकामका रुपमा रहेको छ । वीरेन्द्रनगरको भौतिक विकास योजना स्व. राजा वीरेन्द्रकै निर्देशनमा एक उच्चस्तरीय प्राविधिक टोलीद्वारा तयार गरी २०२९ साल माघ १६ गते वीरेन्द्रनगर नगरयोजना स्वीकृत गरी कार्यान्वयन गरिंदै आएको छ । पेरिस जस्तो सुन्दर शहरको रुपमा विकास गर्ने लक्ष्य लिई बनाइएको वीरेन्द्रनगरको गुरुयोजनालाई मूर्तरुप दिन वीरेन्द्रनगरका विभिन्न क्ष्ँेत्रमा आवश्यक जग्गा अधिग्रहण गरिएको छ । यति खेर वीरेन्द्रनगरका १ देखि १२ वडाको सडक गुरुयोजना कार्यान्वयनमा आइरहेका छ । यस क्षेत्रमा प्रदेशको माग गर्दै भएको आन्दोलनको उपलब्धी र आन्दोलनमा शाहदत प्राप्त शहिदको सपनालाई वीरेन्द्रनगरको परिकल्पना “शैक्षिक, प्रशासनिक, पर्यटकीय शहर, स्वच्छ, स्वस्थ, समुन्नत वीरेन्द्रनगर” संग प्रत्यक्ष सम्बन्धित बनाउने दिशामा नगरपालिका जुटेको छ ।
जनसाङ्खिक सूचक
-
कूल जनसंख्या २
१५३,८६३
/ -
१ बर्ष भन्दा मुनिको जनसंख्या १
२,६८६
/ -
पाँच बर्ष भन्दा मुनिको जनसंख्या १
१२,५५४
/ -
किशोरावस्था (१०-१९ बर्ष) को जनसंख्या १
३४,६६१
/ -
प्रजनन उमेरका महिला (१५ -४९ बर्ष ) १
५२,९३९
/ -
अनुमानित गर्भवती महिलाहरु १
४,३९४
/ -
अनुमानित जिवित जन्मको संख्या १
२,७५७
/ -
परिवारमा अनुपस्थित (विदेशमा बस्ने) जनसंख्या २
५,८२०
-
मोबाइल फोन भएका घरधुरी (%) २
८७
-
टेलिभिजन भएका घरधुरी (%) २
४९
-
लैङ्गिक अनुपात २
९५
-
१४ बर्ष र सो भन्दा कम उमेरका जनसंख्या १
४३,०८८
/ -
६५ बर्ष र सो भन्दा माथि उमेरका जनसंख्या २
७,२०१
उमेर र लिंगको आधारमा जनसंख्या वितरण
जनगणना २०७८जातिगत आधारमा जनसंख्या वितरण
जनगणना २०७८वार्ड अनुसार जनसंख्या वितरण
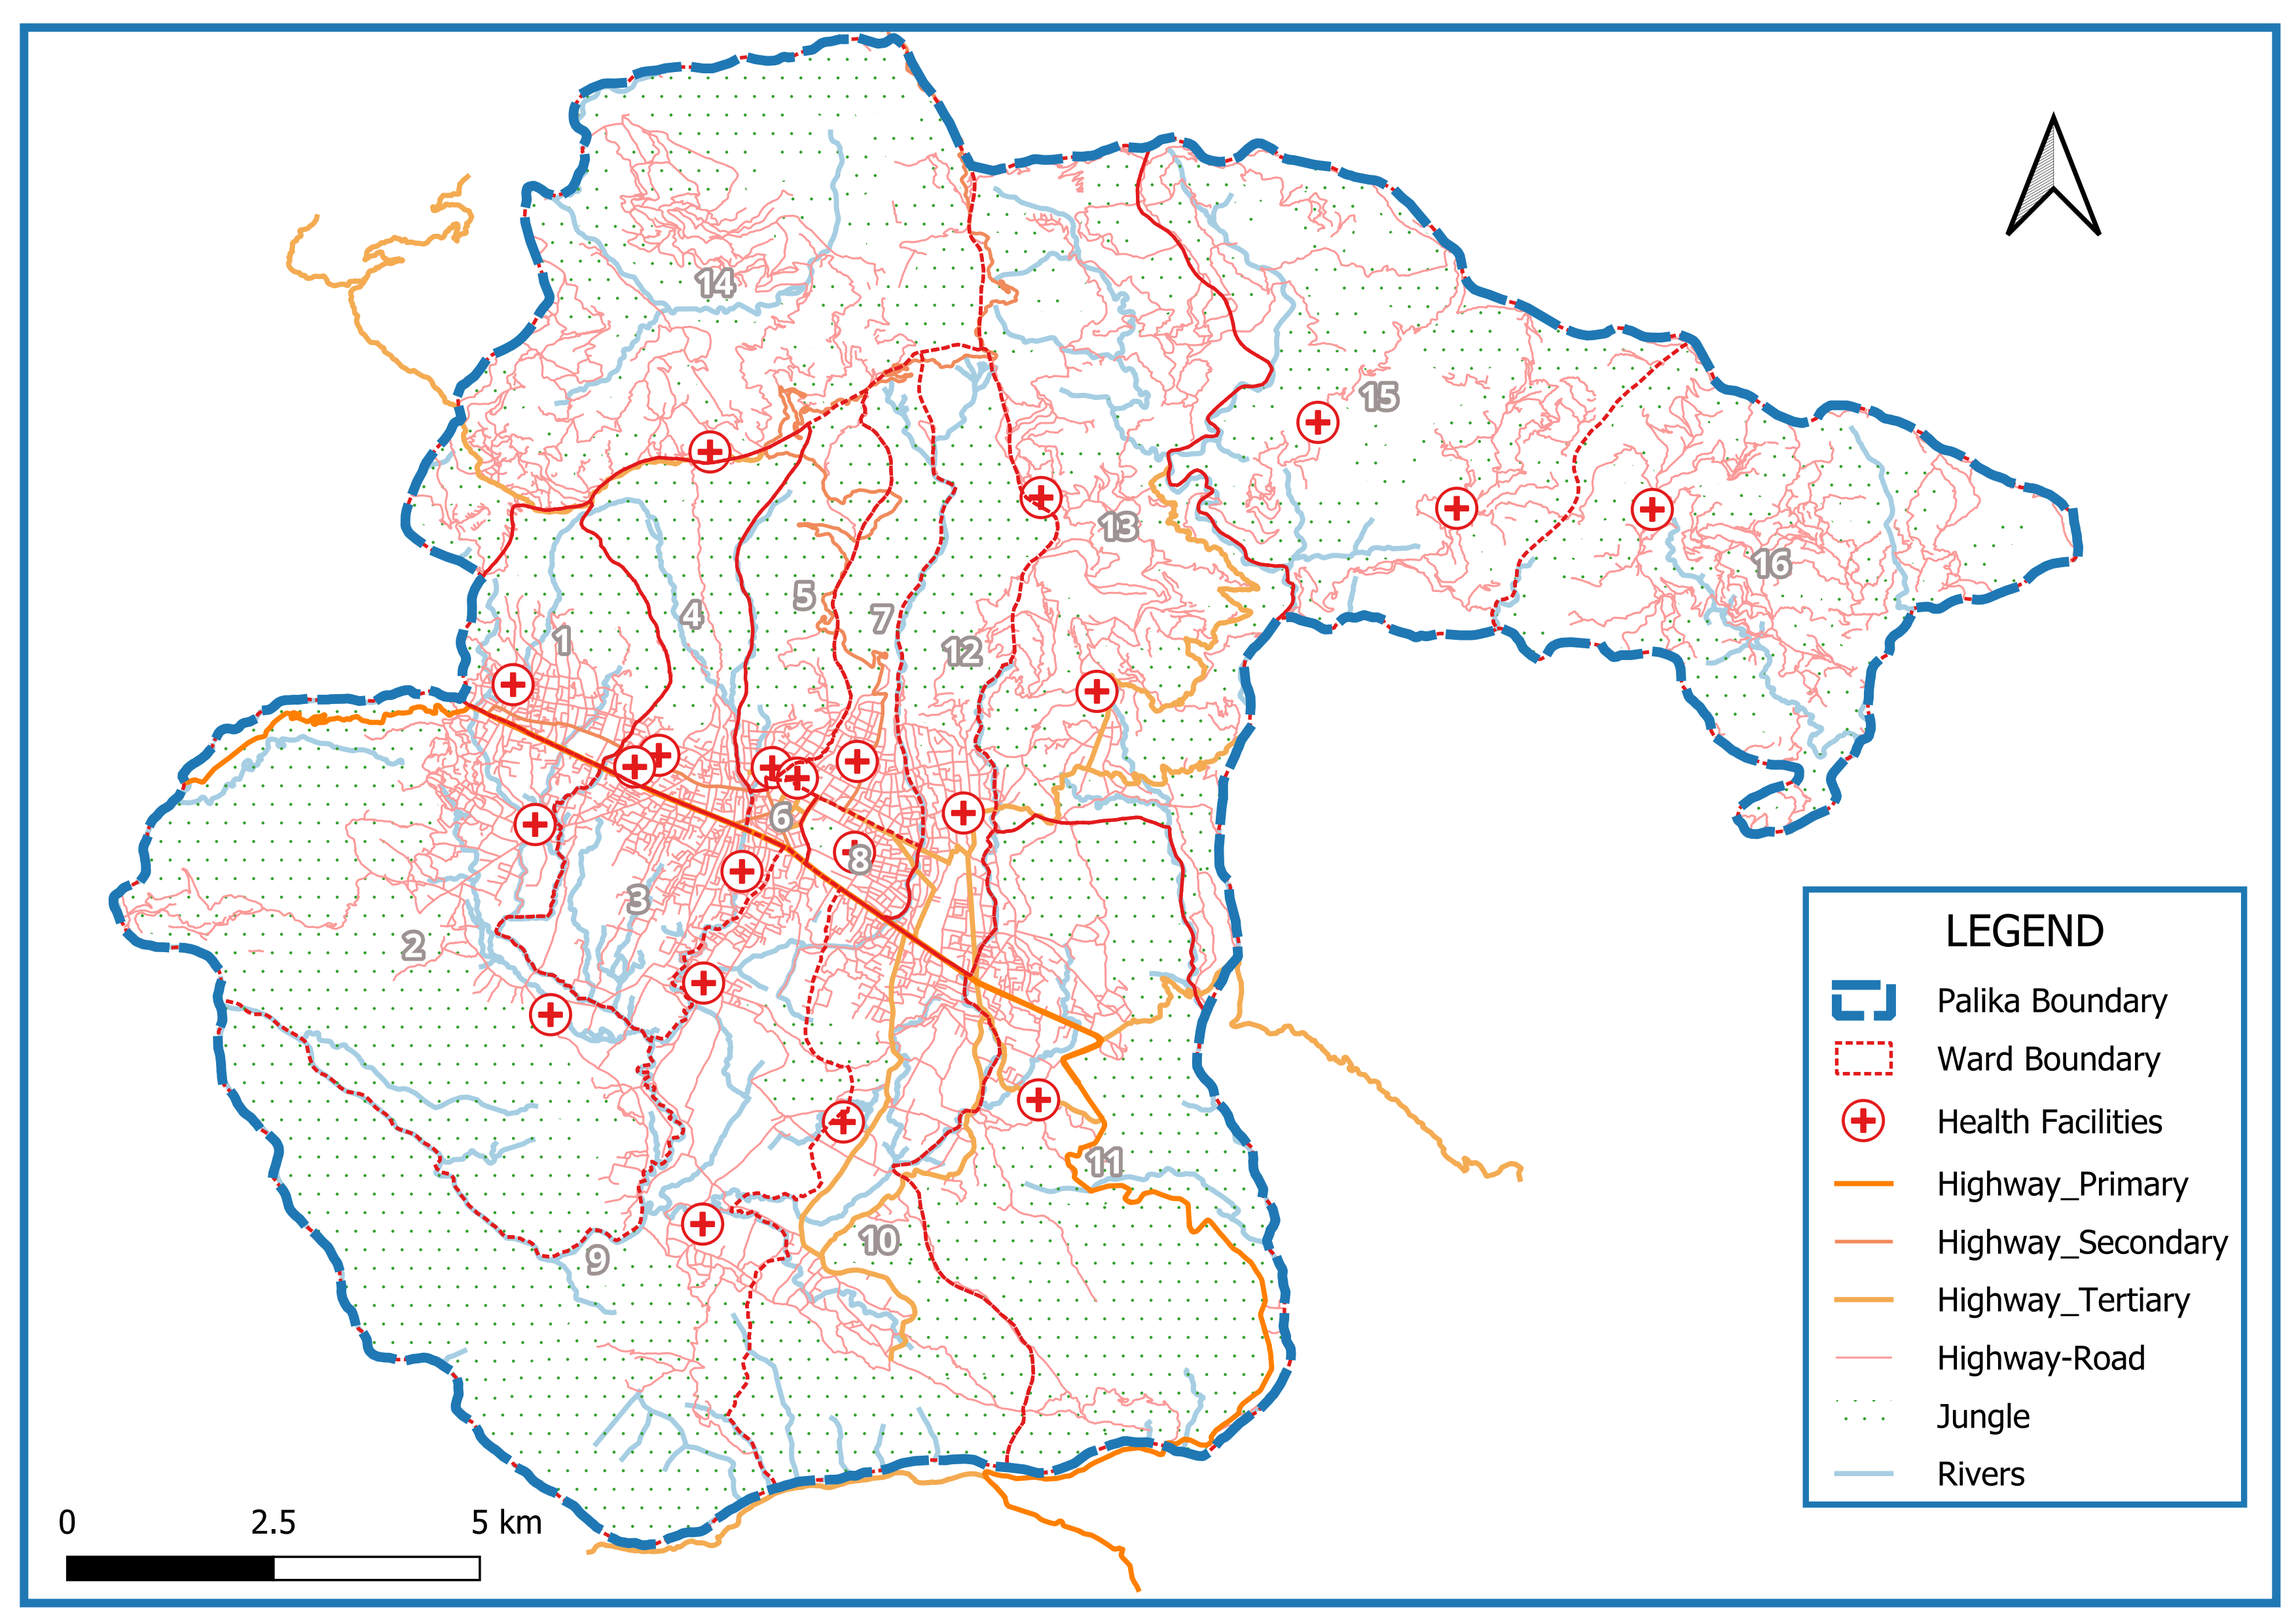
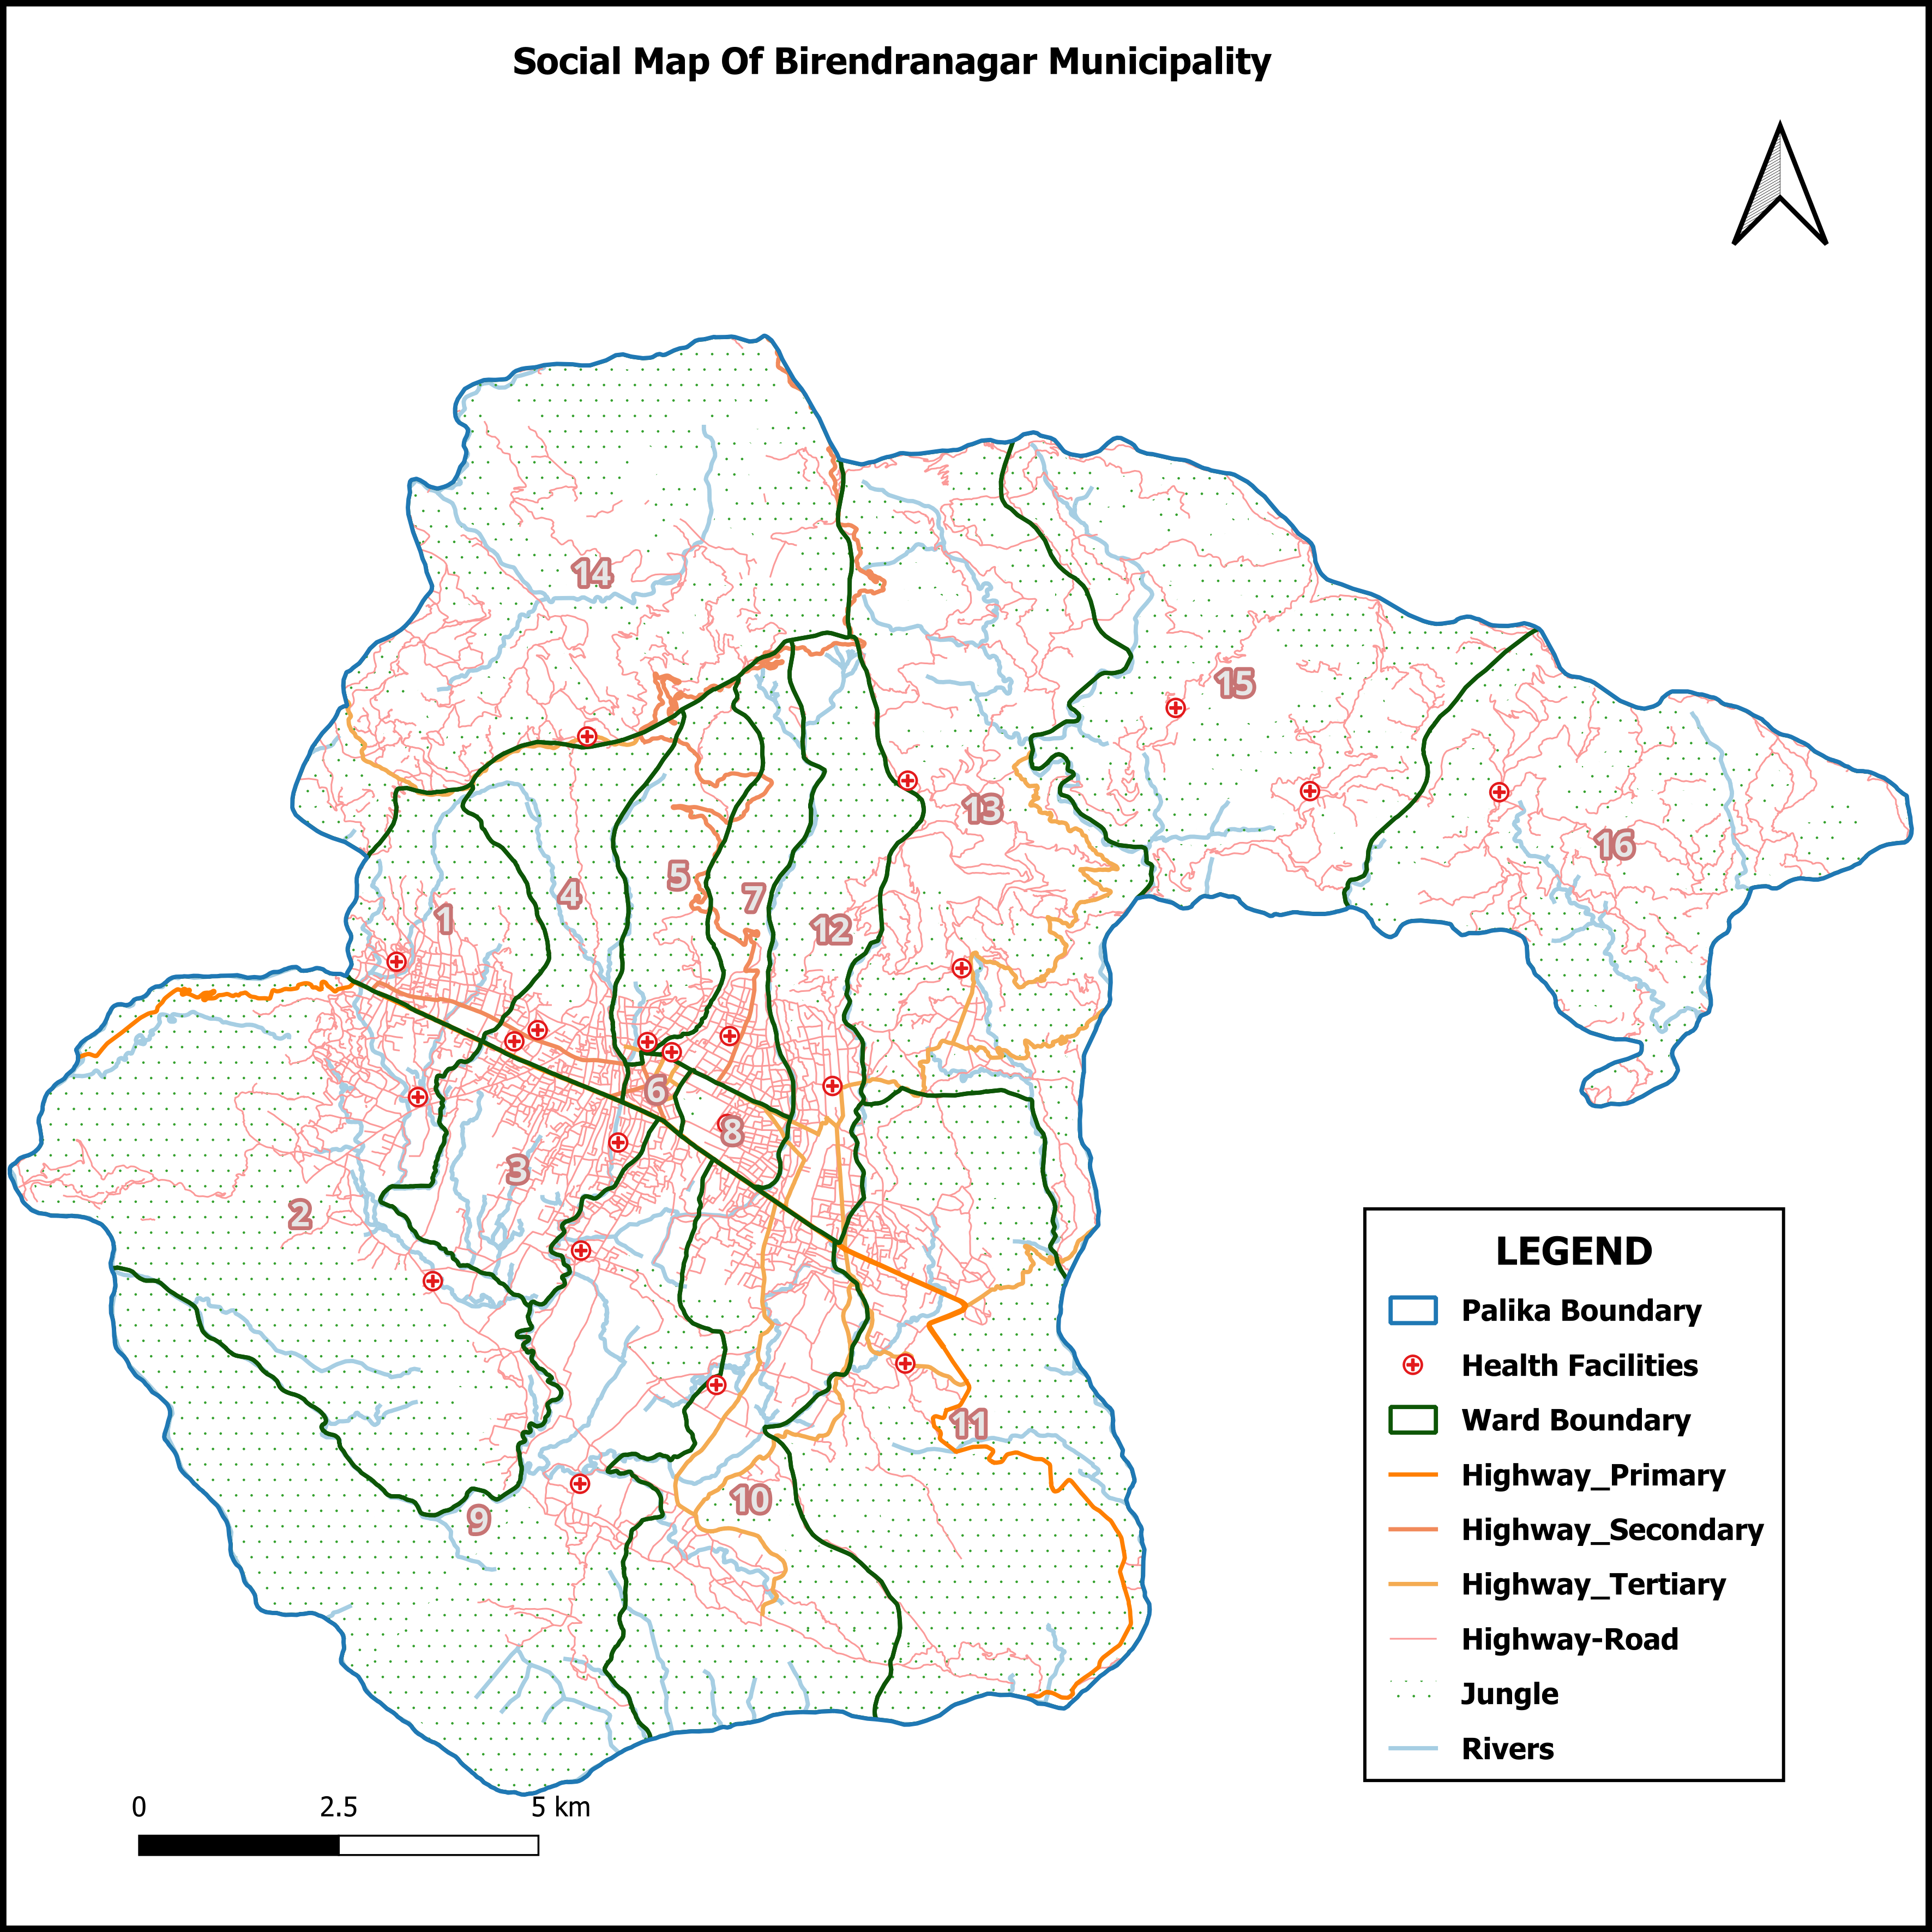
जनगणना २०७८स्वास्थ्य सेवा प्रवाह गर्ने संस्थाहरु
- अस्पताल २
- प्रास्वाके -
- स्वास्थ्य चौकी ७
- सामुदायिक स्वास्थ्य ईकाई -
- शहरी स्वास्थ्य केन्द्र ४
- गाउँघर क्लिनिक १३
- खोप क्लिनिक ३७
- आधारभूत स्वस्थ सेवाकेन्द्र ८
- बर्थिंग सेन्टर ७
सरकारी संस्था
- अस्पताल तथा नर्सिंग होम ८
- पोलिक्लिनिक १२
- औषधि पसल २९
निजी (गैर-सरकारी संस्था समेत)
अन्य स्वास्थ्य केन्द्रहरु
- माइक्रोस्कोपी केन्द्र ८
- एआरटि केन्द्र १
- एचाईभी परीक्षण केन्द्र १
- क्षयरोग उपचार केन्द्र २०
- आयुर्वेद अस्पताल/केन्द्र १
- आँखा अस्पताल/केन्द्र १
अस्पताल शैयाहरू
- सार्वजनिक ३०५
- निजी १२०
वडा अनुसार स्वास्थ्य संस्थाको जानकारी
| स्वास्थ्यसंस्थाको नाम | वार्ड न | बर्थिंग सेन्टर BEONC/CEONC | महिला स्वास्थ्य स्वयं सेवक संख्या | दक्ष प्रसुतिकर्मी संख्या | परिवार नियोजन *सेवा | स्वीकृत दरबन्दी | दरबन्दी अनुसार पदपूर्ति | करारका कर्मचारी |
|---|---|---|---|---|---|---|---|---|
| धारापानी आ स्वा के | १ | छैन | ८ | - | ३ साधनहरू | २ | २ | १ |
| उत्तरगंगा स्वा चौ | २ | छ | १२ | २ | ५ साधनहरू | ५ | ४ | - |
| दौलतपुर श स्वा के | २ | छैन | ७ | - | ३ साधनहरू | ३ | ३ | २ |
| प्रगतिनगर आ स्वा के | ३ | छैन | १० | १ | ५ साधनहरू | २ | ४ | १ |
| हिलेखाली आ स्वा के | ४ | छैन | ८ | - | ५ साधनहरू | २ | ३ | १ |
| चिसापानी आ स्वा के | ५ | छैन | ६ | - | ४ साधनहरू | २ | २ | - |
| नगर अस्पताल | ६ | छ | ७ | १ | ५ साधनहरू | १८ | ८ | २ |
| कटकुवा स्वा चौ | ७ | छैन | ७ | १ | ५ साधनहरू | ५ | २ | - |
| नौलापुर आ स्वा के | ८ | छैन | ७ | १ | ५ साधनहरू | २ | ५ | - |
| लाटिकोईली स्वा चौ | ९ | छैन | १५ | २ | ५ साधनहरू | ५ | ६ | २ |
| पर्सेनी स्वा क्लि | ९ | छैन | - | - | ३ साधनहरू | - | १ | १ |
| घुस्रा आ स्वा के | १० | छैन | १९ | १ | ५ साधनहरू | २ | ३ | १ |
| पिपिरा आ स्वा के | ११ | छैन | १२ | - | ४ साधनहरू | २ | ४ | १ |
| नेवारे आ स्वा के | १२ | छैन | ८ | - | ३ साधनहरू | २ | ३ | ३ |
| जर्वुटा स्वा चौ | १३ | छ | १२ | २ | ४ साधनहरू | ५ | ४ | २ |
| गरगरे श स्वा के | १३ | छैन | ७ | - | ३ साधनहरू | २ | २ | २ |
| गढी स्वा चौ | १४ | छ | १५ | १ | ५ साधनहरू | ५ | ४ | २ |
| रतु स्वा चौ | १५ | छ | ५ | १ | ४ साधनहरू | ५ | २ | - |
| रतु श स्वा के | १५ | छैन | ४ | - | ३ साधनहरू | २ | २ | २ |
| शानिलेख स्वा चौ | १६ | छ | ९ | १ | ४ साधनहरू | ५ | २ | २ |
| कुल कर्मचारी संख्या | १७८ | १४ | ७६ | ६६ | २५ | |||
स्वास्थ्य सेवाको लागि मानव संसाधन
- CEONC साइटहरू१
- BEONC साइटहरू-
- आइयुसीडी तथा इम्पलान्ट सेवा प्रदायक२२
- एकीकृत बालरोग व्यवस्थापन (IMCI) प्रशिक्षित कर्मचारी४४
- जनसंख्या (प्रति मस्वास्वका) ८६४
- जनसंख्या (प्रति स्वास्थ्यकर्मी) २३३१
- अनुमानित गर्भवति (प्रति दक्ष प्रसुतिकर्मी) ३१४
- अनुमानित गर्भवति (प्रति बर्थिङ्ग सेन्टर) ६२८
- जनसंख्या (प्रति स्वास्थ्य संस्था) (अस्पताल,प्रस्वाके र स्वाचौ सहित) -
- जनसंख्या (प्रति सरकारी अस्पताल) ७६९३२
- जनसंख्या (प्रति अस्पताल र नर्सिंग होम (सबै) १५३८६
मातृशिशु बालस्वास्थ्य र परिवार नियोजन सेवा उपयोगको अवस्था
स्वास्थ्य सूचना व्यवस्थापन प्रणाली २०७९०८०प्रमूख स्वास्थ्य सेवाहरूको उपयोगको तुलनात्मक अवस्था
| सूचक | बीरेन्द्रनगर नगरपालिका | कर्णाली प्रदेश २०७८/७९ | राष्ट्रीय २०७८/७९ | |||
|---|---|---|---|---|---|---|
| २०७९/८० | २०७७/७८ | २०७८/७९ | ||||
| खाेप |
ग्राफ
तालिका
|
|||||
| बि.सि.जि. कभरेज | २४८ | १६१ | २१२ | ९२ | १०३.५ | |
| २३ महिनाभित्र पूर्ण खोप प्राप्त गरेका बालबालिका (%) | ० | ० | ० | ० | ० | |
| डि.पि.टि. - हेप बि - हिव ३ कभरेज | १५२ | ११२ | १३८ | ९४ | ९५.२ | |
| दादुरा रूबेला १ (९-११ महिना) कभरेज | १३७ | १०३ | १३० | ९५ | ९४.७ | |
| जे.इ कभरेज | १४४ | १५७ | १३१ | ९६ | ९५.९ | |
| टि.डी. २ र टि. डी. २+ कभरेज | १२० | ८५ | १०४ | ६६ | ७१.७ | |
| पोषण |
ग्राफ
तालिका
|
|||||
| कम जन्म तौल भएका नवजात शिशुको प्रतिशत | १० | १७.३ | ९ | ६.८ | ९.४ | |
| नयाँ तौल लिएका १ वर्ष मुनिका शिशुहरुको प्रतिशत | २०२ | ६२ | १३२ | १२० | १०४.१ | |
| नयाँ तौल लिएका २ वर्ष मुनिका शिशुहरु मध्ये अति जोखिम अवस्थाका बालबालिकाहरुको प्रतिशत | २.६ | १.९ | २.५ | ४.१ | ३.६ | |
| गर्भवती अवस्थामा १८० दिन आइरन चक्की प्राप्त गरेका गर्भवती महिलाहरुको प्रतिशत | १३६ | १२९ | १४० | ७३ | ६० | |
| सुत्केरी अवस्थामा भिटामिन ए प्राप्त गरेका महिलाहरुको प्रतिशत | २७५ | १८७ | २५३ | ८८ | ७६.३ | |
| नवजात शिशु तथा बाल रोगको एकीकृत व्यस्थापन |
ग्राफ
तालिका
|
|||||
| नाभी मलम लगाएका नवजात शिशुको प्रतिशत | १०० | २० | ९८ | ९६ | ८२.९ | |
| ब्याक्टेरियाको गम्भीर संक्रमण भएकामध्ये जेन्टामाईसिन सुईद्वारा पूर्ण उपचार पाएको प्रतिशत | १०० | ४० | ५४ | ७५ | ४७.४ | |
| नयाँ निमोनिया बिरामीको दर (प्रति हजार पाँच वर्षमुनिका बालबालिकाहरुमा) | ११५ | २१ | ५९ | ११३ | ३६.८ | |
| नयाँ एआरआई (स्वाशप्रश्वाका) बिरामी मध्ये कडा निमोनिया भएका बिरामीको प्रतिशत | ० | ० | ५९ | ०.४१ | ०.१८ | |
| नयाँ झाडापखालाका बिरामीको दर (प्रति हजार पाँच वर्ष मुनिका बालबालिकाहरुमा) | २१४ | ९९ | १३९ | ५७९ | ३५२.४ | |
| ५ वर्ष मुनिका झाडापखालाका बिरामी मध्ये जिंक र पुनर्जलीय झोलबाट उपचार गरेको प्रतिशत | १०० | ९९ | १०० | ९५ | ९४.५ | |
| जम्मा नवजात शिशु मृत्यु संख्या | ५० | ४४ | ४० | १९९ | १९१४ | |
| सुरक्षित मातृत्व तथा परिवार नियोजन |
ग्राफ
तालिका
|
|||||
| प्परोटोकल अनुसार पहिलो पटक गर्भवती जाँच गराएका गर्भवती महिलाहरुको प्रतिशत | ९४.८ | १३२ | १५७ | १२२ | ९१.४ | |
| प्रजनन् उमेरका महिलाहरुमा परिवार नियोजनको प्रयोगकर्ता दर (आधुनिक साधन) | ० | ० | ० | ० | ० | |
| ४ पटक गर्भवती जाँच (महिना: ४,६,८,९/हप्ता: १६, २०-२४,३२ र ३६) महिलाहरुको प्रतिशत | १३६.८ | ११५ | १३९ | ७३ | ७९.४ | |
| स्वास्थ्य संस्था प्रसुति दर | २७५ | १८५ | २५२ | ८३ | ७९ | |
| दक्ष प्रसुतिकर्मी/स्वास्थ्यकर्मीद्वारा प्रसुति गराएको प्रतिशत | २७४ | १८२ | २५० | ७० | ७५ | |
| प्रोटोकल अनुसार ४ पटक (आ.व २०७८/७९ सम्म ३ पटक) सुत्केरी जाँच गराउने आमाहरुको प्रतिशत | २५ | २५ | १३४ | ५३ | ४०.८ | |
| जम्मा मातृ मृत्यु संख्या | ३ | ६ | ६ | १७ | २३१ | |
| परिवार नियोजन सेवाका नयाँ सेवाग्राही दर (प्रजनन उमेरका महिलाहरु मध्ये) | २२.१ | २०.२ | २१ | १९ | ११.५ | |
| औलो रोग, क्षय रोग, कुष्ठरोग र एचआईभी |
ग्राफ
तालिका
|
|||||
| औलोको स्लाइड नमुना पोजेटिभ दर | ०.०७ | ०.६३ | ०.३ | ०.२५ | ०.१७ | |
| डेंगुको जम्मा विरामी संख्या | ० | ० | ० | ० | ० | |
| आयातित औलोरोगको प्रतिशत (नयाँ औलो रोग मध्ये | ६६.७ | ६६.७ | ८० | ६३ | ८९.५ | |
| जम्मा औलो रोग मध्ये प्लाज्मोडियम फाल्सिपारमको अनुपात | ० | ० | ० | २.१ | २२.८ | |
| नयाँ क्षयरोगी बिरामी पत्ता लागेको दर | १५२ | १३४.६ | १५४ | ९७ | १२९.१ | |
| क्षयरोगको उपचार सफलता दर | ८९ | १३४.६ | ८९ | ९१ | ९१.५ | |
| कुष्ठरोगको रोग प्रकोप दर (प्रति १०००० मा) | ०.५ | ०.४६ | ०.५६ | ०.५ | ० | |
| ए. आर. टी. उपचारमा रहेका जम्मा एच. आइ. भी. पोजेटिभको संख्या | ३९ | ० | ५६ | ६९१ | २२१५२ | |
| उपचारात्मक सेवा |
ग्राफ
तालिका
|
|||||
| ओ पि डी मा आएका बिरामी मध्ये नयाँ बिरामीको दर | १५७.४ | १३६.४ | १५७ | १०५ | ९२ | |
शीर्ष १० स्वास्थ्य अवस्थाको सूची
स्वास्थ्य सूचना व्यवस्थापन प्रणाली २०७९८०स्वास्थ्य क्षेत्रमा बजेट
- सशर्त स्वास्थ्यमा छुट्याएको बजेट
- समानीकरणबाट विनियोजित स्वास्थ्य बजेट
- अन्य श्रोतबाट बिनियोजित स्वास्थ्य बजेट
| बजेट | बीरेन्द्रनगर नगरपालिका | |||||
|---|---|---|---|---|---|---|
| २०७८/७९ | २०७९/८० | २०८०/८१ | ||||
| ग्राफ | ||||||
| पालिकाको कुल बजेट (रु ) | १,५६५,२६२,६३५ | १,९४१,११२,५०० | ३,०२६,१८९,९६७ | |||
| स्वास्थ्य बजेट (सबै स्रोत) | १०९,७२९,००० | ९७,९००,००० | ११३,९९६,००० | |||
| सशर्त स्वास्थ्यमा छुट्याएको बजेट | ८५,७२९,००० | ६४,६००,००० | ७३,९१४,००० | |||
| समानीकरणबाट विनियोजित स्वास्थ्य बजेट | २३,४००,००० | ३३,०००,००० | ४०,०८२,००० | |||
| अन्य श्रोतबाट बिनियोजित स्वास्थ्य बजेट | ६००,००० | ३००,००० | ||||
| बजेट खर्च (%) | ९१ | - | ९० | |||
| तालिका | ||||||
महत्वपूर्ण सम्पर्क
Birendranagar Municipality
ठेगाना : वीरेन्द्रनगर सुर्खेत
टेलिफोन : ९७७-८३-५२०७५३
वेबसाइट : birendranagarmun.gov.np

यो प्रोफाइल अमेरिकी अन्तर्राष्ट्रिय विकास नियोग (युएसएआइडी) मार्फत अमेरिकी जनताहरुको सहयोगका कारण सम्भव बनेको हो । यो प्रतिवेदन भित्रका विषयवस्तु र सामग्री स्वास्थ्यका लागि सक्षम प्रणालीका एकल जिम्मेवारी हुन् र तिनले युएसएआइडी वा अमेरिकी सरकारको विचारको प्रतिविम्बित गर्छन् भन्ने जरुरी छैन ।