संक्षिप्त परिचय चौकुने गाउँपालिका
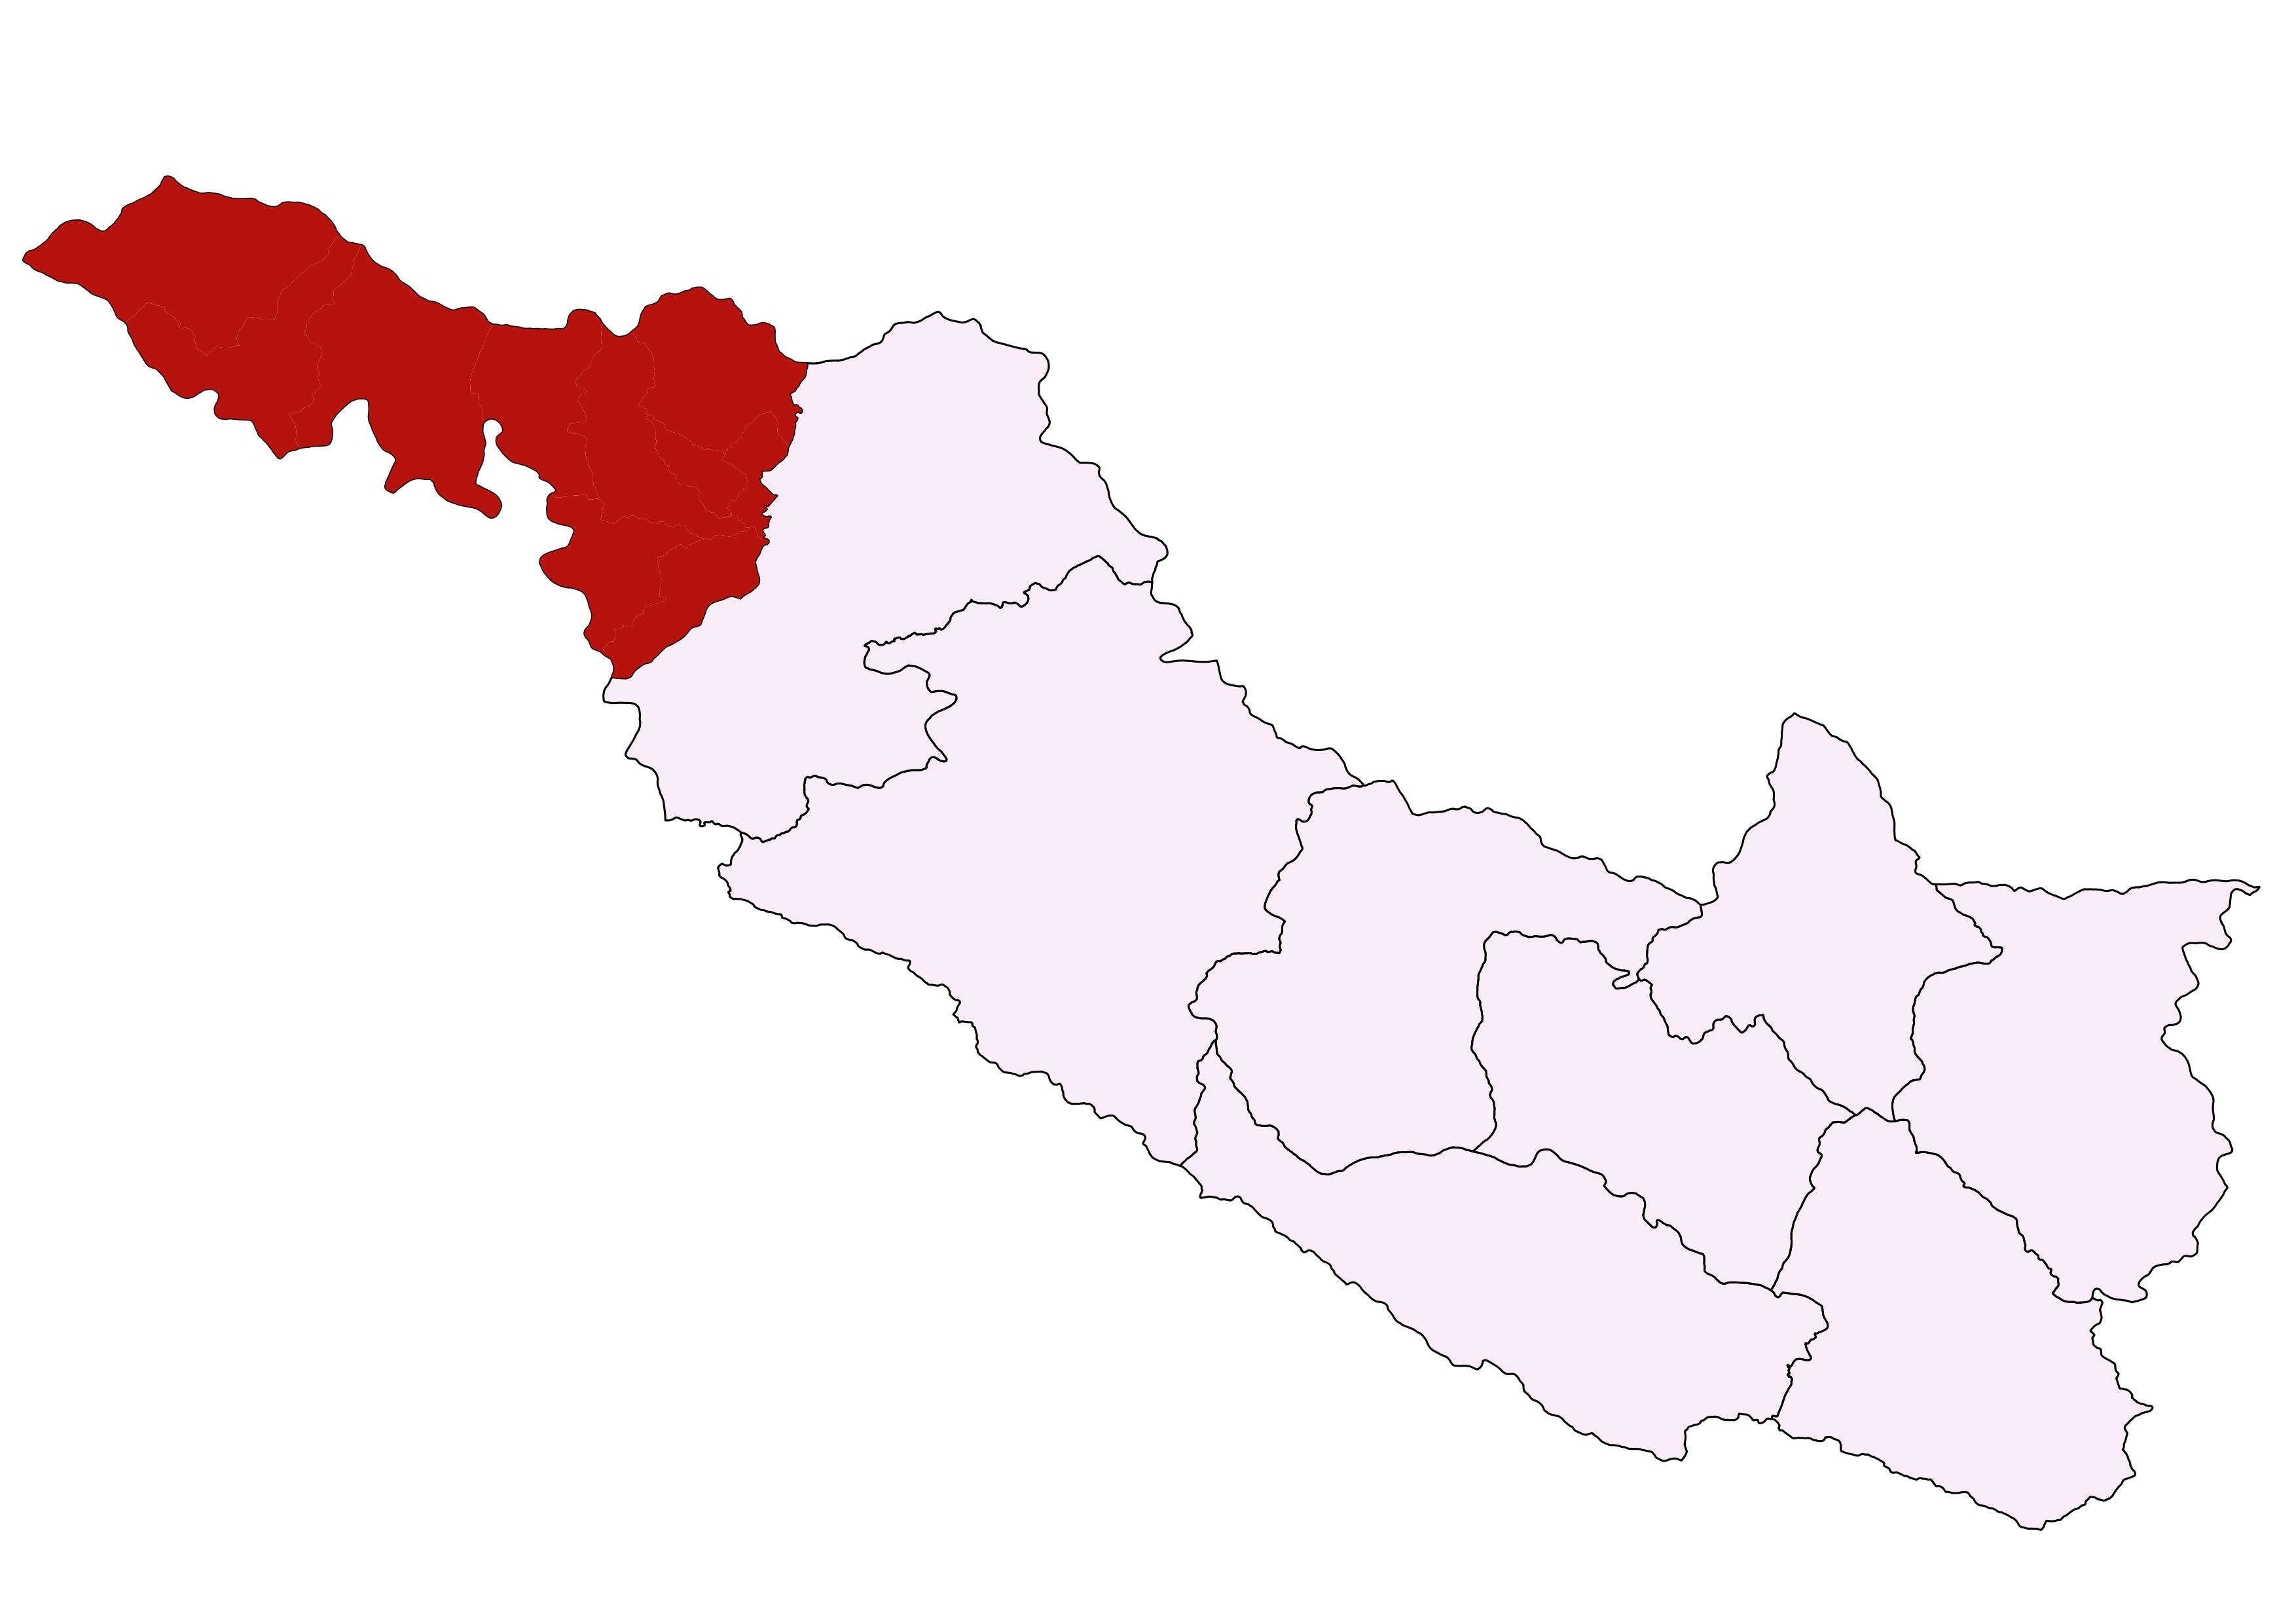
चौकुने गाउँपालिका सुर्खेत जिल्लाको पश्चिम क्षेत्रमा अवस्थित छ । यो गाउँपालिका साविकका लगाम, बेतान¸ विजौरा¸गुटु र घाटगाउँ गा वि स हरु मिलेर बनेको हो । चौकुने गाउँपालिकालाई दशवटा वडामा बिभाजन गरिएको छ । साविकको गुटु गा.वि.स. वडा नं ६ मा रहेको चौकुने पहाडको बिचमा चारकुना मिलेर बनेको क्षेत्रको पहिचानबाट यस गाउँपालिकाको नाम चौकुने नामाकरण भएको हो । यसको क्षेत्रफल करिब ३८१.०३ वर्ग कि मि रहेको यस गाउँपालिकाको केन्द्र साविकको गुटु गाविस वडा नं. ६ मा रहेको छ। यस गाउँपालिकामा जातिय रुपमा मिश्रित बसोबास रहेको छ र बिशेषगरी ब्राह्मण, क्षेत्री, मगर, दलित, राजीहरुको बसोबास रहेको छ।
जनसाङ्खिक सूचक
-
कूल जनसंख्या १
२६,०३७
/ -
१ बर्ष भन्दा मुनिको जनसंख्या १
५८७
/ -
पाँच बर्ष भन्दा मुनिको जनसंख्या १
२,८१५
/ -
किशोरावस्था (१०-१९ बर्ष) को जनसंख्या १
६,११७
/ -
प्रजनन उमेरका महिला (१५ -४९ बर्ष ) १
६,९३०
/ -
अनुमानित गर्भवती महिलाहरु १
९२२
/ -
अनुमानित जिवित जन्मको संख्या १
५८९
/ -
परिवारमा अनुपस्थित (विदेशमा बस्ने) जनसंख्या २
२,६४३
-
मोबाइल फोन भएका घरधुरी (%) २
४,३२६
-
टेलिभिजन भएका घरधुरी (%) २
१९९
-
लैङ्गिक अनुपात २
९७
-
१४ बर्ष र सो भन्दा कम उमेरका जनसंख्या १
८,७८५
/ -
६५ बर्ष र सो भन्दा माथि उमेरका जनसंख्या २
१,३४९
उमेर र लिंगको आधारमा जनसंख्या वितरण
जनगणना २०७८जातिगत आधारमा जनसंख्या वितरण
जनगणना २०७८वार्ड अनुसार जनसंख्या वितरण
जनगणना २०७८स्वास्थ्य सेवा प्रवाह गर्ने संस्थाहरु

- अस्पताल -
- प्रास्वाके -
- स्वास्थ्य चौकी ५
- सामुदायिक स्वास्थ्य ईकाई ६
- शहरी स्वास्थ्य केन्द्र -
- गाउँघर क्लिनिक ७
- खोप क्लिनिक २१
- आधारभूत स्वस्थ सेवाकेन्द्र ५
- बर्थिंग सेन्टर ५
सरकारी संस्था
- अस्पताल तथा नर्सिंग होम -
- पोलिक्लिनिक -
- औषधि पसल ११
निजी (गैर-सरकारी संस्था समेत)
अन्य स्वास्थ्य केन्द्रहरु
- माइक्रोस्कोपी केन्द्र -
- एआरटि केन्द्र -
- एचाईभी परीक्षण केन्द्र -
- क्षयरोग उपचार केन्द्र ५
- आयुर्वेद अस्पताल/केन्द्र १
- आँखा अस्पताल/केन्द्र -
अस्पताल शैयाहरू
- सार्वजनिक -
- निजी -
वडा अनुसार स्वास्थ्य संस्थाको जानकारी
| स्वास्थ्यसंस्थाको नाम | वार्ड न | बर्थिंग सेन्टर BEONC/CEONC | महिला स्वास्थ्य स्वयं सेवक संख्या | दक्ष प्रसुतिकर्मी संख्या | परिवार नियोजन *सेवा | स्वीकृत दरबन्दी | दरबन्दी अनुसार पदपूर्ति | करारका कर्मचारी |
|---|---|---|---|---|---|---|---|---|
| गुठु स्वास्थ्य चौकी | ८ | बर्थिंग सेन्टर | ५ | २ | ५ साधनहरू | ५ | ५ | ३ |
| बिजौरा स्वास्थ्य चौकी | ४ | बर्थिंग सेन्टर | ५ | ३ | ५ साधनहरू | ५ | ४ | ३ |
| घांटगाउ स्वास्थ्य चौकी | १० | बर्थिंग सेन्टर | ५ | १ | ४ साधनहरू | ५ | ३ | ४ |
| बेतान स्वास्थ्य चौकी | ३ | बर्थिंग सेन्टर | ९ | २ | ३ साधनहरू | ५ | ३ | २ |
| बास्पानि स्वास्थ्य चौकी | २ | बर्थिंग सेन्टर | ६ | १ | ५ साधनहरू | ५ | ४ | ३ |
| धनराश् आधारभूत स्वास्थ्य सेवा केन्द्र | १ | छैन | ८ | ० | ३ साधनहरू | ० | ० | ३ |
| लगाम् सामुदायिक स्वास्थ्य इकाइ | २ | छैन | ३ | ० | ३ साधनहरू | ० | ० | ३ |
| सोवान्चौर् सामुदायिक स्वास्थ्य इकाइ | ३ | छैन | ४ | ० | ३ साधनहरू | ० | ० | ३ |
| पच्मा सामुदायिक स्वास्थ्य इकाइ | ४ | छैन | ४ | ० | ३ साधनहरू | ० | ० | ३ |
| कुमला सामुदायिक स्वास्थ्य इकाइ | १० | छैन | ४ | ० | ३ साधनहरू | ० | ० | ३ |
| राग आधारभूत स्वास्थ्य सेवा केन्द्र | ९ | छैन | ६ | ० | ३ साधनहरू | ० | ० | ३ |
| कोइरलबाास सामुदायिक स्वास्थ्य इकाइ | ६ | छैन | ० | ० | ३ साधनहरू | ० | ० | २ |
| मायाताल आधारभूत स्वास्थ्य सेवा केन्द्र | ५ | छैन | ८ | ० | ३ साधनहरू | ० | ० | ३ |
| धामीडाडा आधारभूत स्वास्थ्य सेवा केन्द्र | ७ | छैन | १० | ० | ३ साधनहरू | ० | ० | ३ |
| साल्मा आधारभूत स्वास्थ्य सेवा केन्द्र | ६ | छैन | ८ | ० | ३ साधनहरू | ० | ० | ३ |
| तालागाउ सामुदायिक स्वास्थ्य इकाइ | १ | छैन | १ | ० | ३ साधनहरू | ० | ० | २ |
| कुल कर्मचारी संख्या | ८६ | ९ | २५ | १९ | ४६ | |||
स्वास्थ्य सेवाको लागि मानव संसाधन
- CEONC साइटहरू-
- BEONC साइटहरू-
- आइयुसीडी तथा इम्पलान्ट सेवा प्रदायक५
- एकीकृत बालरोग व्यवस्थापन (IMCI) प्रशिक्षित कर्मचारी२१
- जनसंख्या (प्रति मस्वास्वका) ३०३
- जनसंख्या (प्रति स्वास्थ्यकर्मी) १३७०
- अनुमानित गर्भवति (प्रति दक्ष प्रसुतिकर्मी) १०२
- अनुमानित गर्भवति (प्रति बर्थिङ्ग सेन्टर) १८४
- जनसंख्या (प्रति स्वास्थ्य संस्था) (अस्पताल,प्रस्वाके र स्वाचौ सहित) -
- जनसंख्या (प्रति सरकारी अस्पताल) -
- जनसंख्या (प्रति अस्पताल र नर्सिंग होम (सबै) -
मातृशिशु बालस्वास्थ्य र परिवार नियोजन सेवा उपयोगको अवस्था
स्वास्थ्य सूचना व्यवस्थापन प्रणाली २०७९प्रमूख स्वास्थ्य सेवाहरूको उपयोगको तुलनात्मक अवस्था
| सूचक | चौकुने गाउँपालिका | कर्णाली प्रदेश २०७८/७९ | राष्ट्रीय २०७८/७९ | |||
|---|---|---|---|---|---|---|
| २०७९/८० | २०७७/७८ | २०७८/७९ | ||||
| खाेप |
ग्राफ
तालिका
|
|||||
| बि.सि.जि. कभरेज | ६३.४ | ९४.१ | ८६.१ | ९२ | १०३.५ | |
| २३ महिनाभित्र पूर्ण खोप प्राप्त गरेका बालबालिका (%) | ८७ | ० | ० | ० | ० | |
| डि.पि.टि. - हेप बि - हिव ३ कभरेज | ७८ | १०३.६ | ९८.७ | ९४ | ९५.२ | |
| दादुरा रूबेला १ (९-११ महिना) कभरेज | ७३.८ | ८९.१ | ९४.४ | ९५ | ९४.७ | |
| जे.इ कभरेज | ९१.१ | ६९.२ | ९२.९ | ९६ | ९५.९ | |
| टि.डी. २ र टि. डी. २+ कभरेज | ५०.९ | ७४.८ | ५८.२ | ६६ | ७१.७ | |
| पोषण |
ग्राफ
तालिका
|
|||||
| कम जन्म तौल भएका नवजात शिशुको प्रतिशत | ४.८ | ३.४ | ६.२ | ६.८ | ९.४ | |
| नयाँ तौल लिएका १ वर्ष मुनिका शिशुहरुको प्रतिशत | ८६.४ | १२३.१ | ११४.९ | १२० | १०४.१ | |
| नयाँ तौल लिएका २ वर्ष मुनिका शिशुहरु मध्ये अति जोखिम अवस्थाका बालबालिकाहरुको प्रतिशत | ३.८ | ४.७ | ३.३ | ४.१ | ३.६ | |
| गर्भवती अवस्थामा १८० दिन आइरन चक्की प्राप्त गरेका गर्भवती महिलाहरुको प्रतिशत | ५६.४ | ६९.३ | ५६.८ | ७३ | ६० | |
| सुत्केरी अवस्थामा भिटामिन ए प्राप्त गरेका महिलाहरुको प्रतिशत | ६६ | ८४.८ | ८० | ८८ | ७६.३ | |
| नवजात शिशु तथा बाल रोगको एकीकृत व्यस्थापन |
ग्राफ
तालिका
|
|||||
| नाभी मलम लगाएका नवजात शिशुको प्रतिशत | ९६.५ | ८३.७ | ८६.२ | ९६ | ८२.९ | |
| ब्याक्टेरियाको गम्भीर संक्रमण भएकामध्ये जेन्टामाईसिन सुईद्वारा पूर्ण उपचार पाएको प्रतिशत | ५० | २० | ६६.७ | ७५ | ४७.४ | |
| नयाँ निमोनिया बिरामीको दर (प्रति हजार पाँच वर्षमुनिका बालबालिकाहरुमा) | ९३.१ | ४६.५ | १०९ | ११३ | ३६.८ | |
| नयाँ एआरआई (स्वाशप्रश्वाका) बिरामी मध्ये कडा निमोनिया भएका बिरामीको प्रतिशत | ०.१ | ०.०३ | ०.१३ | ०.४१ | ०.१८ | |
| नयाँ झाडापखालाका बिरामीको दर (प्रति हजार पाँच वर्ष मुनिका बालबालिकाहरुमा) | १५४ | १५३ | १६७ | ५७९ | ३५२.४ | |
| ५ वर्ष मुनिका झाडापखालाका बिरामी मध्ये जिंक र पुनर्जलीय झोलबाट उपचार गरेको प्रतिशत | १००.४ | ९९.८ | ९८ | ९५ | ९४.५ | |
| जम्मा नवजात शिशु मृत्यु संख्या | १ | ० | ० | १९९ | १९१४ | |
| सुरक्षित मातृत्व तथा परिवार नियोजन |
ग्राफ
तालिका
|
|||||
| प्परोटोकल अनुसार पहिलो पटक गर्भवती जाँच गराएका गर्भवती महिलाहरुको प्रतिशत | ५०.२ | ९०.३ | ६७ | १२२ | ९१.४ | |
| प्रजनन् उमेरका महिलाहरुमा परिवार नियोजनको प्रयोगकर्ता दर (आधुनिक साधन) | ३९.८ | २४ | ४०.३ | ० | ० | |
| ४ पटक गर्भवती जाँच (महिना: ४,६,८,९/हप्ता: १६, २०-२४,३२ र ३६) महिलाहरुको प्रतिशत | ५६.४ | ६९.३ | ५८.१ | ७३ | ७९.४ | |
| स्वास्थ्य संस्था प्रसुति दर | ५४ | ५८.९ | ० | ८३ | ७९ | |
| दक्ष प्रसुतिकर्मी/स्वास्थ्यकर्मीद्वारा प्रसुति गराएको प्रतिशत | ० | ० | ० | ७० | ७५ | |
| प्रोटोकल अनुसार ४ पटक (आ.व २०७८/७९ सम्म ३ पटक) सुत्केरी जाँच गराउने आमाहरुको प्रतिशत | ४०.२ | ३०.५ | ३७.२ | ५३ | ४०.८ | |
| जम्मा मातृ मृत्यु संख्या | ० | ० | ० | १७ | २३१ | |
| परिवार नियोजन सेवाका नयाँ सेवाग्राही दर (प्रजनन उमेरका महिलाहरु मध्ये) | १२.१ | २३ | १६.५ | १९ | ११.५ | |
| औलो रोग, क्षय रोग, कुष्ठरोग र एचआईभी |
ग्राफ
तालिका
|
|||||
| औलोको स्लाइड नमुना पोजेटिभ दर | ० | ० | ० | ०.२५ | ०.१७ | |
| डेंगुको जम्मा विरामी संख्या | ० | ० | ० | ० | ० | |
| आयातित औलोरोगको प्रतिशत (नयाँ औलो रोग मध्ये | ० | ० | ० | ६३ | ८९.५ | |
| जम्मा औलो रोग मध्ये प्लाज्मोडियम फाल्सिपारमको अनुपात | ० | ० | ० | २.१ | २२.८ | |
| नयाँ क्षयरोगी बिरामी पत्ता लागेको दर | ० | ० | ० | ९७ | १२९.१ | |
| क्षयरोगको उपचार सफलता दर | ० | ० | ० | ९१ | ९१.५ | |
| कुष्ठरोगको रोग प्रकोप दर (प्रति १०००० मा) | ० | ० | ० | ०.५ | ० | |
| ए. आर. टी. उपचारमा रहेका जम्मा एच. आइ. भी. पोजेटिभको संख्या | ० | ० | ०.३७ | ६९१ | २२१५२ | |
| उपचारात्मक सेवा |
ग्राफ
तालिका
|
|||||
| ओ पि डी मा आएका बिरामी मध्ये नयाँ बिरामीको दर | ८० | १४० | १०६ | १०५ | ९२ | |
शीर्ष १० स्वास्थ्य अवस्थाको सूची
स्वास्थ्य सूचना व्यवस्थापन प्रणाली २०७९-८०स्वास्थ्य क्षेत्रमा बजेट
- सशर्त स्वास्थ्यमा छुट्याएको बजेट
- समानीकरणबाट विनियोजित स्वास्थ्य बजेट
- अन्य श्रोतबाट बिनियोजित स्वास्थ्य बजेट
| बजेट | चौकुने गाउँपालिका | |||||
|---|---|---|---|---|---|---|
| २०७८/७९ | २०७९/८० | २०८०/८१ | ||||
| ग्राफ | ||||||
| पालिकाको कुल बजेट (रु ) | ४८७,५७०,००० | ५९८,२११,००० | ||||
| स्वास्थ्य बजेट (सबै स्रोत) | ४३,२३७,००० | ५४,८००,००० | ||||
| सशर्त स्वास्थ्यमा छुट्याएको बजेट | ३०,८८६,००० | ३५,८००,००० | ||||
| समानीकरणबाट विनियोजित स्वास्थ्य बजेट | १०,८८०,००० | १८,८००,००० | ||||
| अन्य श्रोतबाट बिनियोजित स्वास्थ्य बजेट | १,४७१,००० | २००,००० | ||||
| बजेट खर्च (%) | ८५ | - | ||||
| तालिका | ||||||
महत्वपूर्ण सम्पर्क
स्वास्थ्य शाखा प्रमुख
नाम : इन्द्न बहादुर जैसुरी
सम्पर्क : ९८५८०६४१५५
ईमेल : jaisuri.indra123@gmail.com

यो प्रोफाइल अमेरिकी अन्तर्राष्ट्रिय विकास नियोग (युएसएआइडी) मार्फत अमेरिकी जनताहरुको सहयोगका कारण सम्भव बनेको हो । यो प्रतिवेदन भित्रका विषयवस्तु र सामग्री स्वास्थ्यका लागि सक्षम प्रणालीका एकल जिम्मेवारी हुन् र तिनले युएसएआइडी वा अमेरिकी सरकारको विचारको प्रतिविम्बित गर्छन् भन्ने जरुरी छैन ।