संक्षिप्त परिचय दुल्लु नगरपालिका
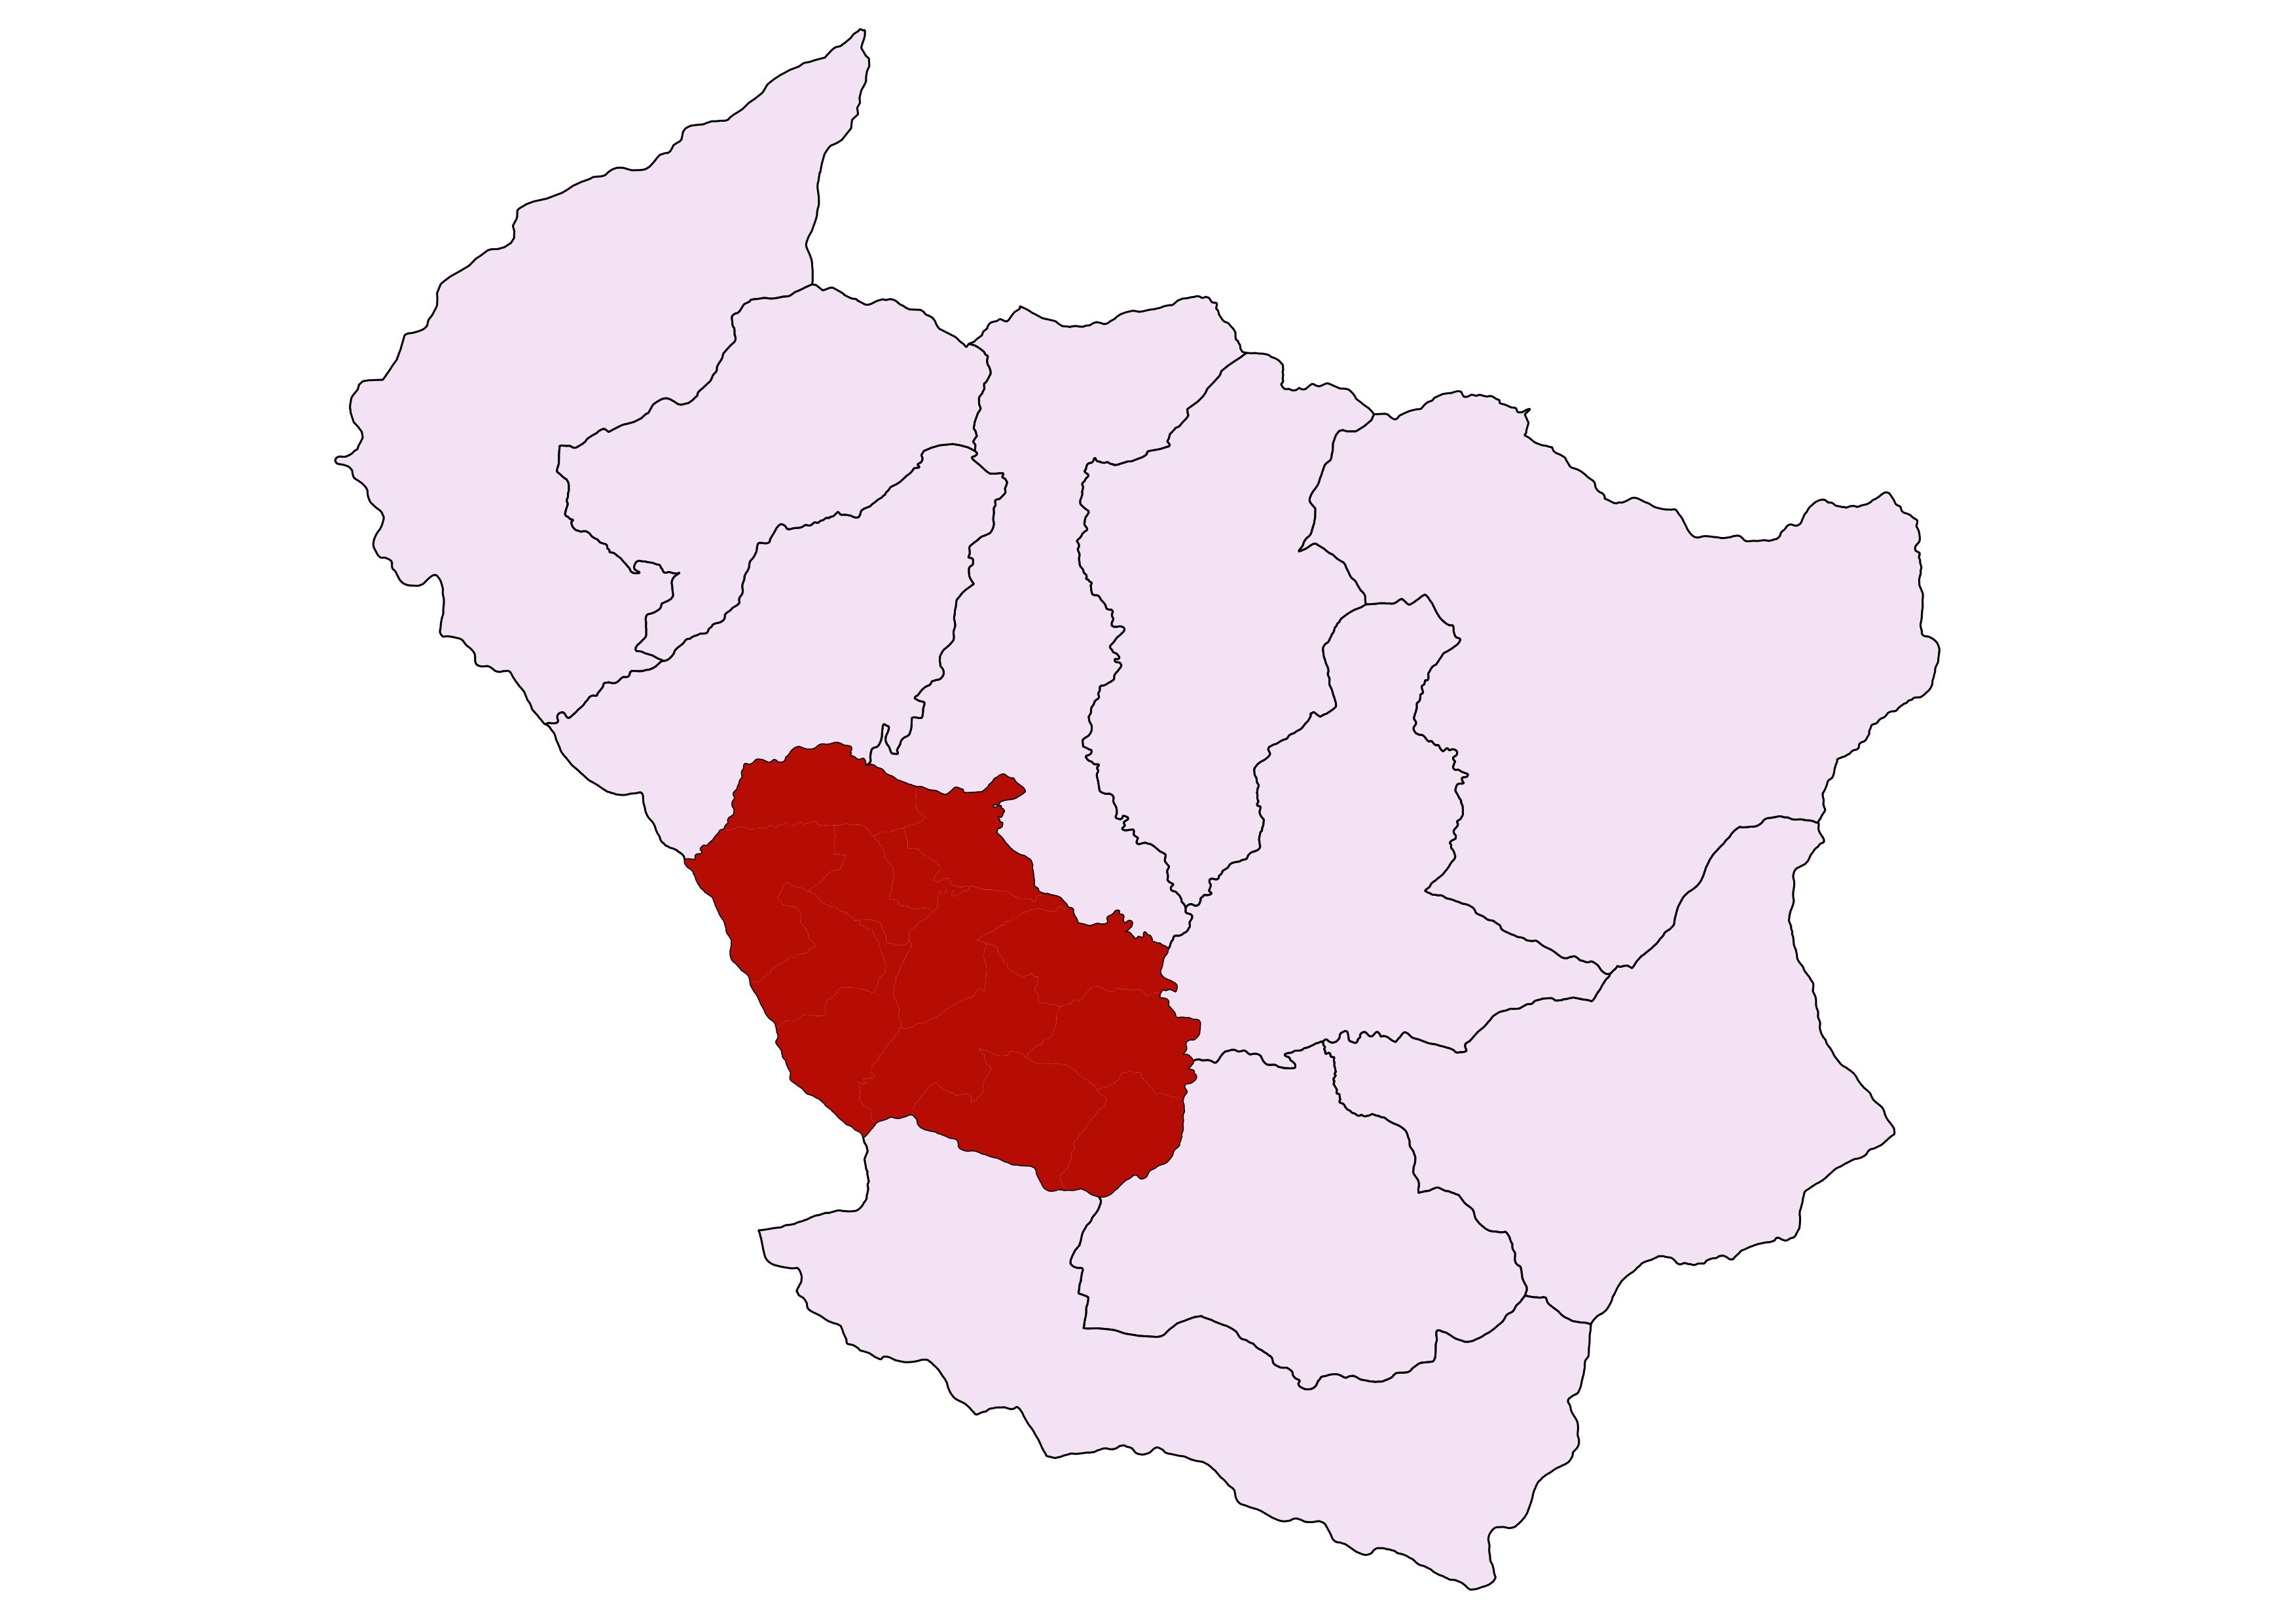
दुल्लु नगरपालिका बि स २०७१ मा स्थानिय तह को रुपमा स्थापन गरियको हो । दुल्लू नगरपालिका को मूख्यालय दुल्लु दैलेख मा पर्दछ । १५६७७ बर्ग किलोमिटर क्षेत्रफल रहेको यस नगरपालिको जनघनत्व २६० प्रति किलोमिटर रहेको छ। १३ ओटा वडा मा बीभाजीत यो नगरपालिका पुर्ब मा नारायण नगरपालिका र दुङेस्वर गाँउपालिका , पस्चिम मा चामुन्डा िबन्द्रासैिन नगरपालिका ,उत्तर मा भैरबि गाँउपालिका ,दक्षिणमा गुराँस गाँउपालिकाले र अछाम जिल्ला ले घेरियको छ।
जनसाङ्खिक सूचक
-
कूल जनसंख्या ७
३८,७४१
-
१ बर्ष भन्दा मुनिको जनसंख्या ७
७६१
-
पाँच बर्ष भन्दा मुनिको जनसंख्या ७
३,५३५
-
किशोरावस्था (१०-१९ बर्ष) को जनसंख्या ७
७,६८१
-
प्रजनन उमेरका महिला (१५ -४९ बर्ष ) ७
१०,२६१
-
अनुमानित गर्भवती महिलाहरु ७
९७५
-
अनुमानित जिवित जन्मको संख्या ७
७७८
-
परिवारमा अनुपस्थित (विदेशमा बस्ने) जनसंख्या २
२,२६८
-
लैङ्गिक अनुपात २
९२
-
१४ बर्ष र सो भन्दा कम उमेरका जनसंख्या ७
१३,३४६
-
६५ बर्ष र सो भन्दा माथि उमेरका जनसंख्या ७
२,०१९
उमेर र लिंगको आधारमा जनसंख्या वितरण
जनगणना २०७८जातिगत आधारमा जनसंख्या वितरण
जनगणना २०७८वार्ड अनुसार जनसंख्या वितरण
जनगणना २०७८स्वास्थ्य सेवा प्रवाह गर्ने संस्थाहरु
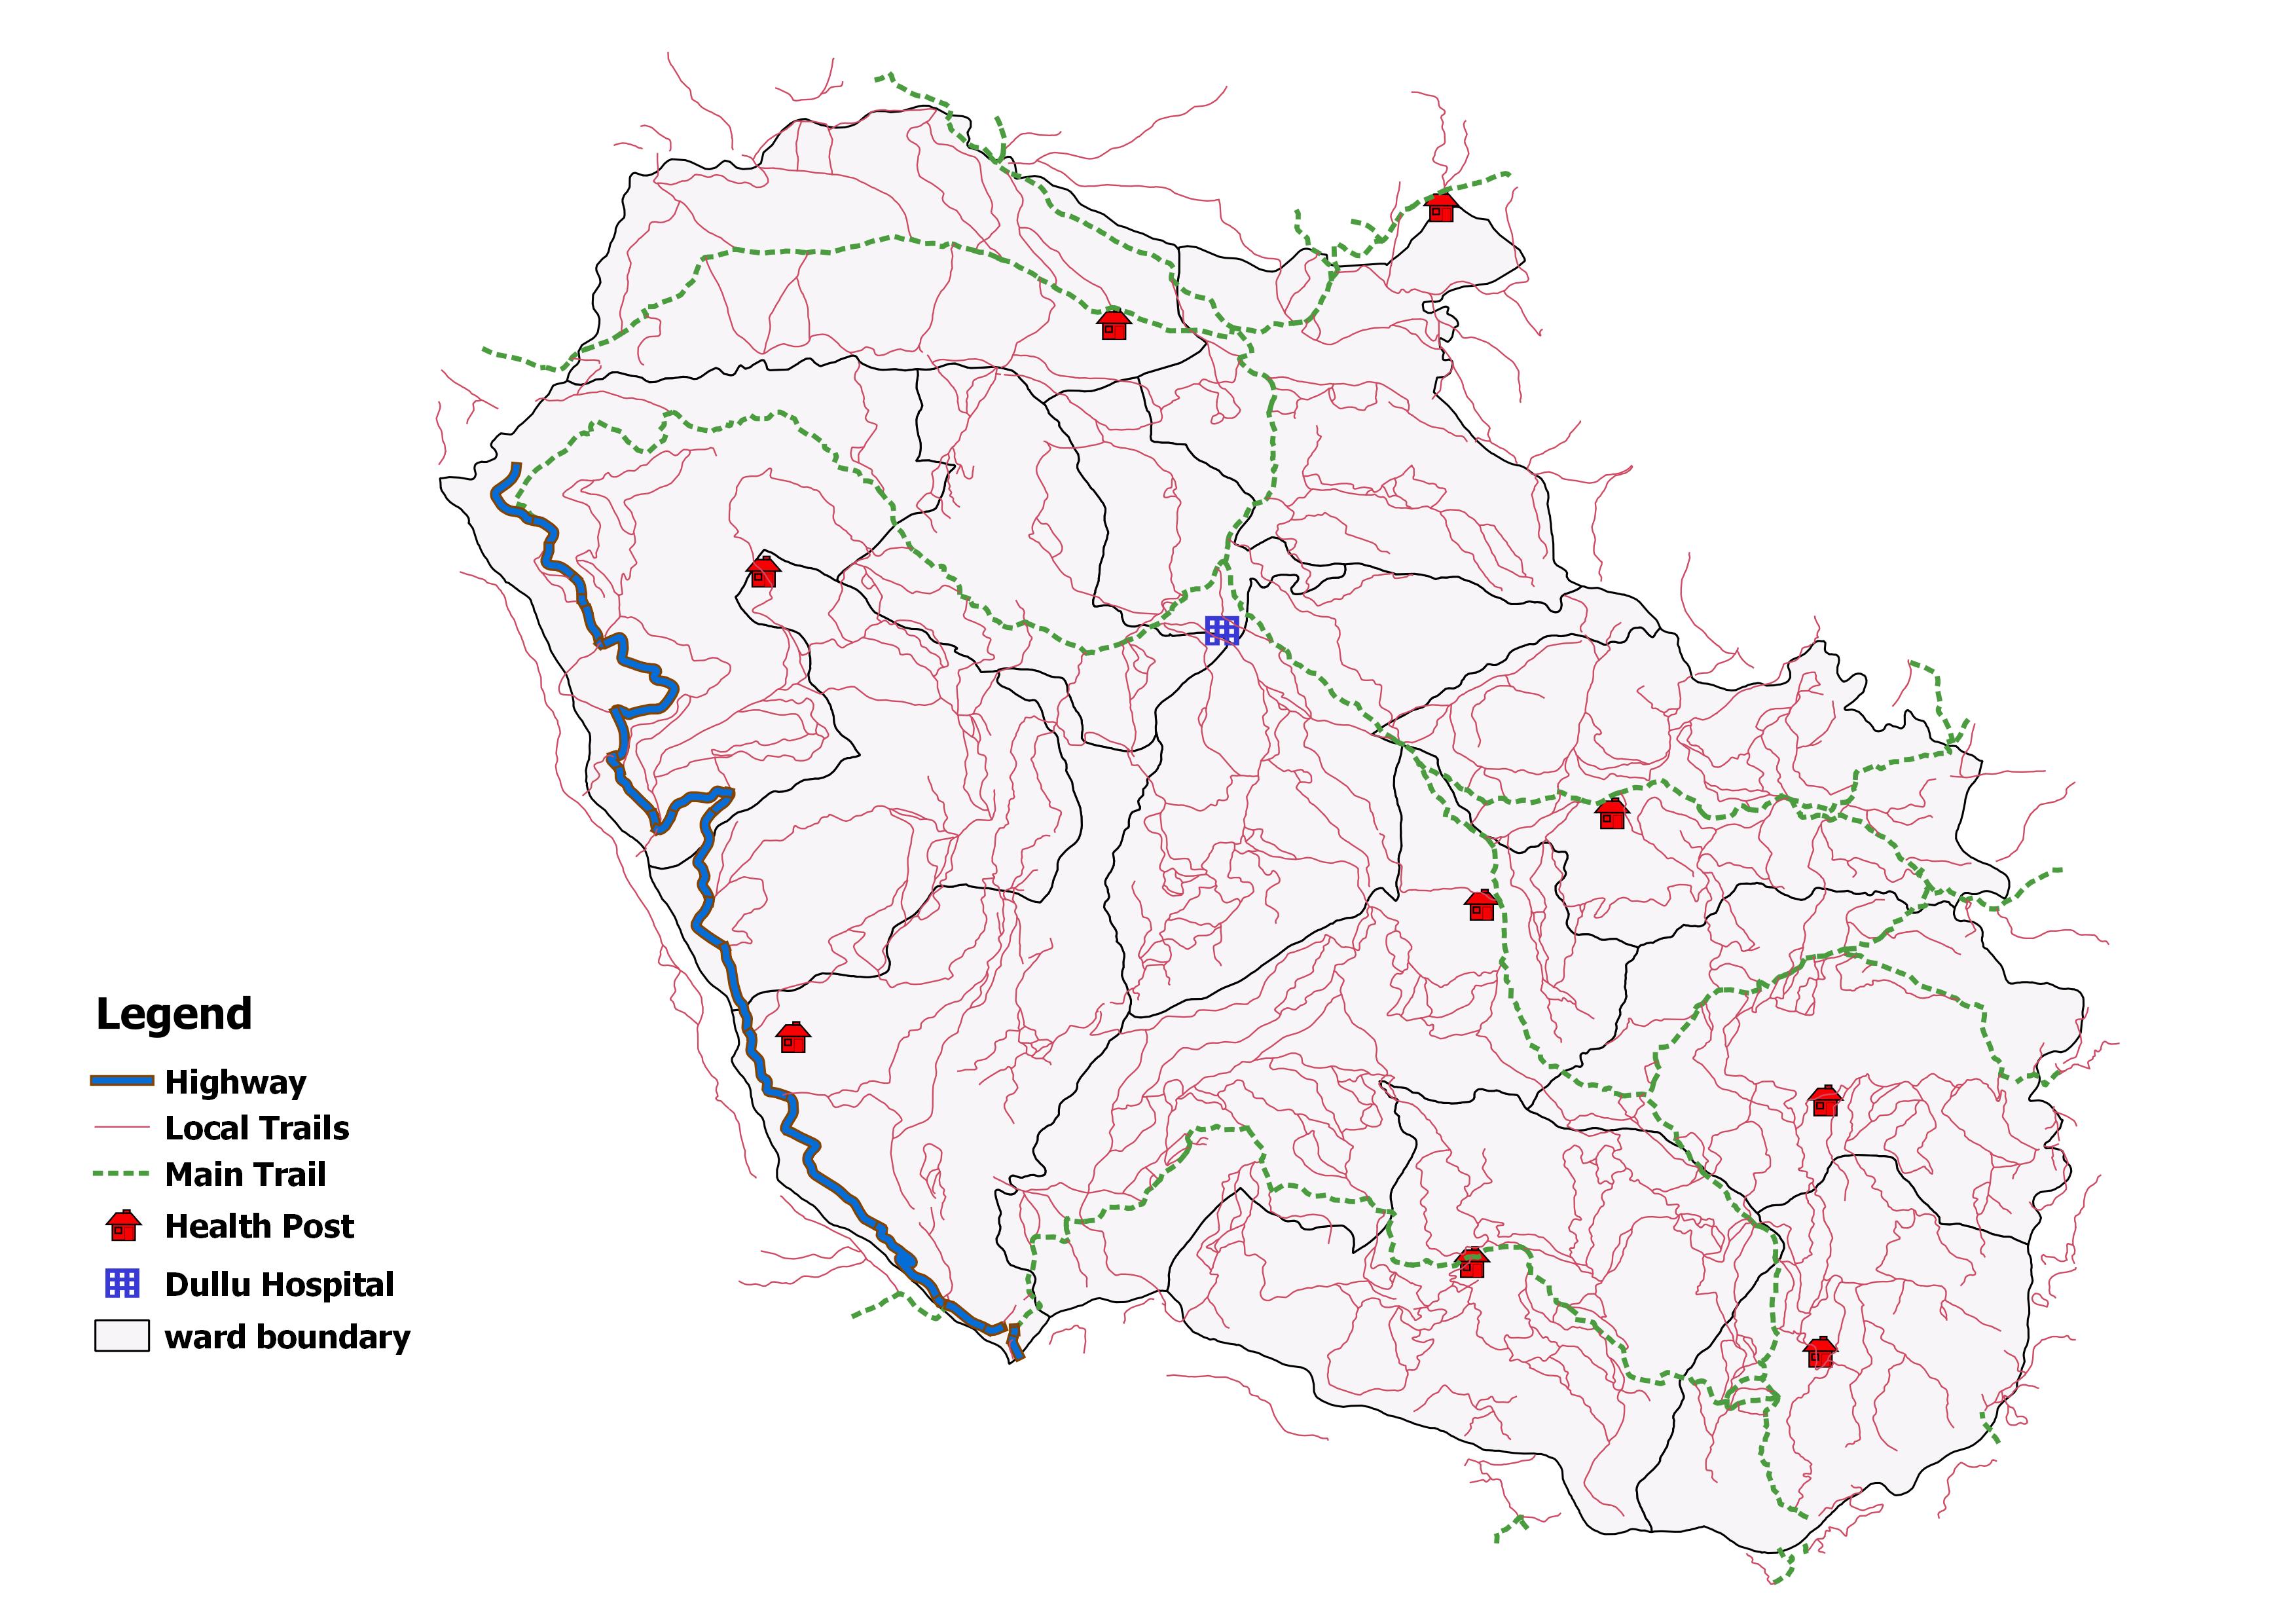
- अस्पताल १
- प्रास्वाके -
- स्वास्थ्य चौकी ९
- शहरी स्वास्थ्य केन्द्र ३
- गाउँघर क्लिनिक ४३
- खोप क्लिनिक ४४
- आधारभूत स्वस्थ सेवाकेन्द्र ४
- बर्थिंग सेन्टर १०
सरकारी संस्था
- अस्पताल तथा नर्सिंग होम -
- पोलिक्लिनिक -
- औषधि पसल -
निजी (गैर-सरकारी संस्था समेत)
अन्य स्वास्थ्य केन्द्रहरु
- माइक्रोस्कोपी केन्द्र १
- एआरटि केन्द्र -
- एचाईभी परीक्षण केन्द्र १
- क्षयरोग उपचार केन्द्र १०
- आयुर्वेद अस्पताल/केन्द्र १
- आँखा अस्पताल/केन्द्र १
अस्पताल शैयाहरू
- सार्वजनिक १५
- निजी -
थप सेवाहरू
- १
वडा अनुसार स्वास्थ्य संस्थाको जानकारी
| स्वास्थ्यसंस्थाको नाम | वार्ड न | बर्थिंग सेन्टर BEONC/CEONC | महिला स्वास्थ्य स्वयं सेवक संख्या | दक्ष प्रसुतिकर्मी संख्या | परिवार नियोजन *सेवा | स्वीकृत दरबन्दी | दरबन्दी अनुसार पदपूर्ति | करारका कर्मचारी |
|---|---|---|---|---|---|---|---|---|
| दुल्लु अस्पातल | ५ | प्रसुति केन्द्र | ० | ५ | ५ साधनहरू | १७ | १० | २३ |
| बडालम्जी स्वास्थ्य चौकि | ८ | प्रसुति केन्द्र | ११ | १ | ३ साधनहरू | ५ | ५ | ३ |
| गमौडी स्वास्थ्य चौकि | १० | प्रसुति केन्द्र | ११ | २ | ३ साधनहरू | ५ | ५ | २ |
| गौरी स्वास्थ्य चौकि | १२ | प्रसुति केन्द्र | १० | ० | ४ साधनहरू | ५ | ५ | ३ |
| कालभैरव चौकि | ११ | प्रसुति केन्द्र | १३ | १ | ५ साधनहरू | ५ | ५ | ३ |
| मलिका स्वास्थ्य चौकि | १३ | प्रसुति केन्द्र | १४ | २ | ३ साधनहरू | ५ | ५ | २ |
| नाउलेकटुवाल स्वास्थ्य चौकि | २ | प्रसुति केन्द्र | १२ | १ | ४ साधनहरू | ५ | ५ | २ |
| नेपा स्वास्थ्य चौकि | ३ | प्रसुति केन्द्र | ११ | १ | ३ साधनहरू | ५ | ५ | ३ |
| पादुका स्वास्थ्य चौकि | ९ | प्रसुति केन्द्र | ८ | ० | ३ साधनहरू | ५ | ५ | २ |
| छिउडीपुसाकोट स्वास्थ्य चौकि | ६ | प्रसुति केन्द्र | १३ | ० | ३ साधनहरू | ५ | ५ | १ |
| शहरी स्वास्थ्य केन्द्र सियाला | ३ | - | ० | ० | ३ साधनहरू | ० | ० | १ |
| आधारभुत स्वास्थ्य सेवा केन्द्र बाँहुनगाँउ | ७ | - | ७ | ० | ३ साधनहरू | ० | १ | १ |
| मालिका स्वास्थ्य चौकी | १३ | - | ० | १ | ३ साधनहरू | ० | १ | १ |
| आधारभुत स्वास्थ्य सेवा केन्द्र रिजु | ५ | - | ८ | ० | ३ साधनहरू | ० | ० | ३ |
| आधारभुत स्वास्थ्य सेवा केन्द्र डाडाआवत | ४ | - | ९ | ० | ३ साधनहरू | ० | ० | ४ |
| शहरी स्वास्थ्य केन्द्र बस्नेपाटी | ४ | - | ० | ० | ३ साधनहरू | ० | ० | १ |
| आधारभुत स्वास्थ्य सेवा केन्द्र देउतीचौर | १ | - | ११ | ० | ३ साधनहरू | ० | १ | २ |
| कुल कर्मचारी संख्या | १३८ | १४ | ६२ | ५८ | ५७ | |||
स्वास्थ्य सेवाको लागि मानव संसाधन
- CEONC साइटहरू१
- BEONC साइटहरू१
- आइयुसीडी तथा इम्पलान्ट सेवा प्रदायक१०
- एकीकृत बालरोग व्यवस्थापन (IMCI) प्रशिक्षित कर्मचारी६५
- जनसंख्या (प्रति मस्वास्वका) २८१
- जनसंख्या (प्रति स्वास्थ्यकर्मी) ६६८
- अनुमानित गर्भवति (प्रति दक्ष प्रसुतिकर्मी) ७०
- अनुमानित गर्भवति (प्रति बर्थिङ्ग सेन्टर) -
- जनसंख्या (प्रति स्वास्थ्य संस्था) (अस्पताल,प्रस्वाके र स्वाचौ सहित) -
- जनसंख्या (प्रति सरकारी अस्पताल) ३८७४१
- जनसंख्या (प्रति अस्पताल र नर्सिंग होम (सबै) ३८७४१
मातृशिशु बालस्वास्थ्य र परिवार नियोजन सेवा उपयोगको अवस्था
स्वास्थ्य सूचना व्यवस्थापन प्रणाली २०८१प्रमूख स्वास्थ्य सेवाहरूको उपयोगको तुलनात्मक अवस्था
| सूचक | दुल्लु नगरपालिका | कर्णाली प्रदेश २०७८/७९ | राष्ट्रीय २०७८/७९ | |||
|---|---|---|---|---|---|---|
| २०७९/८० | २०७३/७४ | २०७३/७४ | ||||
| खाेप |
ग्राफ
तालिका
|
|||||
| बि.सि.जि. कभरेज | ६६ | ० | ० | ९२ | १०३.५ | |
| २३ महिनाभित्र पूर्ण खोप प्राप्त गरेका बालबालिका (%) | ९१ | ० | ० | ० | ० | |
| डि.पि.टि. - हेप बि - हिव ३ कभरेज | ८६ | ० | ० | ९४ | ९५.२ | |
| दादुरा रूबेला १ (९-११ महिना) कभरेज | ९२ | ० | ० | ९५ | ९४.७ | |
| जे.इ कभरेज | ८४ | ० | ० | ९६ | ९५.९ | |
| टि.डी. २ र टि. डी. २+ कभरेज | ५८ | ० | ० | ६६ | ७१.७ | |
| पोषण |
ग्राफ
तालिका
|
|||||
| कम जन्म तौल भएका नवजात शिशुको प्रतिशत | ७ | ० | ० | ६.८ | ९.४ | |
| नयाँ तौल लिएका १ वर्ष मुनिका शिशुहरुको प्रतिशत | ६७ | ० | ० | १२० | १०४.१ | |
| नयाँ तौल लिएका २ वर्ष मुनिका शिशुहरु मध्ये अति जोखिम अवस्थाका बालबालिकाहरुको प्रतिशत | ६९ | ० | ० | ४.१ | ३.६ | |
| गर्भवती अवस्थामा १८० दिन आइरन चक्की प्राप्त गरेका गर्भवती महिलाहरुको प्रतिशत | ८२ | ० | ० | ७३ | ६० | |
| सुत्केरी अवस्थामा भिटामिन ए प्राप्त गरेका महिलाहरुको प्रतिशत | १०० | ० | ० | ८८ | ७६.३ | |
| नवजात शिशु तथा बाल रोगको एकीकृत व्यस्थापन |
ग्राफ
तालिका
|
|||||
| नाभी मलम लगाएका नवजात शिशुको प्रतिशत | ९९ | ० | ० | ९६ | ८२.९ | |
| ब्याक्टेरियाको गम्भीर संक्रमण भएकामध्ये जेन्टामाईसिन सुईद्वारा पूर्ण उपचार पाएको प्रतिशत | १०० | ० | ० | ७५ | ४७.४ | |
| नयाँ निमोनिया बिरामीको दर (प्रति हजार पाँच वर्षमुनिका बालबालिकाहरुमा) | ७९ | ० | ० | ११३ | ३६.८ | |
| नयाँ एआरआई (स्वाशप्रश्वाका) बिरामी मध्ये कडा निमोनिया भएका बिरामीको प्रतिशत | १ | ० | ० | ०.४१ | ०.१८ | |
| नयाँ झाडापखालाका बिरामीको दर (प्रति हजार पाँच वर्ष मुनिका बालबालिकाहरुमा) | १४५ | ० | ० | ५७९ | ३५२.४ | |
| ५ वर्ष मुनिका झाडापखालाका बिरामी मध्ये जिंक र पुनर्जलीय झोलबाट उपचार गरेको प्रतिशत | ६५ | ० | ० | ९५ | ९४.५ | |
| जम्मा नवजात शिशु मृत्यु संख्या | ४ | ० | ० | १९९ | १९१४ | |
| सुरक्षित मातृत्व तथा परिवार नियोजन |
ग्राफ
तालिका
|
|||||
| प्परोटोकल अनुसार पहिलो पटक गर्भवती जाँच गराएका गर्भवती महिलाहरुको प्रतिशत | ६५ | ० | ० | १२२ | ९१.४ | |
| प्रजनन् उमेरका महिलाहरुमा परिवार नियोजनको प्रयोगकर्ता दर (आधुनिक साधन) | ४ | ० | ० | ० | ० | |
| ४ पटक गर्भवती जाँच (महिना: ४,६,८,९/हप्ता: १६, २०-२४,३२ र ३६) महिलाहरुको प्रतिशत | १०० | ० | ० | ७३ | ७९.४ | |
| स्वास्थ्य संस्था प्रसुति दर | ९४ | ० | ० | ८३ | ७९ | |
| दक्ष प्रसुतिकर्मी/स्वास्थ्यकर्मीद्वारा प्रसुति गराएको प्रतिशत | ६५ | ० | ० | ७० | ७५ | |
| प्रोटोकल अनुसार ४ पटक (आ.व २०७८/७९ सम्म ३ पटक) सुत्केरी जाँच गराउने आमाहरुको प्रतिशत | ५० | ० | ० | ५३ | ४०.८ | |
| जम्मा मातृ मृत्यु संख्या | ० | ० | ० | १७ | २३१ | |
| परिवार नियोजन सेवाका नयाँ सेवाग्राही दर (प्रजनन उमेरका महिलाहरु मध्ये) | ११ | ० | ० | १९ | ११.५ | |
| औलो रोग, क्षय रोग, कुष्ठरोग र एचआईभी |
ग्राफ
तालिका
|
|||||
| औलोको स्लाइड नमुना पोजेटिभ दर | ०.१३ | ० | ० | ०.२५ | ०.१७ | |
| डेंगुको जम्मा विरामी संख्या | १ | ० | ० | ० | ० | |
| आयातित औलोरोगको प्रतिशत (नयाँ औलो रोग मध्ये | ० | ० | ० | ६३ | ८९.५ | |
| जम्मा औलो रोग मध्ये प्लाज्मोडियम फाल्सिपारमको अनुपात | २५ | ० | ० | २.१ | २२.८ | |
| नयाँ क्षयरोगी बिरामी पत्ता लागेको दर | ७७ | ० | ० | ९७ | १२९.१ | |
| क्षयरोगको उपचार सफलता दर | ९० | ० | ० | ९१ | ९१.५ | |
| कुष्ठरोगको रोग प्रकोप दर (प्रति १०००० मा) | १ | ० | ० | ०.५ | ० | |
| ए. आर. टी. उपचारमा रहेका जम्मा एच. आइ. भी. पोजेटिभको संख्या | ० | ० | ० | ६९१ | २२१५२ | |
| उपचारात्मक सेवा |
ग्राफ
तालिका
|
|||||
| ओ पि डी मा आएका बिरामी मध्ये नयाँ बिरामीको दर | ९२ | ० | ० | १०५ | ९२ | |
शीर्ष १० स्वास्थ्य अवस्थाको सूची
स्वास्थ्य सूचना व्यवस्थापन प्रणाली २०८०स्वास्थ्य क्षेत्रमा बजेट
- सशर्त स्वास्थ्यमा छुट्याएको बजेट
- समानीकरणबाट विनियोजित स्वास्थ्य बजेट
- अन्य श्रोतबाट बिनियोजित स्वास्थ्य बजेट
| बजेट | दुल्लु नगरपालिका | |||||
|---|---|---|---|---|---|---|
| २०७८/७९ | २०७९/८० | २०८०/८१ | ||||
| ग्राफ | ||||||
| पालिकाको कुल बजेट (रु ) | ९६८,३०३,२१५ | ९२८,३५६,०२७ | ||||
| स्वास्थ्य बजेट (सबै स्रोत) | ९०,१२५,००० | ७०,५६१,००० | ||||
| सशर्त स्वास्थ्यमा छुट्याएको बजेट | ७९,६१०,००० | ५४,१८३,००० | ||||
| समानीकरणबाट विनियोजित स्वास्थ्य बजेट | १०,५१५,००० | १६,३७८,००० | ||||
| अन्य श्रोतबाट बिनियोजित स्वास्थ्य बजेट | ||||||
| बजेट खर्च (%) | ९४ | ७०,५६१,००० | ||||
| तालिका | ||||||
महत्वपूर्ण सम्पर्क
Dullu Municipality
ठेगाना : दुल्लु बजार दैलेख
टेलिफोन : ९७७-८९-४११०३९
वेबसाइट : http://dullumun.gov.np/
हेल्थ असिष्टेन्ट आधारभुत स्वास्थ्य सेवा केन्द्र बाहुँनगाउँ
नाम : लक्ष्मी दहित आचार्य
सम्पर्क :
ईमेल : -

यो प्रोफाइल अमेरिकी अन्तर्राष्ट्रिय विकास नियोग (युएसएआइडी) मार्फत अमेरिकी जनताहरुको सहयोगका कारण सम्भव बनेको हो । यो प्रतिवेदन भित्रका विषयवस्तु र सामग्री स्वास्थ्यका लागि सक्षम प्रणालीका एकल जिम्मेवारी हुन् र तिनले युएसएआइडी वा अमेरिकी सरकारको विचारको प्रतिविम्बित गर्छन् भन्ने जरुरी छैन ।