संक्षिप्त परिचय गुर्भाकोट नगरपालिका
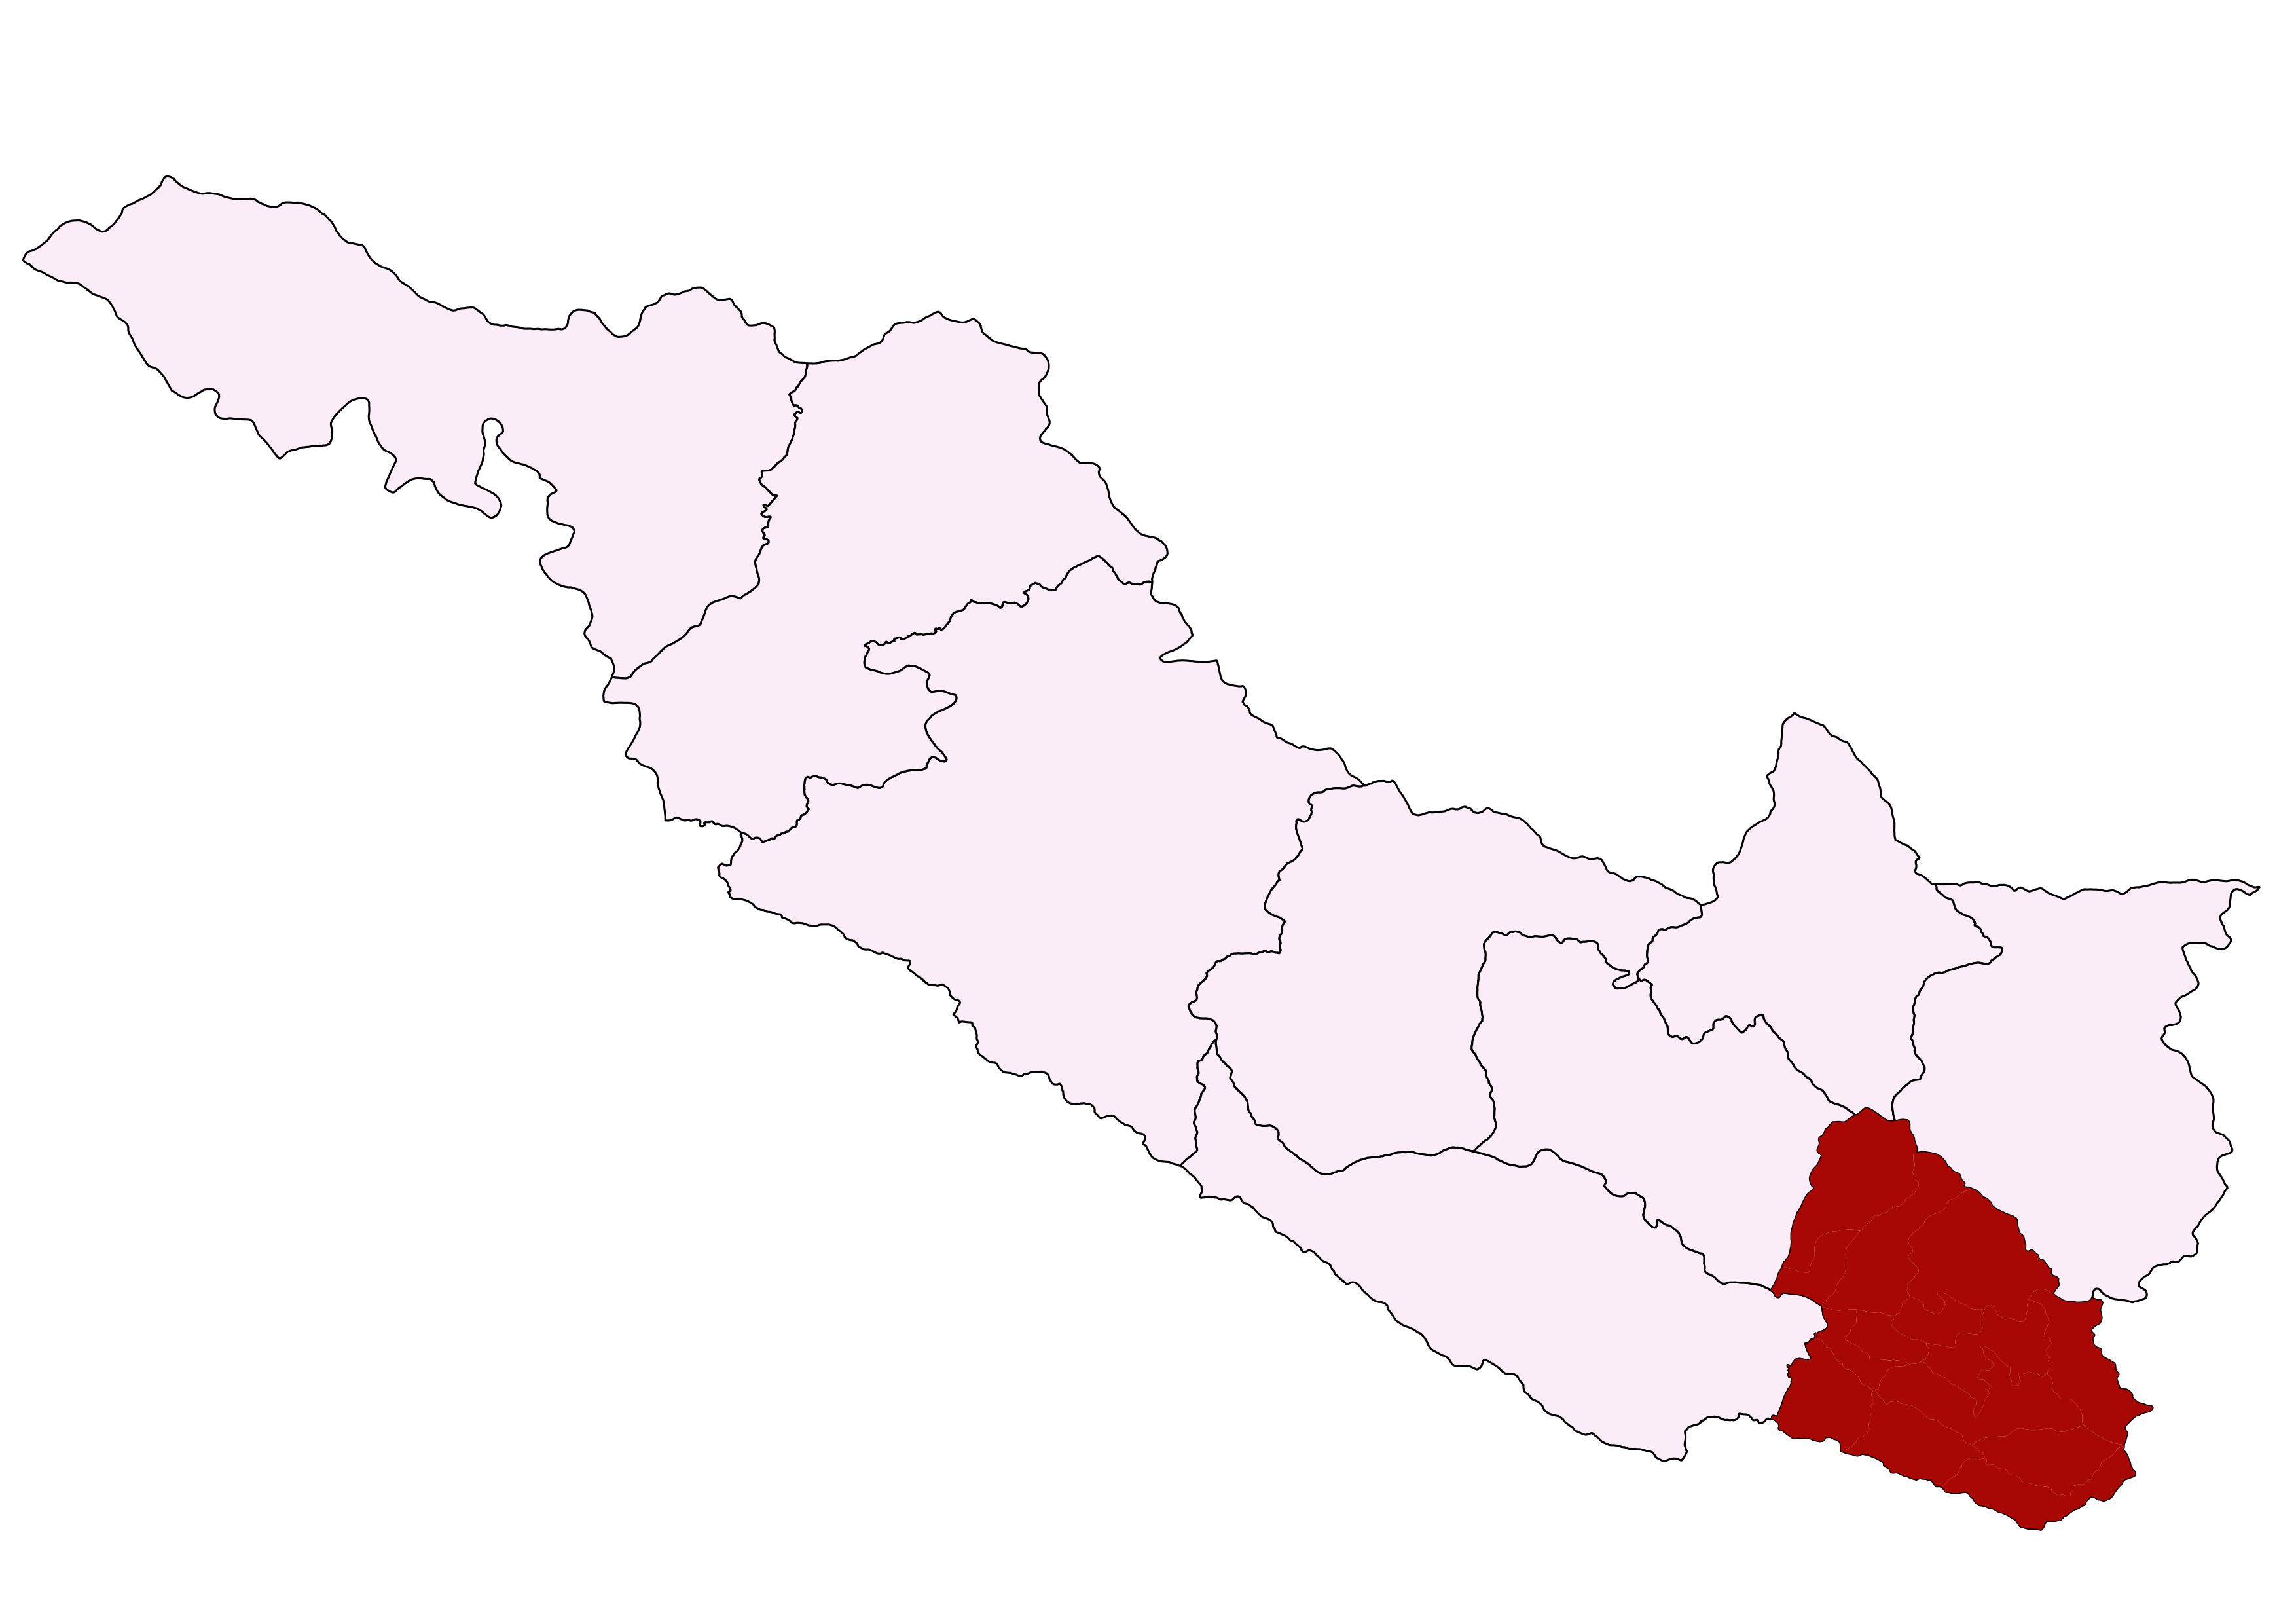
गुर्भाकोट नगरपालिका सुर्खेत जिल्ला देखि पुर्व क्षेत्रमा अवस्थित छ । साविकका दहचाैर, गुमी, घुमखहरे, मेहेलकुना, सहारे, मालारानी र धारापानी गा.वि.स. मिलि यो नगरपालिका बनेको हो । यो नगरपालिका जम्मा १४ वटा वडामा बिभाजन गरिएको छ। यस नगरपालिकाको पुर्वमा सिम्ता गाउँपालिका र सल्यान जिल्ला, पश्चिममा भेरी गंगा नगरपालिका र लेखवेशी नगरपालिका, दक्षिणमा सल्यान जिल्ला र उत्तरमा लेखवेशी नगरपालिकासंघ जोडिएको छ । यस नगरपालिकाकाे राजधानि मेहेलकुना रहेकाे छ । यस नगरपालिकाको क्षेत्रफल २२८।६० वर्ग कि.मी रहेकाे छ। यस नगरपालिकामा सवै प्रकारका जातजातीहरुकाे मिश्रित प्रकारकाे बसाेवास रहेकाे देखिन्छ । विशेष गरी ब्राहमण, क्षेत्री, मगर, राजी तथा दलितहरुकाे उच्च बसाेबास रहेकाे छ ।
जनसाङ्खिक सूचक
-
कूल जनसंख्या १
४८,५९२
/ -
१ बर्ष भन्दा मुनिको जनसंख्या १
९१२
/ -
पाँच बर्ष भन्दा मुनिको जनसंख्या १
४,२९१
/ -
किशोरावस्था (१०-१९ बर्ष) को जनसंख्या १
१०,४५०
/ -
प्रजनन उमेरका महिला (१५ -४९ बर्ष ) १
१५,५६१
/ -
अनुमानित गर्भवती महिलाहरु १
१,४६६
/ -
अनुमानित जिवित जन्मको संख्या १
९३३
/ -
परिवारमा अनुपस्थित (विदेशमा बस्ने) जनसंख्या २
४,१०३
-
मोबाइल फोन भएका घरधुरी (%) २
८,९८४
-
टेलिभिजन भएका घरधुरी (%) २
४,३७७
-
लैङ्गिक अनुपात २
९६
-
१४ बर्ष र सो भन्दा कम उमेरका जनसंख्या १
१३,५७८
/ -
६५ बर्ष र सो भन्दा माथि उमेरका जनसंख्या २
२,८७३
उमेर र लिंगको आधारमा जनसंख्या वितरण
जनगणना २०७८जातिगत आधारमा जनसंख्या वितरण
जनगणना २०७८वार्ड अनुसार जनसंख्या वितरण
जनगणना २०७८स्वास्थ्य सेवा प्रवाह गर्ने संस्थाहरु
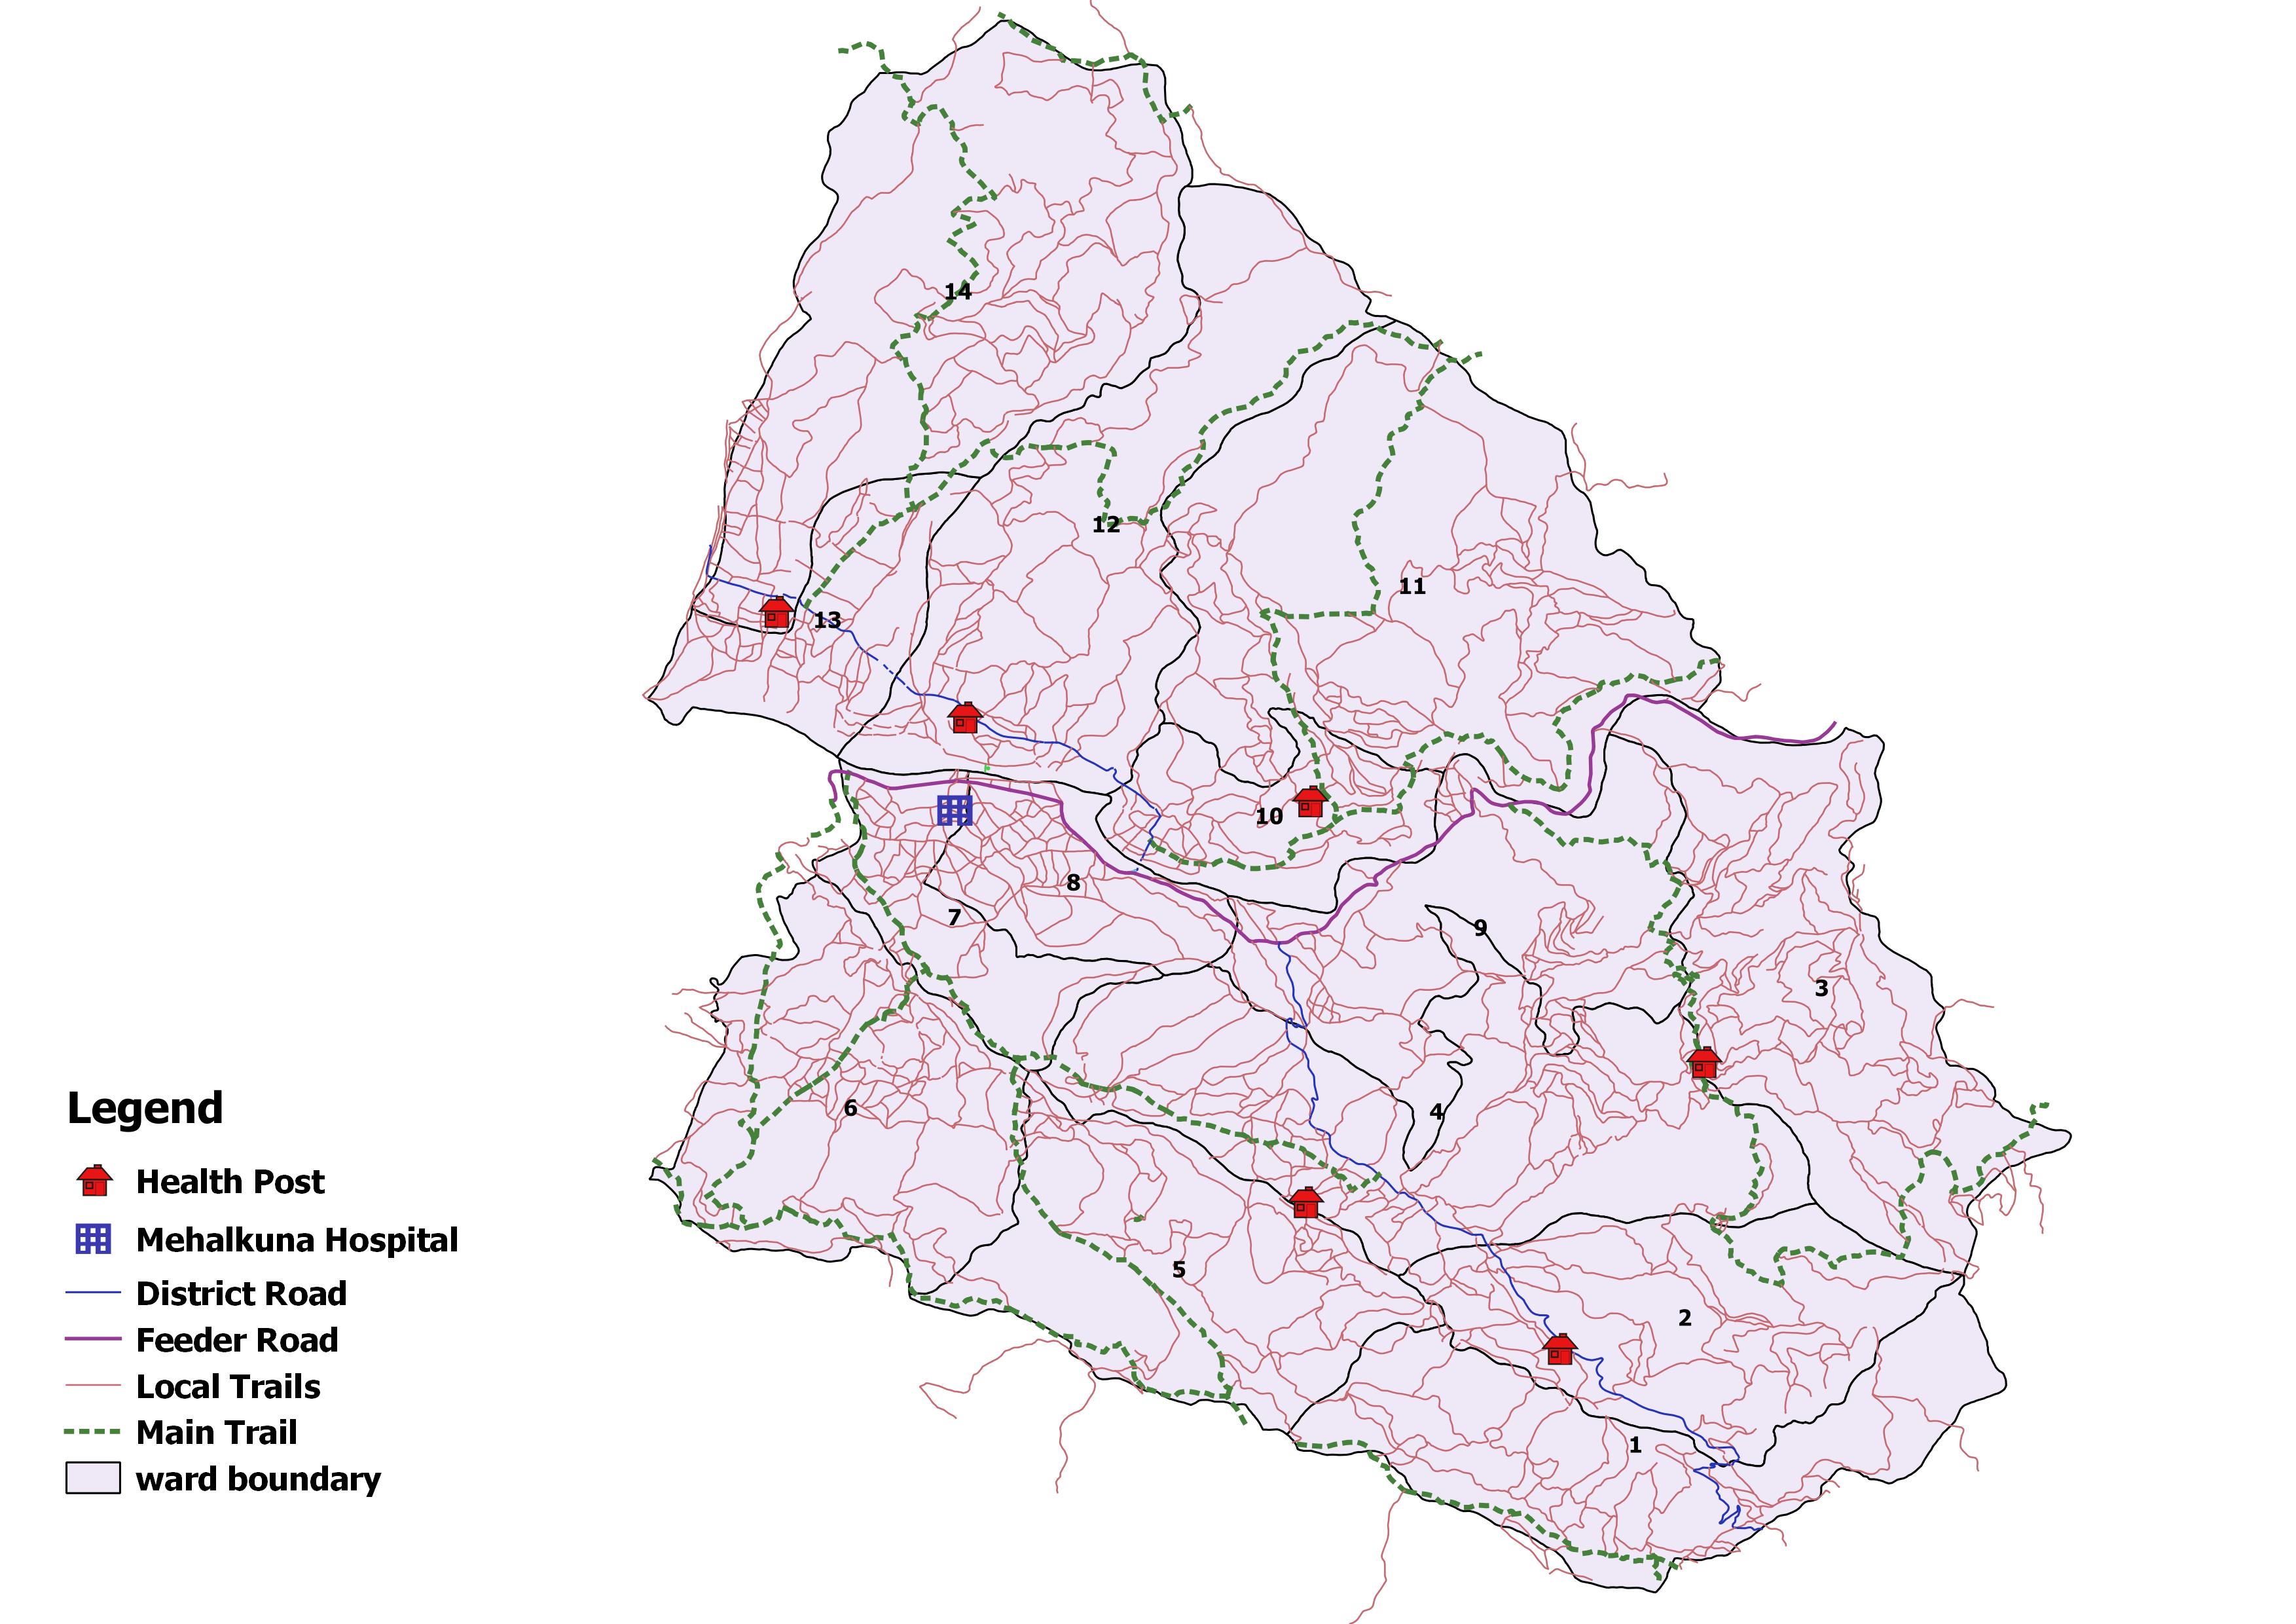
- अस्पताल १
- प्रास्वाके -
- स्वास्थ्य चौकी ६
- सामुदायिक स्वास्थ्य ईकाई -
- शहरी स्वास्थ्य केन्द्र ५
- गाउँघर क्लिनिक १५
- खोप क्लिनिक २६
- आधारभूत स्वस्थ सेवाकेन्द्र ८
- बर्थिंग सेन्टर ७
सरकारी संस्था
- अस्पताल तथा नर्सिंग होम -
- पोलिक्लिनिक २
- औषधि पसल १०
निजी (गैर-सरकारी संस्था समेत)
अन्य स्वास्थ्य केन्द्रहरु
- माइक्रोस्कोपी केन्द्र ४
- एआरटि केन्द्र १
- एचाईभी परीक्षण केन्द्र १
- क्षयरोग उपचार केन्द्र ८
- आयुर्वेद अस्पताल/केन्द्र १
- आँखा अस्पताल/केन्द्र १
अस्पताल शैयाहरू
- सार्वजनिक ५०
- निजी -
वडा अनुसार स्वास्थ्य संस्थाको जानकारी
| स्वास्थ्यसंस्थाको नाम | वार्ड न | बर्थिंग सेन्टर BEONC/CEONC | महिला स्वास्थ्य स्वयं सेवक संख्या | दक्ष प्रसुतिकर्मी संख्या | परिवार नियोजन *सेवा | स्वीकृत दरबन्दी | दरबन्दी अनुसार पदपूर्ति | करारका कर्मचारी |
|---|---|---|---|---|---|---|---|---|
| मालारानी स्वास्थ्य चौकी | २ | बर्थिंग सेन्टर | ९ | २ | ४ साधनहरू | ५ | ५ | ३ |
| धारापानी स्वास्थ्य चौकी | ३ | बर्थिंग सेन्टर | १२ | १ | ४ साधनहरू | ५ | ५ | ३ |
| शाहारे स्वास्थ्य चौकी | ४ | बर्थिंग सेन्टर | ११ | ३ | ५ साधनहरू | ५ | ५ | ४ |
| मेहेल्कुना अस्पताल | ८ | BEONC | १० | - | - | - | - | - |
| घुम्खहरे स्वास्थ्य चौकी | ११ | बर्थिंग सेन्टर | ११ | १ | ३ साधनहरू | ५ | ५ | ३ |
| दहचौर स्वास्थ्य चौकी | १२ | बर्थिंग सेन्टर | १३ | ३ | ५ साधनहरू | ५ | ५ | ५ |
| गुमी स्वास्थ्य चौकी | १३ | बर्थिङ्ग सेन्टर | १३ | ५ | ५ साधनहरू | ५ | ५ | ५ |
| राम्रीकांढा अाधारभुत स्वा. के. | १ | - | १० | ० | ३ साधनहरू | ० | ३ | ३ |
| बायांकांढा शहरी स्वास्थ्य केन्द्र | ३ | - | ० | ० | ३ साधनहरू | ० | ३ | ३ |
| टिमुरे शहरी स्वास्थ्य केन्द्र | ३ | - | ० | ० | ३ साधनहरू | ० | २ | २ |
| कोट शहरी स्वास्थ्य केन्द्र | ४ | - | ० | ० | ३ साधनहरू | ० | २ | २ |
| पोखरिपाटा अाधारभुत स्वा. के. | ५ | - | ११ | ० | ३ साधनहरू | ० | ३ | ३ |
| बडाखोली अाधारभुत स्वा. के. | ६ | - | १६ | ० | ३ साधनहरू | ० | ३ | ३ |
| कोप्ची अाधारभुत स्वा. के. | ७ | - | ९ | ० | ३ साधनहरू | ० | ३ | ३ |
| बोटेचौर अाधारभुत स्वा. के. | ९ | बर्थिंग सेन्टर | ११ | २ | ४ साधनहरू | ० | ६ | ६ |
| भेडाबारी अाधारभुत स्वा. के. | १० | - | ७ | ० | ३ साधनहरू | ० | ३ | ३ |
| आप्गैरा शहरी स्वास्थ्य केन्द्र | ११ | - | ० | ० | ३ साधनहरू | ० | २ | २ |
| पिपल टाकुरा शहरी स्वास्थ्य केन्द्र | १२ | - | ० | ० | ३ साधनहरू | ० | २ | २ |
| पन्डितकान्ला अाधारभुत स्वा. के. | १४ | - | १३ | ० | ३ साधनहरू | ० | ३ | ३ |
| नागरिक अाराेग्य केन्द्र | - | - | - | - | - | - | - | - |
| कुल कर्मचारी संख्या | १५६ | १७ | ३० | ६५ | ५८ | |||
स्वास्थ्य सेवाको लागि मानव संसाधन
- CEONC साइटहरू१
- BEONC साइटहरू७
- आइयुसीडी तथा इम्पलान्ट सेवा प्रदायक३
- एकीकृत बालरोग व्यवस्थापन (IMCI) प्रशिक्षित कर्मचारी१९
- जनसंख्या (प्रति मस्वास्वका) ३११
- जनसंख्या (प्रति स्वास्थ्यकर्मी) ७४८
- अनुमानित गर्भवति (प्रति दक्ष प्रसुतिकर्मी) ८६
- अनुमानित गर्भवति (प्रति बर्थिङ्ग सेन्टर) २०९
- जनसंख्या (प्रति स्वास्थ्य संस्था) (अस्पताल,प्रस्वाके र स्वाचौ सहित) -
- जनसंख्या (प्रति सरकारी अस्पताल) ४८५९२
- जनसंख्या (प्रति अस्पताल र नर्सिंग होम (सबै) ४८५९२
मातृशिशु बालस्वास्थ्य र परिवार नियोजन सेवा उपयोगको अवस्था
स्वास्थ्य सूचना व्यवस्थापन प्रणाली २०८०प्रमूख स्वास्थ्य सेवाहरूको उपयोगको तुलनात्मक अवस्था
| सूचक | गुर्भाकोट नगरपालिका | कर्णाली प्रदेश २०७८/७९ | राष्ट्रीय २०७८/७९ | |||
|---|---|---|---|---|---|---|
| २०७९/८० | २०७७/७८ | २०७८/७९ | ||||
| खाेप |
ग्राफ
तालिका
|
|||||
| बि.सि.जि. कभरेज | ७३.२ | ८१.८ | ८५.९ | ९२ | १०३.५ | |
| २३ महिनाभित्र पूर्ण खोप प्राप्त गरेका बालबालिका (%) | ९१.७ | ८१ | ९९ | ० | ० | |
| डि.पि.टि. - हेप बि - हिव ३ कभरेज | १००.२ | ९०.१ | ९७.१ | ९४ | ९५.२ | |
| दादुरा रूबेला १ (९-११ महिना) कभरेज | ९२.२ | ८६.१ | ९३.८ | ९५ | ९४.७ | |
| जे.इ कभरेज | ९९.८ | ८४.४ | १०२.३ | ९६ | ९५.९ | |
| टि.डी. २ र टि. डी. २+ कभरेज | ७८.७ | ६८.१ | ७८.२ | ६६ | ७१.७ | |
| पोषण |
ग्राफ
तालिका
|
|||||
| कम जन्म तौल भएका नवजात शिशुको प्रतिशत | ६.७ | ५.९ | ६.५ | ६.८ | ९.४ | |
| नयाँ तौल लिएका १ वर्ष मुनिका शिशुहरुको प्रतिशत | १३३.३ | ९४.५ | १३५.३ | १२० | १०४.१ | |
| नयाँ तौल लिएका २ वर्ष मुनिका शिशुहरु मध्ये अति जोखिम अवस्थाका बालबालिकाहरुको प्रतिशत | १.८ | १.२ | २.४ | ४.१ | ३.६ | |
| गर्भवती अवस्थामा १८० दिन आइरन चक्की प्राप्त गरेका गर्भवती महिलाहरुको प्रतिशत | ७७.८ | ५९.६ | ७८.३ | ७३ | ६० | |
| सुत्केरी अवस्थामा भिटामिन ए प्राप्त गरेका महिलाहरुको प्रतिशत | ८३.८ | ८३.२ | ९५.४ | ८८ | ७६.३ | |
| नवजात शिशु तथा बाल रोगको एकीकृत व्यस्थापन |
ग्राफ
तालिका
|
|||||
| नाभी मलम लगाएका नवजात शिशुको प्रतिशत | ९६.१ | ९७.८ | ९७.४ | ९६ | ८२.९ | |
| ब्याक्टेरियाको गम्भीर संक्रमण भएकामध्ये जेन्टामाईसिन सुईद्वारा पूर्ण उपचार पाएको प्रतिशत | ७५ | २५ | २५ | ७५ | ४७.४ | |
| नयाँ निमोनिया बिरामीको दर (प्रति हजार पाँच वर्षमुनिका बालबालिकाहरुमा) | ३५.८ | २६.७ | ४६.३ | ११३ | ३६.८ | |
| नयाँ एआरआई (स्वाशप्रश्वाका) बिरामी मध्ये कडा निमोनिया भएका बिरामीको प्रतिशत | ० | ० | ०.०८ | ०.४१ | ०.१८ | |
| नयाँ झाडापखालाका बिरामीको दर (प्रति हजार पाँच वर्ष मुनिका बालबालिकाहरुमा) | १८४.३ | १६४.९ | १९०.१ | ५७९ | ३५२.४ | |
| ५ वर्ष मुनिका झाडापखालाका बिरामी मध्ये जिंक र पुनर्जलीय झोलबाट उपचार गरेको प्रतिशत | ९६.२ | ९६.५ | ९५.६ | ९५ | ९४.५ | |
| जम्मा नवजात शिशु मृत्यु संख्या | १ | ० | ० | १९९ | १९१४ | |
| सुरक्षित मातृत्व तथा परिवार नियोजन |
ग्राफ
तालिका
|
|||||
| प्परोटोकल अनुसार पहिलो पटक गर्भवती जाँच गराएका गर्भवती महिलाहरुको प्रतिशत | ८९.१ | ७९ | १०५.४ | १२२ | ९१.४ | |
| प्रजनन् उमेरका महिलाहरुमा परिवार नियोजनको प्रयोगकर्ता दर (आधुनिक साधन) | १६.७ | १७ | १६.७ | ० | ० | |
| ४ पटक गर्भवती जाँच (महिना: ४,६,८,९/हप्ता: १६, २०-२४,३२ र ३६) महिलाहरुको प्रतिशत | ११३.७ | ६०.७ | ७९.३ | ७३ | ७९.४ | |
| स्वास्थ्य संस्था प्रसुति दर | ८३.९ | ६८.७ | ६३.७ | ८३ | ७९ | |
| दक्ष प्रसुतिकर्मी/स्वास्थ्यकर्मीद्वारा प्रसुति गराएको प्रतिशत | ६९.३ | ६८.७ | ६३.७ | ७० | ७५ | |
| प्रोटोकल अनुसार ४ पटक (आ.व २०७८/७९ सम्म ३ पटक) सुत्केरी जाँच गराउने आमाहरुको प्रतिशत | ४१ | २५.४ | ३२.२ | ५३ | ४०.८ | |
| जम्मा मातृ मृत्यु संख्या | ० | ० | ० | १७ | २३१ | |
| परिवार नियोजन सेवाका नयाँ सेवाग्राही दर (प्रजनन उमेरका महिलाहरु मध्ये) | १०.९ | १४.७ | ११.६ | १९ | ११.५ | |
| औलो रोग, क्षय रोग, कुष्ठरोग र एचआईभी |
ग्राफ
तालिका
|
|||||
| औलोको स्लाइड नमुना पोजेटिभ दर | ०.०८ | ० | ०.१३ | ०.२५ | ०.१७ | |
| डेंगुको जम्मा विरामी संख्या | ० | ० | ० | ० | ० | |
| आयातित औलोरोगको प्रतिशत (नयाँ औलो रोग मध्ये | ७५ | ० | १०० | ६३ | ८९.५ | |
| जम्मा औलो रोग मध्ये प्लाज्मोडियम फाल्सिपारमको अनुपात | ० | ० | ० | २.१ | २२.८ | |
| नयाँ क्षयरोगी बिरामी पत्ता लागेको दर | १२९.३ | ८०.३ | १५५.३ | ९७ | १२९.१ | |
| क्षयरोगको उपचार सफलता दर | ९३.५ | ८०.३ | १५५.३ | ९१ | ९१.५ | |
| कुष्ठरोगको रोग प्रकोप दर (प्रति १०००० मा) | ०.२ | ० | ०.२ | ०.५ | ० | |
| ए. आर. टी. उपचारमा रहेका जम्मा एच. आइ. भी. पोजेटिभको संख्या | ० | ० | ० | ६९१ | २२१५२ | |
| उपचारात्मक सेवा |
ग्राफ
तालिका
|
|||||
| ओ पि डी मा आएका बिरामी मध्ये नयाँ बिरामीको दर | ७५ | ८१ | ८४.६ | १०५ | ९२ | |
शीर्ष १० स्वास्थ्य अवस्थाको सूची
स्वास्थ्य सूचना व्यवस्थापन प्रणाली २०७९-०८०स्वास्थ्य क्षेत्रमा बजेट
- सशर्त स्वास्थ्यमा छुट्याएको बजेट
- समानीकरणबाट विनियोजित स्वास्थ्य बजेट
- अन्य श्रोतबाट बिनियोजित स्वास्थ्य बजेट
| बजेट | गुर्भाकोट नगरपालिका | |||||
|---|---|---|---|---|---|---|
| २०७८/७९ | २०८०/८१ | २०७९/८० | ||||
| ग्राफ | ||||||
| पालिकाको कुल बजेट (रु ) | ७९,२९८,००० | १,००४,१५०,७५६ | ७५३,३३२,००० | |||
| स्वास्थ्य बजेट (सबै स्रोत) | ७९,२९८,००० | ६०,०००,००० | ४४,७००,००० | |||
| सशर्त स्वास्थ्यमा छुट्याएको बजेट | ६३,२२३,००० | ४०,०००,००० | ३९,७००,००० | |||
| समानीकरणबाट विनियोजित स्वास्थ्य बजेट | १६,०७५,००० | १९,८००,००० | ४,७००,००० | |||
| अन्य श्रोतबाट बिनियोजित स्वास्थ्य बजेट | - | २००,००० | ३००,००० | |||
| बजेट खर्च (%) | ९४ | - | ९० | |||
| तालिका | ||||||
महत्वपूर्ण सम्पर्क
Gurbhakot Municipality
ठेगाना : गुर्भाकोट नगरपालिका
टेलिफोन : ०८३-४१००७२
वेबसाइट : http://gurbhakotmun.gov.np
सूचना प्रविधि अधिकृत
नाम : नरेन्द्र कुमार विक
सम्पर्क : ९८४८२४१७५८

यो प्रोफाइल अमेरिकी अन्तर्राष्ट्रिय विकास नियोग (युएसएआइडी) मार्फत अमेरिकी जनताहरुको सहयोगका कारण सम्भव बनेको हो । यो प्रतिवेदन भित्रका विषयवस्तु र सामग्री स्वास्थ्यका लागि सक्षम प्रणालीका एकल जिम्मेवारी हुन् र तिनले युएसएआइडी वा अमेरिकी सरकारको विचारको प्रतिविम्बित गर्छन् भन्ने जरुरी छैन ।