संक्षिप्त परिचय हिमा गाउँपालिका
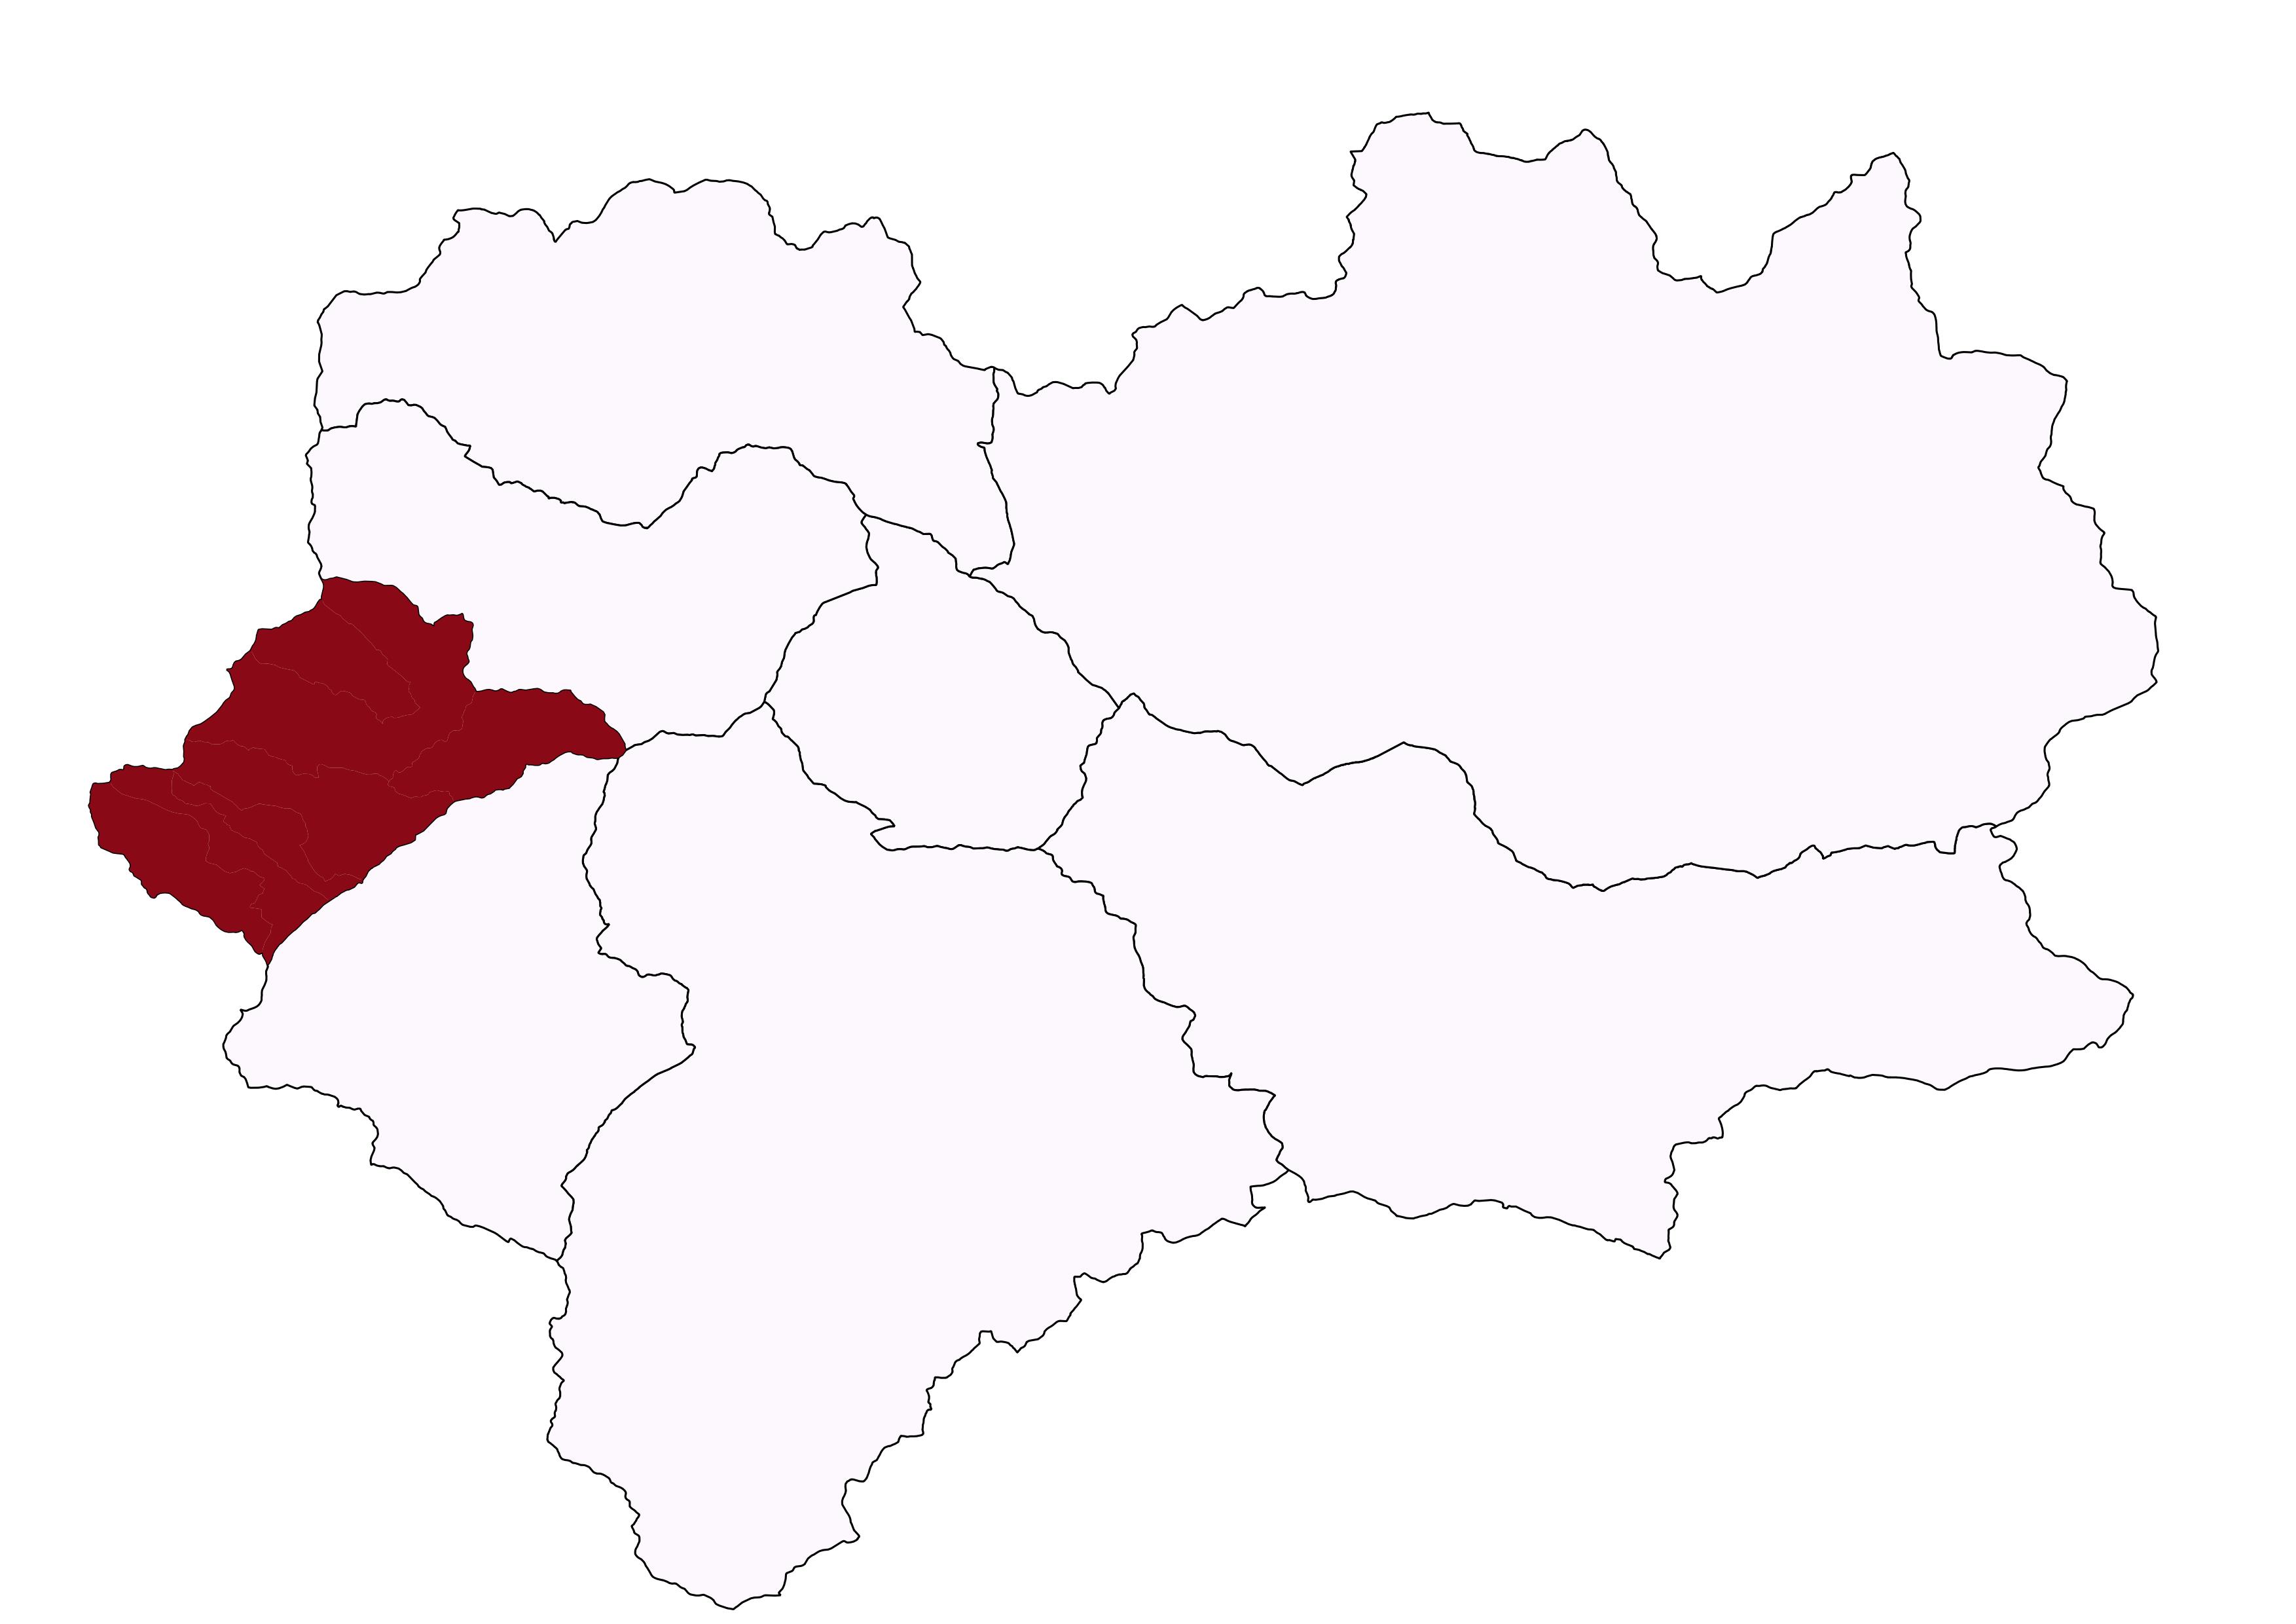
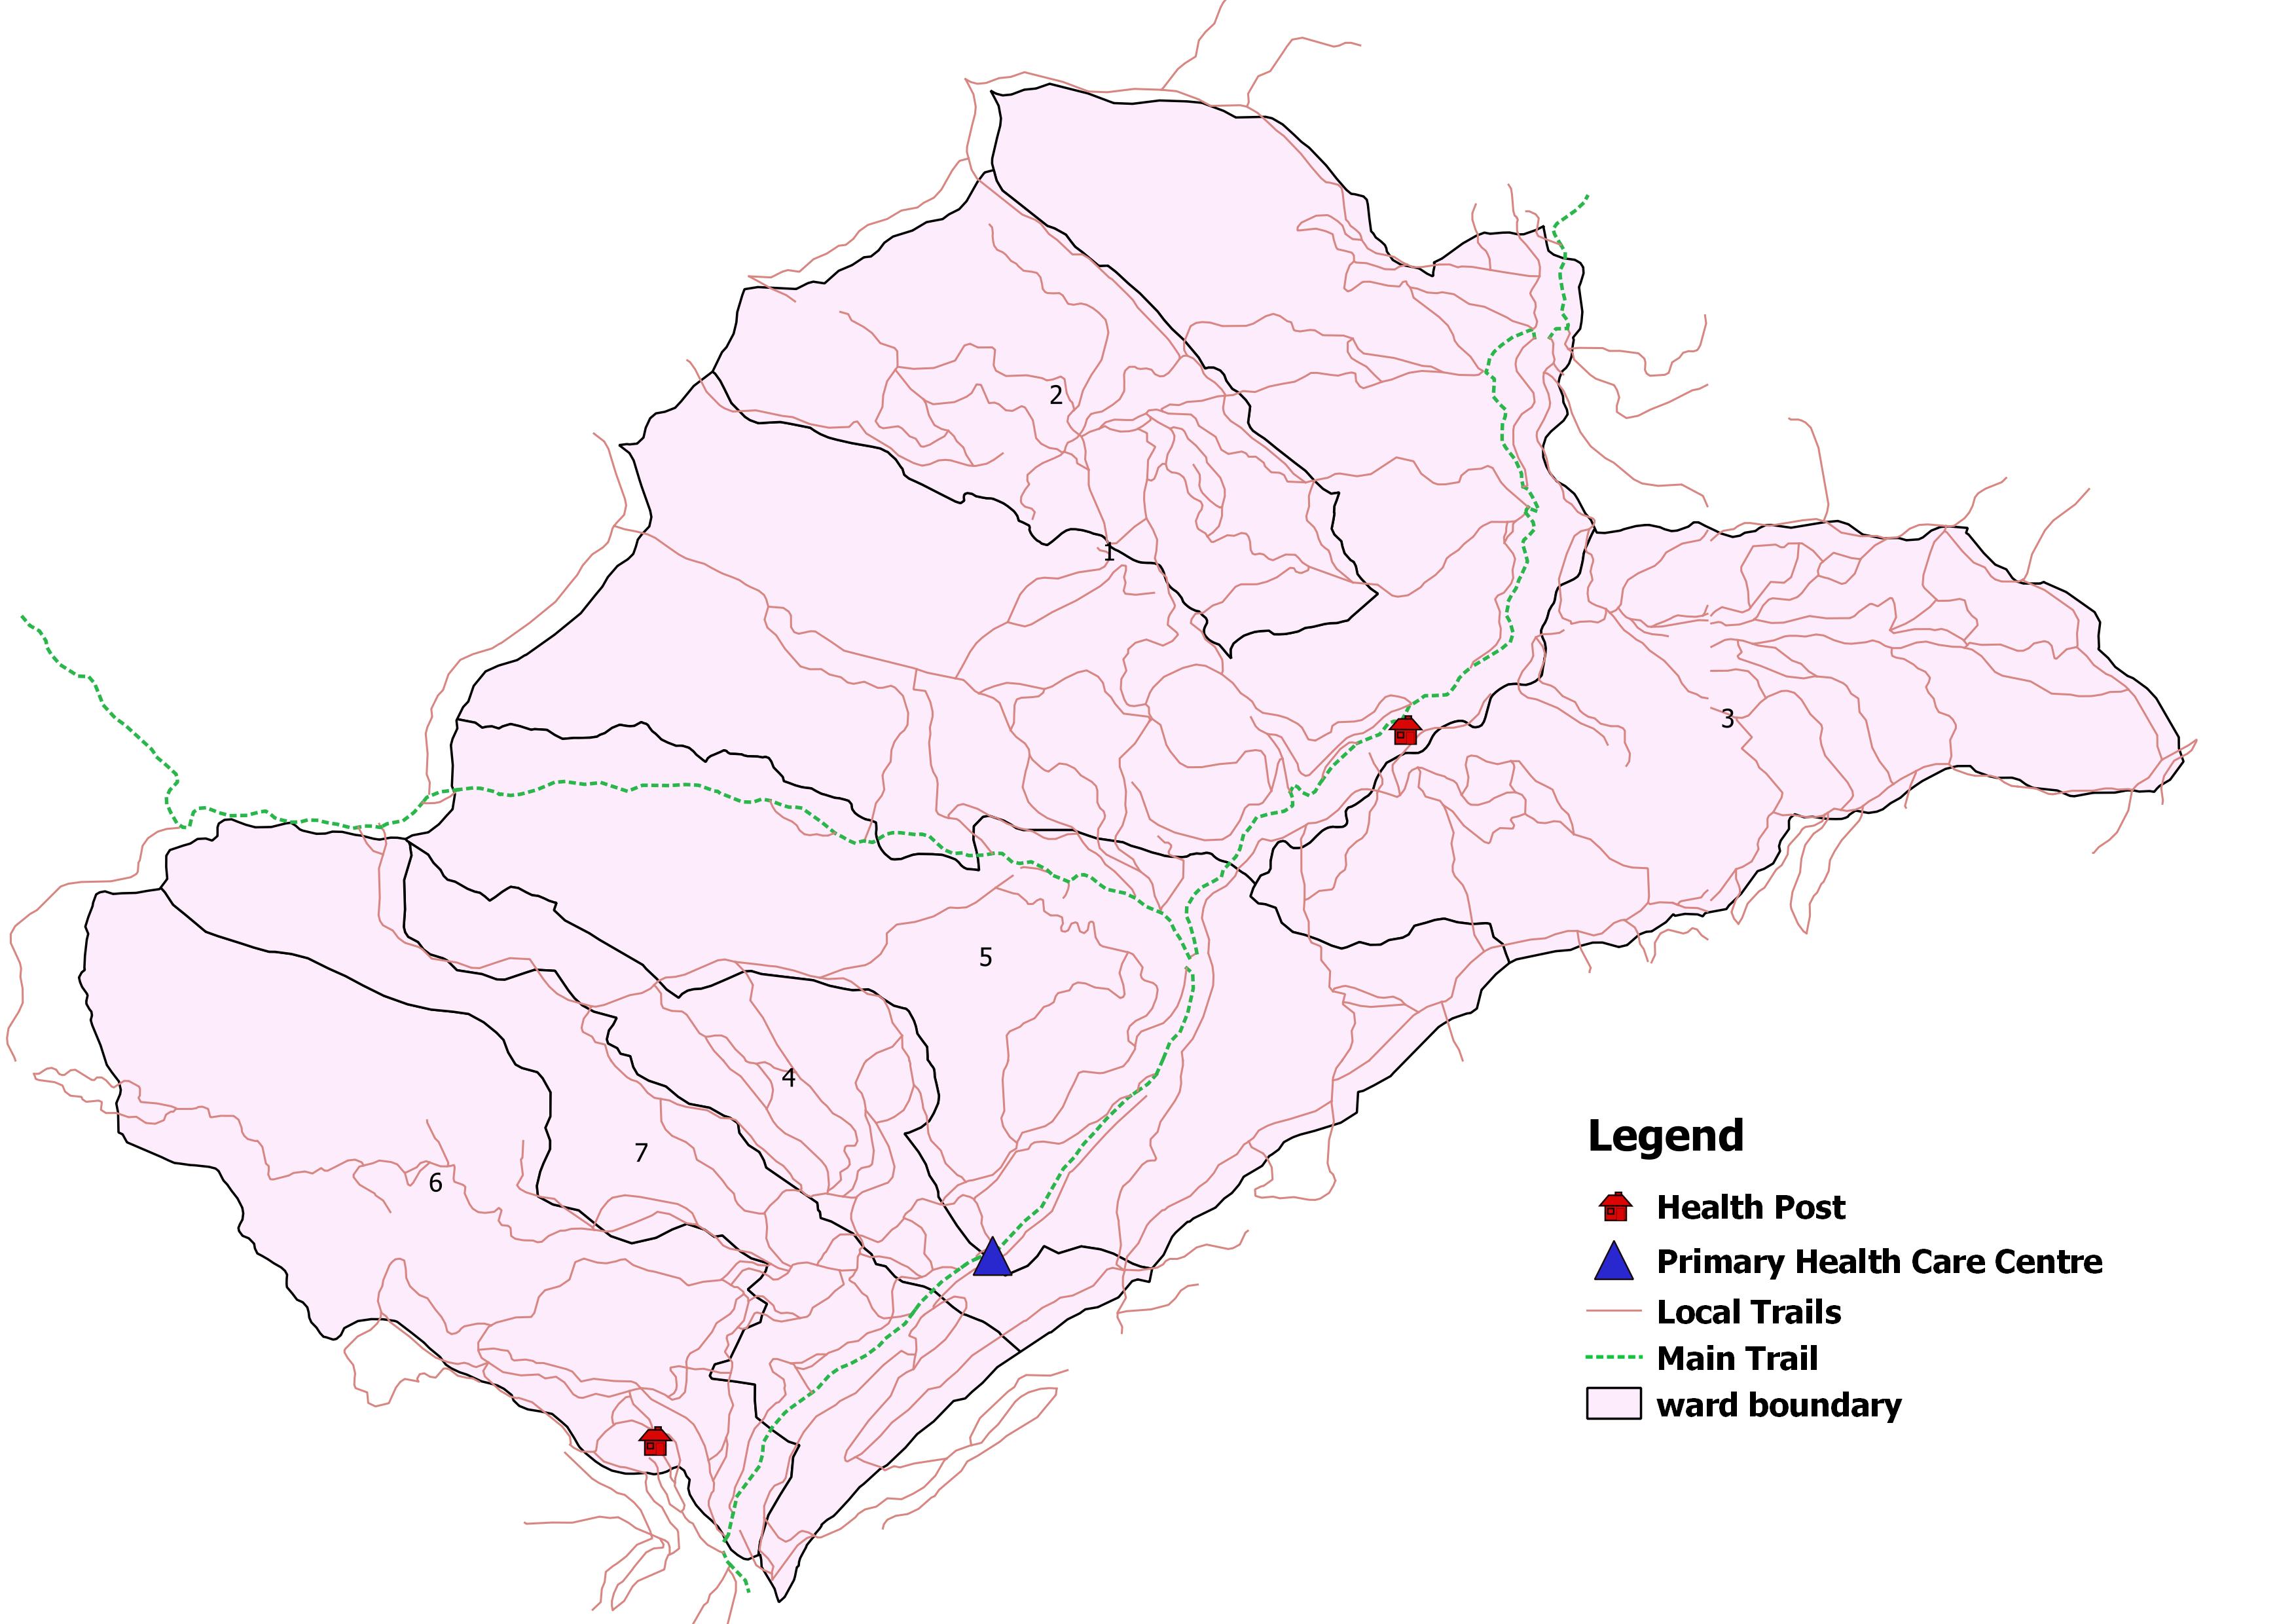
हिमा गाउँपालिका नेपालको संविधानको धारा २९५ उपधारा ३ बमोजिम कायम भएका गाउँपालिका, नगरपालिकाहरु मध्ये एक स्थानीय तह हो। नेपालको कर्णाली प्रदेश जुम्ला जिल्लामा पर्ने हिमा गाउँपालिकामा साविकका कालिकाखेतु, बड्की र महाबैपात्राखोला गरी ३ गा.वि.स.हरु समावेश भएका छन्। १३२.३२ वर्ग कि.मि. क्षेत्रफलमा रहेको यस हिमा गाउँपालिकाको जनघनत्व 83/km2 (210/sq mi) रहेको छ। यस गाउँपालिकाको पूर्वमा तिला गाउँपालिका, पश्चिममा कालिकोट जिल्ला, उत्तरमा सिंजा गाउँपालिका तथा दक्षिणमा कालिकोट जिल्ला रहेका छन्। ७ वटा वडा कार्यालयहरु रहेको यस हिमा गाउँपालिकाको अस्थाई कार्यालय कालिकाखेतुमा तोकिएको छ।
जनसाङ्खिक सूचक
-
कूल जनसंख्या १
१२,८४१
/ -
१ बर्ष भन्दा मुनिको जनसंख्या १
३२९
/ -
पाँच बर्ष भन्दा मुनिको जनसंख्या १
१,६७२
/ -
किशोरावस्था (१०-१९ बर्ष) को जनसंख्या १
२,८९५
/ -
प्रजनन उमेरका महिला (१५ -४९ बर्ष ) १
३,१६५
/ -
अनुमानित गर्भवती महिलाहरु १
३८७
/ -
अनुमानित जिवित जन्मको संख्या १
३०९
/ -
परिवारमा अनुपस्थित (विदेशमा बस्ने) जनसंख्या २
१८०
-
मोबाइल फोन भएका घरधुरी (%) २
३०
-
टेलिभिजन भएका घरधुरी (%) २
१
-
लैङ्गिक अनुपात २
९८
-
१४ बर्ष र सो भन्दा कम उमेरका जनसंख्या २
४,७७५
-
६५ बर्ष र सो भन्दा माथि उमेरका जनसंख्या २
२९४
उमेर र लिंगको आधारमा जनसंख्या वितरण
जनगणना २०६८जातिगत आधारमा जनसंख्या वितरण
जनगणना २०६८वार्ड अनुसार जनसंख्या वितरण
जनगणना २०६८स्वास्थ्य सेवा प्रवाह गर्ने संस्थाहरु
- अस्पताल -
- प्रास्वाके १
- स्वास्थ्य चौकी २
- शहरी स्वास्थ्य केन्द्र -
- गाउँघर क्लिनिक ११
- खोप क्लिनिक ११
- आधारभूत स्वस्थ सेवाकेन्द्र ३
- बर्थिंग सेन्टर ३
सरकारी संस्था
- अस्पताल तथा नर्सिंग होम -
- पोलिक्लिनिक -
- औषधि पसल २
निजी (गैर-सरकारी संस्था समेत)
अन्य स्वास्थ्य केन्द्रहरु
- माइक्रोस्कोपी केन्द्र १
- एआरटि केन्द्र -
- एचाईभी परीक्षण केन्द्र -
- क्षयरोग उपचार केन्द्र ३
- आयुर्वेद अस्पताल/केन्द्र १
- आँखा अस्पताल/केन्द्र -
अस्पताल शैयाहरू
- सार्वजनिक ३
- निजी -
थप सेवाहरू
- समुदाय स्वास्थ्य एकाई १
वडा अनुसार स्वास्थ्य संस्थाको जानकारी
| स्वास्थ्यसंस्थाको नाम | वार्ड न | बर्थिंग सेन्टर BEONC/CEONC | महिला स्वास्थ्य स्वयं सेवक संख्या | दक्ष प्रसुतिकर्मी संख्या | परिवार नियोजन *सेवा | स्वीकृत दरबन्दी | दरबन्दी अनुसार पदपूर्ति | करारका कर्मचारी |
|---|---|---|---|---|---|---|---|---|
| कलिकाखेतु प्राथमिक स्वास्थ्य केन्द्र | ५ | बर्थिंग सेन्टर | १५ | ३ | ५ साधनहरू | १० | ५ | ५ |
| बड्की स्वास्थ्य चौकी | १ | बर्थिंग सेन्टर | २१ | १ | ४ साधनहरू | ५ | ५ | ० |
| महाबैपात्राखोला स्वास्थ्य चौकी | ६ | बर्थिंग सेन्टर | १४ | २ | ४ साधनहरू | ५ | ५ | १ |
| ओदि आधारभुत स्वास्थ्य केन्द्र | २ | - | ० | ० | ३ साधनहरू | ० | ० | २ |
| मोफ्ला आधारभुत स्वास्थ्य केन्द्र | ३ | - | ० | ० | ३ साधनहरू | ० | ० | १ |
| तलिकुडू आधारभुत स्वास्थ्य केन्द्र | ४ | - | ० | ० | ३ साधनहरू | ० | ० | १ |
| बाजगाड समुदाय स्वास्थ्य एकाई | ५ | - | ० | ० | ३ साधनहरू | ० | ० | २ |
| कुल कर्मचारी संख्या | ५० | ६ | २० | १५ | १२ | |||
स्वास्थ्य सेवाको लागि मानव संसाधन
- CEONC साइटहरू-
- BEONC साइटहरू१
- आइयुसीडी तथा इम्पलान्ट सेवा प्रदायक४
- एकीकृत बालरोग व्यवस्थापन (IMCI) प्रशिक्षित कर्मचारी९
- जनसंख्या (प्रति मस्वास्वका) २५७
- जनसंख्या (प्रति स्वास्थ्यकर्मी) ८५६
- अनुमानित गर्भवति (प्रति दक्ष प्रसुतिकर्मी) ६५
- अनुमानित गर्भवति (प्रति बर्थिङ्ग सेन्टर) -
- जनसंख्या (प्रति स्वास्थ्य संस्था) (अस्पताल,प्रस्वाके र स्वाचौ सहित) ४२८०
- जनसंख्या (प्रति सरकारी अस्पताल) -
- जनसंख्या (प्रति अस्पताल र नर्सिंग होम (सबै) -
मातृशिशु बालस्वास्थ्य र परिवार नियोजन सेवा उपयोगको अवस्था
स्वास्थ्य सूचना व्यवस्थापन प्रणाली २०७८प्रमूख स्वास्थ्य सेवाहरूको उपयोगको तुलनात्मक अवस्था
| सूचक | हिमा गाउँपालिका | कर्णाली प्रदेश २०७८/७९ | राष्ट्रीय २०७८/७९ | |||
|---|---|---|---|---|---|---|
| २०७६/७७ | २०७७/७८ | २०७८/७९ | ||||
| खाेप |
ग्राफ
तालिका
|
|||||
| बि.सि.जि. कभरेज | १०२.१ | १३२.३ | ८४ | ९२ | १०३.५ | |
| २३ महिनाभित्र पूर्ण खोप प्राप्त गरेका बालबालिका (%) | ० | ० | ० | ० | ० | |
| डि.पि.टि. - हेप बि - हिव ३ कभरेज | ९७ | ११८.३ | ९० | ९४ | ९५.२ | |
| दादुरा रूबेला १ (९-११ महिना) कभरेज | ९८.३ | १०२.६ | ९९.१ | ९५ | ९४.७ | |
| जे.इ कभरेज | ६९.४ | ८९.७ | ९८.८ | ९६ | ९५.९ | |
| टि.डी. २ र टि. डी. २+ कभरेज | ६९.७ | ९७.५ | ६१.८ | ६६ | ७१.७ | |
| पोषण |
ग्राफ
तालिका
|
|||||
| कम जन्म तौल भएका नवजात शिशुको प्रतिशत | २.९ | ३.७ | ६.८ | ६.८ | ९.४ | |
| नयाँ तौल लिएका १ वर्ष मुनिका शिशुहरुको प्रतिशत | १०७.२ | १२९.८ | ० | १२० | १०४.१ | |
| नयाँ तौल लिएका २ वर्ष मुनिका शिशुहरु मध्ये अति जोखिम अवस्थाका बालबालिकाहरुको प्रतिशत | ४.६ | १.८ | ० | ४.१ | ३.६ | |
| गर्भवती अवस्थामा १८० दिन आइरन चक्की प्राप्त गरेका गर्भवती महिलाहरुको प्रतिशत | ३६.२ | ७६.४ | ४१.७ | ७३ | ६० | |
| सुत्केरी अवस्थामा भिटामिन ए प्राप्त गरेका महिलाहरुको प्रतिशत | ८९.३ | ११४.५ | ८७.१ | ८८ | ७६.३ | |
| नवजात शिशु तथा बाल रोगको एकीकृत व्यस्थापन |
ग्राफ
तालिका
|
|||||
| नाभी मलम लगाएका नवजात शिशुको प्रतिशत | ५५.१ | ९५.३ | ९८.९ | ९६ | ८२.९ | |
| ब्याक्टेरियाको गम्भीर संक्रमण भएकामध्ये जेन्टामाईसिन सुईद्वारा पूर्ण उपचार पाएको प्रतिशत | ५० | १०० | ९९.७ | ७५ | ४७.४ | |
| नयाँ निमोनिया बिरामीको दर (प्रति हजार पाँच वर्षमुनिका बालबालिकाहरुमा) | २४५ | १५९.६ | १६३.३ | ११३ | ३६.८ | |
| नयाँ एआरआई (स्वाशप्रश्वाका) बिरामी मध्ये कडा निमोनिया भएका बिरामीको प्रतिशत | ०.१९ | ०.२६ | ०.३६ | ०.४१ | ०.१८ | |
| नयाँ झाडापखालाका बिरामीको दर (प्रति हजार पाँच वर्ष मुनिका बालबालिकाहरुमा) | ७०२.१ | ८५८.९ | ६५६.१ | ५७९ | ३५२.४ | |
| ५ वर्ष मुनिका झाडापखालाका बिरामी मध्ये जिंक र पुनर्जलीय झोलबाट उपचार गरेको प्रतिशत | ९८.४ | ८०.८ | ९९.६ | ९५ | ९४.५ | |
| जम्मा नवजात शिशु मृत्यु संख्या | ० | २ | २ | १९९ | १९१४ | |
| सुरक्षित मातृत्व तथा परिवार नियोजन |
ग्राफ
तालिका
|
|||||
| प्परोटोकल अनुसार पहिलो पटक गर्भवती जाँच गराएका गर्भवती महिलाहरुको प्रतिशत | ७६.१ | १२०.२ | ० | १२२ | ९१.४ | |
| प्रजनन् उमेरका महिलाहरुमा परिवार नियोजनको प्रयोगकर्ता दर (आधुनिक साधन) | ० | ० | ० | ० | ० | |
| ४ पटक गर्भवती जाँच (महिना: ४,६,८,९/हप्ता: १६, २०-२४,३२ र ३६) महिलाहरुको प्रतिशत | ३७.४ | ७६ | ४१.७ | ७३ | ७९.४ | |
| स्वास्थ्य संस्था प्रसुति दर | ५७.६ | ७१.९ | ५७.३ | ८३ | ७९ | |
| दक्ष प्रसुतिकर्मी/स्वास्थ्यकर्मीद्वारा प्रसुति गराएको प्रतिशत | ४९.८ | ७०.७ | ३४.३ | ७० | ७५ | |
| प्रोटोकल अनुसार ४ पटक (आ.व २०७८/७९ सम्म ३ पटक) सुत्केरी जाँच गराउने आमाहरुको प्रतिशत | २९.६ | ६०.७ | ५५.७ | ५३ | ४०.८ | |
| जम्मा मातृ मृत्यु संख्या | ० | ० | ० | १७ | २३१ | |
| परिवार नियोजन सेवाका नयाँ सेवाग्राही दर (प्रजनन उमेरका महिलाहरु मध्ये) | १९.९ | २५.६ | १९.६ | १९ | ११.५ | |
| औलो रोग, क्षय रोग, कुष्ठरोग र एचआईभी |
ग्राफ
तालिका
|
|||||
| औलोको स्लाइड नमुना पोजेटिभ दर | ० | ० | ० | ०.२५ | ०.१७ | |
| डेंगुको जम्मा विरामी संख्या | ० | ० | ० | ० | ० | |
| आयातित औलोरोगको प्रतिशत (नयाँ औलो रोग मध्ये | ० | ० | ० | ६३ | ८९.५ | |
| जम्मा औलो रोग मध्ये प्लाज्मोडियम फाल्सिपारमको अनुपात | ० | ० | ० | २.१ | २२.८ | |
| नयाँ क्षयरोगी बिरामी पत्ता लागेको दर | ११७.७ | ६६.३ | ५४.५ | ९७ | १२९.१ | |
| क्षयरोगको उपचार सफलता दर | १०० | १०० | ८८.९ | ९१ | ९१.५ | |
| कुष्ठरोगको रोग प्रकोप दर (प्रति १०००० मा) | ०.८४ | ० | ०.८४ | ०.५ | ० | |
| ए. आर. टी. उपचारमा रहेका जम्मा एच. आइ. भी. पोजेटिभको संख्या | ० | ० | ० | ६९१ | २२१५२ | |
| उपचारात्मक सेवा |
ग्राफ
तालिका
|
|||||
| ओ पि डी मा आएका बिरामी मध्ये नयाँ बिरामीको दर | १०३.३ | १००.३ | ९१ | १०५ | ९२ | |
शीर्ष १० स्वास्थ्य अवस्थाको सूची
स्वास्थ्य सूचना व्यवस्थापन प्रणाली २०७८७९स्वास्थ्य क्षेत्रमा बजेट
- सशर्त स्वास्थ्यमा छुट्याएको बजेट
- समानीकरणबाट विनियोजित स्वास्थ्य बजेट
- अन्य श्रोतबाट बिनियोजित स्वास्थ्य बजेट
| बजेट | हिमा गाउँपालिका | |||||
|---|---|---|---|---|---|---|
| २०७५/७६ | २०७६/७७ | २०७७/७८ | ||||
| ग्राफ | ||||||
| पालिकाको कुल बजेट (रु ) | १६५,९५५,००० | २६१,९६८,१३६ | ३६१,६०५,००० | |||
| स्वास्थ्य बजेट (सबै स्रोत) | १४,८२९,००० | २०,५७३,००० | २३,९३९,००० | |||
| सशर्त स्वास्थ्यमा छुट्याएको बजेट | १३,३२९,००० | १७,२७३,००० | २०,९३९,००० | |||
| समानीकरणबाट विनियोजित स्वास्थ्य बजेट | १,५००,००० | ३,३००,००० | ३,०००,००० | |||
| अन्य श्रोतबाट बिनियोजित स्वास्थ्य बजेट | - | - | - | |||
| बजेट खर्च (%) | १०० | ९६ | ९९ | |||
| तालिका | ||||||
महत्वपूर्ण सम्पर्क

यो प्रोफाइल अमेरिकी अन्तर्राष्ट्रिय विकास नियोग (युएसएआइडी) मार्फत अमेरिकी जनताहरुको सहयोगका कारण सम्भव बनेको हो । यो प्रतिवेदन भित्रका विषयवस्तु र सामग्री स्वास्थ्यका लागि सक्षम प्रणालीका एकल जिम्मेवारी हुन् र तिनले युएसएआइडी वा अमेरिकी सरकारको विचारको प्रतिविम्बित गर्छन् भन्ने जरुरी छैन ।