संक्षिप्त परिचय कनका सुन्दरी गाउँपालिका

नेपालको कर्णाली प्रदेश जुम्ला जिल्लामा अवस्थित कनाकसुन्दारी गाउँपालिका नेपालको संविधानको धारा २९५ उपधारा ३ बमोजिम कायम भएका गाउँपालिका, नगरपालिकाहरु मध्ये एक स्थानीय तह हो । गाउँपालिकामा साविकका बुम्रमाडीचौर, मालिकाबोता, कनकासुन्दरी र बिराट गरी ४ गा.वि.स.हरु समावेश भएका छन् । २२५.३९ वर्ग कि.मि. क्षेत्रफलमा रहेको यस कनाकसुन्दारी गाउँपालिकाको पूर्वमा पातारासी गाउँपालिका, पश्चिममा कालिकोट जिल्ला, उत्तरमा मुगु जिल्ला तथा दक्षिणमा सिँजा गाउँपालिका रहेका छन्। ८ वटा वडा कार्यालयहरु रहेको यस कनकासुन्दरी गाउँपालिकाको कार्यालय विराटमा रहेको छ ।
जनसाङ्खिक सूचक
-
कूल जनसंख्या १
१३,७२४
/ -
१ बर्ष भन्दा मुनिको जनसंख्या १
३०९
/ -
पाँच बर्ष भन्दा मुनिको जनसंख्या १
१,५६२
/ -
किशोरावस्था (१०-१९ बर्ष) को जनसंख्या १
२,७७१
/ -
प्रजनन उमेरका महिला (१५ -४९ बर्ष ) १
३,५५७
/ -
अनुमानित गर्भवती महिलाहरु १
३६७
/ -
अनुमानित जिवित जन्मको संख्या १
२९०
/ -
परिवारमा अनुपस्थित (विदेशमा बस्ने) जनसंख्या २
१०९
-
मोबाइल फोन भएका घरधुरी (%) २
९
-
लैङ्गिक अनुपात २
९९
-
१४ बर्ष र सो भन्दा कम उमेरका जनसंख्या १
४,९५७
-
६५ बर्ष र सो भन्दा माथि उमेरका जनसंख्या २
३८१
उमेर र लिंगको आधारमा जनसंख्या वितरण
जनगणना २०६८जातिगत आधारमा जनसंख्या वितरण
जनगणना २०६८वार्ड अनुसार जनसंख्या वितरण
जनगणना २०६८स्वास्थ्य सेवा प्रवाह गर्ने संस्थाहरु
- अस्पताल -
- प्रास्वाके -
- स्वास्थ्य चौकी ५
- शहरी स्वास्थ्य केन्द्र -
- गाउँघर क्लिनिक १५
- खोप क्लिनिक १४
- आधारभूत स्वस्थ सेवाकेन्द्र २
- बर्थिंग सेन्टर ५
सरकारी संस्था
- अस्पताल तथा नर्सिंग होम -
- पोलिक्लिनिक १
- औषधि पसल ३
निजी (गैर-सरकारी संस्था समेत)
अन्य स्वास्थ्य केन्द्रहरु
- माइक्रोस्कोपी केन्द्र ४
- एआरटि केन्द्र -
- एचाईभी परीक्षण केन्द्र -
- क्षयरोग उपचार केन्द्र ५
- आयुर्वेद अस्पताल/केन्द्र १
- आँखा अस्पताल/केन्द्र -
अस्पताल शैयाहरू
- सार्वजनिक -
- निजी -
थप सेवाहरू
- समुदाय स्वास्थ्य एकाई ३
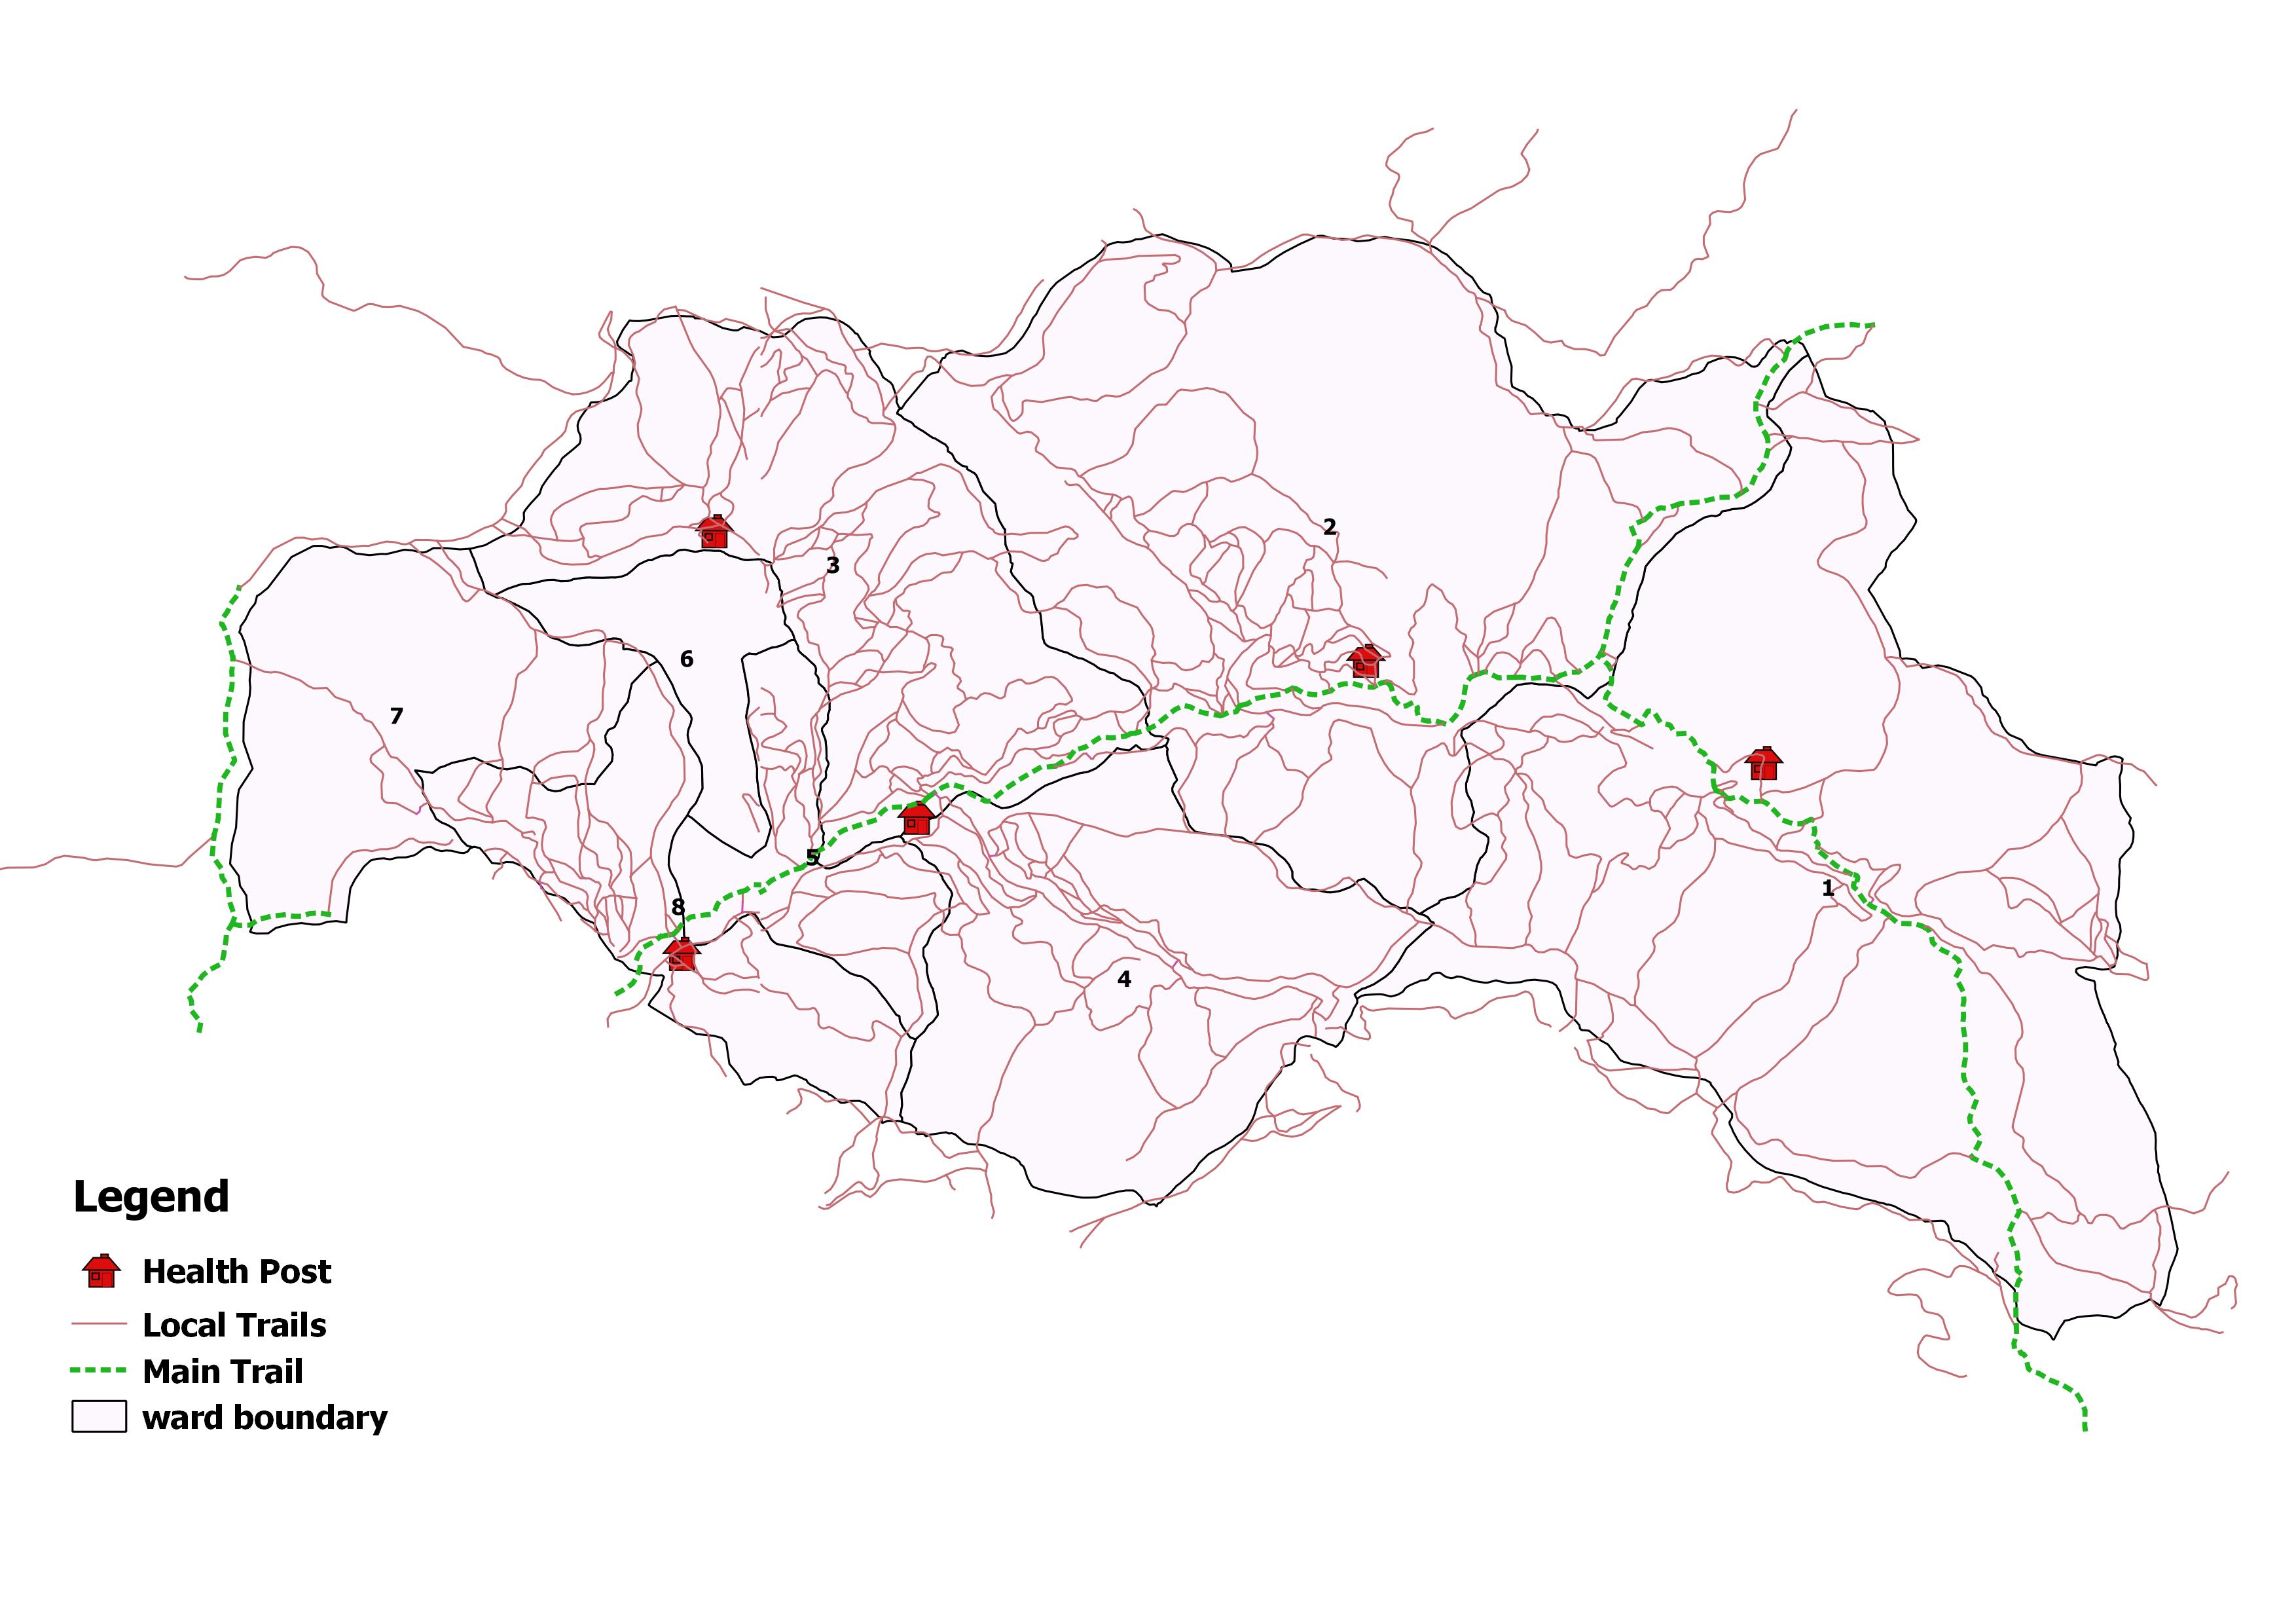
वडा अनुसार स्वास्थ्य संस्थाको जानकारी
| स्वास्थ्यसंस्थाको नाम | वार्ड न | बर्थिंग सेन्टर BEONC/CEONC | महिला स्वास्थ्य स्वयं सेवक संख्या | दक्ष प्रसुतिकर्मी संख्या | परिवार नियोजन *सेवा | स्वीकृत दरबन्दी | दरबन्दी अनुसार पदपूर्ति | करारका कर्मचारी |
|---|---|---|---|---|---|---|---|---|
| पाण्डवगुफा स्वास्थ्य चौकी | ८ | बर्थिंग सेन्टर | २१ | १ | ५ साधनहरू | ५ | ५ | ४ |
| हाटसिंजा स्वास्थ्य चौकी | ४ | बर्थिंग सेन्टर | २९ | १ | ३ साधनहरू | ५ | ५ | १ |
| मलिकाबोता स्वास्थ्य चौकी | २ | बर्थिंग सेन्टर | १२ | १ | ३ साधनहरू | ५ | ५ | १ |
| बिराट स्वास्थ्य चौकी | ३ | बर्थिंग सेन्टर | १६ | १ | ३ साधनहरू | ५ | ५ | १ |
| बुम्ब्रमाडीचौर स्वास्थ्य चौकी | १ | बर्थिंग सेन्टर | १० | २ | ३ साधनहरू | ५ | ५ | २ |
| लुद्कु समुदाय स्वास्थ्य एकाई | ५ | - | ० | ० | २ साधनहरू | ० | ० | २ |
| लेक्पोर समुदाय स्वास्थ्य एकाई | ४ | - | ० | ० | २ साधनहरू | ० | ० | २ |
| गोठचौर समुदाय स्वास्थ्य एकाई | ६ | - | ० | ० | २ साधनहरू | ० | ० | २ |
| कोईलाचरी समुदाय स्वास्थ्य एकाई | ३ | - | ० | ० | २ साधनहरू | ० | ० | २ |
| रानिसिन समुदाय स्वास्थ्य एकाई | ७ | - | ० | ० | २ साधनहरू | ० | ० | २ |
| कुल कर्मचारी संख्या | ८८ | ६ | २५ | २५ | १९ | |||
स्वास्थ्य सेवाको लागि मानव संसाधन
- CEONC साइटहरू-
- BEONC साइटहरू-
- आइयुसीडी तथा इम्पलान्ट सेवा प्रदायक१
- एकीकृत बालरोग व्यवस्थापन (IMCI) प्रशिक्षित कर्मचारी१४
- जनसंख्या (प्रति मस्वास्वका) १५६
- जनसंख्या (प्रति स्वास्थ्यकर्मी) ५४९
- अनुमानित गर्भवति (प्रति दक्ष प्रसुतिकर्मी) ६१
- अनुमानित गर्भवति (प्रति बर्थिङ्ग सेन्टर) -
- जनसंख्या (प्रति स्वास्थ्य संस्था) (अस्पताल,प्रस्वाके र स्वाचौ सहित) -
- जनसंख्या (प्रति सरकारी अस्पताल) -
- जनसंख्या (प्रति अस्पताल र नर्सिंग होम (सबै) -
मातृशिशु बालस्वास्थ्य र परिवार नियोजन सेवा उपयोगको अवस्था
स्वास्थ्य सूचना व्यवस्थापन प्रणाली २०७९प्रमूख स्वास्थ्य सेवाहरूको उपयोगको तुलनात्मक अवस्था
| सूचक | कनका सुन्दरी गाउँपालिका | कर्णाली प्रदेश २०७८/७९ | राष्ट्रीय २०७८/७९ | |||
|---|---|---|---|---|---|---|
| २०७६/७७ | २०७७/७८ | २०७८/७९ | ||||
| खाेप |
ग्राफ
तालिका
|
|||||
| बि.सि.जि. कभरेज | ७४.८ | ८५.७ | ७९.६ | ९२ | १०३.५ | |
| २३ महिनाभित्र पूर्ण खोप प्राप्त गरेका बालबालिका (%) | ० | ० | ० | ० | ० | |
| डि.पि.टि. - हेप बि - हिव ३ कभरेज | ७३.१ | ९०.७ | ८८.९ | ९४ | ९५.२ | |
| दादुरा रूबेला १ (९-११ महिना) कभरेज | ६९.८ | ८२.७ | ७८.२ | ९५ | ९४.७ | |
| जे.इ कभरेज | ७३.४ | ७०.७ | ८६.२ | ९६ | ९५.९ | |
| टि.डी. २ र टि. डी. २+ कभरेज | ६२.३ | ६४.८ | ६४.२ | ६६ | ७१.७ | |
| पोषण |
ग्राफ
तालिका
|
|||||
| कम जन्म तौल भएका नवजात शिशुको प्रतिशत | ३.२ | ५.५ | ४.८ | ६.८ | ९.४ | |
| नयाँ तौल लिएका १ वर्ष मुनिका शिशुहरुको प्रतिशत | १५३.५ | ७२.१ | १३०.३ | १२० | १०४.१ | |
| नयाँ तौल लिएका २ वर्ष मुनिका शिशुहरु मध्ये अति जोखिम अवस्थाका बालबालिकाहरुको प्रतिशत | १०.२ | १४.२ | ५.४ | ४.१ | ३.६ | |
| गर्भवती अवस्थामा १८० दिन आइरन चक्की प्राप्त गरेका गर्भवती महिलाहरुको प्रतिशत | ३९.७ | ३६.८ | ५६.६ | ७३ | ६० | |
| सुत्केरी अवस्थामा भिटामिन ए प्राप्त गरेका महिलाहरुको प्रतिशत | ६१.६ | ८४.८ | ८९.७ | ८८ | ७६.३ | |
| नवजात शिशु तथा बाल रोगको एकीकृत व्यस्थापन |
ग्राफ
तालिका
|
|||||
| नाभी मलम लगाएका नवजात शिशुको प्रतिशत | ९४.९ | ९५.५ | १०० | ९६ | ८२.९ | |
| ब्याक्टेरियाको गम्भीर संक्रमण भएकामध्ये जेन्टामाईसिन सुईद्वारा पूर्ण उपचार पाएको प्रतिशत | ० | ० | ० | ७५ | ४७.४ | |
| नयाँ निमोनिया बिरामीको दर (प्रति हजार पाँच वर्षमुनिका बालबालिकाहरुमा) | २६२.५ | २३३ | १९५.९ | ११३ | ३६.८ | |
| नयाँ एआरआई (स्वाशप्रश्वाका) बिरामी मध्ये कडा निमोनिया भएका बिरामीको प्रतिशत | ०.१८ | ०.२ | ०.२५ | ०.४१ | ०.१८ | |
| नयाँ झाडापखालाका बिरामीको दर (प्रति हजार पाँच वर्ष मुनिका बालबालिकाहरुमा) | ६३७.३ | ६९६.४ | ९१७ | ५७९ | ३५२.४ | |
| ५ वर्ष मुनिका झाडापखालाका बिरामी मध्ये जिंक र पुनर्जलीय झोलबाट उपचार गरेको प्रतिशत | ८६.७ | ६५.७ | ८५.३ | ९५ | ९४.५ | |
| जम्मा नवजात शिशु मृत्यु संख्या | ० | २ | २ | १९९ | १९१४ | |
| सुरक्षित मातृत्व तथा परिवार नियोजन |
ग्राफ
तालिका
|
|||||
| प्परोटोकल अनुसार पहिलो पटक गर्भवती जाँच गराएका गर्भवती महिलाहरुको प्रतिशत | ५३.५ | ६२.६ | ६४.५ | १२२ | ९१.४ | |
| प्रजनन् उमेरका महिलाहरुमा परिवार नियोजनको प्रयोगकर्ता दर (आधुनिक साधन) | ० | ० | ० | ० | ० | |
| ४ पटक गर्भवती जाँच (महिना: ४,६,८,९/हप्ता: १६, २०-२४,३२ र ३६) महिलाहरुको प्रतिशत | २८.१ | ३६.८ | ५७.१ | ७३ | ७९.४ | |
| स्वास्थ्य संस्था प्रसुति दर | ५७.४ | ७७.१ | ७९.७ | ८३ | ७९ | |
| दक्ष प्रसुतिकर्मी/स्वास्थ्यकर्मीद्वारा प्रसुति गराएको प्रतिशत | ४९.७ | ६७.४ | ५३.८ | ७० | ७५ | |
| प्रोटोकल अनुसार ४ पटक (आ.व २०७८/७९ सम्म ३ पटक) सुत्केरी जाँच गराउने आमाहरुको प्रतिशत | ३१.६ | ४४.५ | ७६.९ | ५३ | ४०.८ | |
| जम्मा मातृ मृत्यु संख्या | ० | ० | ० | १७ | २३१ | |
| परिवार नियोजन सेवाका नयाँ सेवाग्राही दर (प्रजनन उमेरका महिलाहरु मध्ये) | १४.८ | १४.३ | ८५.३ | १९ | ११.५ | |
| औलो रोग, क्षय रोग, कुष्ठरोग र एचआईभी |
ग्राफ
तालिका
|
|||||
| औलोको स्लाइड नमुना पोजेटिभ दर | ० | ० | ० | ०.२५ | ०.१७ | |
| डेंगुको जम्मा विरामी संख्या | ० | ० | ० | ० | ० | |
| आयातित औलोरोगको प्रतिशत (नयाँ औलो रोग मध्ये | ० | ० | ० | ६३ | ८९.५ | |
| जम्मा औलो रोग मध्ये प्लाज्मोडियम फाल्सिपारमको अनुपात | ० | ० | ० | २.१ | २२.८ | |
| नयाँ क्षयरोगी बिरामी पत्ता लागेको दर | १०५.३ | ३२.४ | ९४.७ | ९७ | १२९.१ | |
| क्षयरोगको उपचार सफलता दर | १०० | ६९.२ | १०० | ९१ | ९१.५ | |
| कुष्ठरोगको रोग प्रकोप दर (प्रति १०००० मा) | ० | ०.६५ | ० | ०.५ | ० | |
| ए. आर. टी. उपचारमा रहेका जम्मा एच. आइ. भी. पोजेटिभको संख्या | ० | ० | ० | ६९१ | २२१५२ | |
| उपचारात्मक सेवा |
ग्राफ
तालिका
|
|||||
| ओ पि डी मा आएका बिरामी मध्ये नयाँ बिरामीको दर | ८२.१ | ९८.५ | ९२.३ | १०५ | ९२ | |
शीर्ष १० स्वास्थ्य अवस्थाको सूची
स्वास्थ्य सूचना व्यवस्थापन प्रणाली २०७८-७९स्वास्थ्य क्षेत्रमा बजेट
- सशर्त स्वास्थ्यमा छुट्याएको बजेट
- समानीकरणबाट विनियोजित स्वास्थ्य बजेट
- अन्य श्रोतबाट बिनियोजित स्वास्थ्य बजेट
| बजेट | कनका सुन्दरी गाउँपालिका | |||||
|---|---|---|---|---|---|---|
| २०७६/७७ | २०७७/७८ | २०७८/७९ | ||||
| ग्राफ | ||||||
| पालिकाको कुल बजेट (रु ) | ३१७,५००,००० | ३७९,८२८,००० | ४२३,३०४,१९३ | |||
| स्वास्थ्य बजेट (सबै स्रोत) | २५,९३६,००० | ४१,३००,००० | ४३,२५०,००० | |||
| सशर्त स्वास्थ्यमा छुट्याएको बजेट | २४,४३६,००० | २८,२००,००० | ३९,८००,००० | |||
| समानीकरणबाट विनियोजित स्वास्थ्य बजेट | १,५००,००० | १२,४००,००० | ३,४५०,००० | |||
| अन्य श्रोतबाट बिनियोजित स्वास्थ्य बजेट | - | ७००,००० | ||||
| बजेट खर्च (%) | १०० | ८४ | ८७ | |||
| तालिका | ||||||
महत्वपूर्ण सम्पर्क
Kanaka Sundari Gaun Palika
ठेगाना : बिराट, जुम्ला
टेलिफोन : ९७४८६३२५०
वेबसाइट : https://kankasundarimun.gov.np/
गाउँपालिका अध्यक्ष
नाम : दामोदर प्रशाद आचार्य
सम्पर्क : ९८४८०८३४१६
ईमेल : damodaracharya2028@gmail.com

यो प्रोफाइल अमेरिकी अन्तर्राष्ट्रिय विकास नियोग (युएसएआइडी) मार्फत अमेरिकी जनताहरुको सहयोगका कारण सम्भव बनेको हो । यो प्रतिवेदन भित्रका विषयवस्तु र सामग्री स्वास्थ्यका लागि सक्षम प्रणालीका एकल जिम्मेवारी हुन् र तिनले युएसएआइडी वा अमेरिकी सरकारको विचारको प्रतिविम्बित गर्छन् भन्ने जरुरी छैन ।