संक्षिप्त परिचय कपिलबस्तु नगरपालिका
नेपालको लुम्बिनी प्रदेश अन्तर्गत कपिलवस्तु जिल्लाको सदरमुकाम अवस्थित कपिलवस्तु नगरपालिका २७ डिग्री ५४ मिनेट उत्तरी आक्षांश र ८३ डिग्री ०४ मिनेट पूर्वी देशान्तरमा अवस्थित रहेको छ | २०३९ सालमा तौलिहवा गाउँ पंचायतको नामबाट स्थापना भएको यस नगरपालिका साविकको बरगदवा, मालपारा, पिपरी र कपिलवस्तु आदर्श गाउँ पञ्चायतको पुरै भूभाग तथा गोटिहवा, गोबरी र तिलौराकोट गाउँ पञ्चायतको केहि भूभाग समेटिएको थियो | साविकमा १४ वडा रहेको यस नगरपालिका नेपाल सरकारको मिति २०७१/०७/२१ को निर्णयानुसार साविकको गोटीहावा गा.पं. र तिलौराकोट गा.पं. को पुरै भाग समेटी १९ वडा कायम गरिएको थियो | स्थानीय तहको पुनर्संरचना संगै साविकको धरमपनिया, दोहनी, जहदी, निग्लिहवा र सौराहा गा.वि.स. समावेश भएका छन् | हाल कपिलवस्तु नगरपालिका १२ वार्ड कायम भई १३६.९१ वर्ग कि. मि. क्षेत्रफल अगोट्टेको छ | पूर्वमा मायादेवी गा.पा. र बाणगंगा गा.पा. पश्चिममा महाराजगंज र बुद्धभुमी न.पा. उत्तरमा बुद्धभुमी र बाणगंगा न.पा. दक्षिणमा यसोधरा र मायादेवी गा.पा. रहेको यस नगरपालिकाको ७६३९४ जनसंख्या रहेको छ | २०६८ को जनगणना अनुसार कूल जनघनत्व ५५८ रहेको छ |
जनसाङ्खिक सूचक
-
कूल जनसंख्या ७
९२,८६०
/ -
१ बर्ष भन्दा मुनिको जनसंख्या ७
१,९०७
/ -
पाँच बर्ष भन्दा मुनिको जनसंख्या ७
९,६२१
/ -
किशोरावस्था (१०-१९ बर्ष) को जनसंख्या ७
१६,९३४
/ -
प्रजनन उमेरका महिला (१५ -४९ बर्ष ) ७
२५,३९२
/ -
अनुमानित गर्भवती महिलाहरु ७
२,३१३
/ -
अनुमानित जिवित जन्मको संख्या ७
१,८३३
/ -
परिवारमा अनुपस्थित (विदेशमा बस्ने) जनसंख्या २
३,९२५
२०६८ -
मोबाइल फोन भएका घरधुरी (%) २
७,०८६
२०६८ -
टेलिभिजन भएका घरधुरी (%) २
३,९७०
२०६८ -
लैङ्गिक अनुपात ७
९९
२०६८ -
१४ बर्ष र सो भन्दा कम उमेरका जनसंख्या ७
२८,३४०
/ -
६५ बर्ष र सो भन्दा माथि उमेरका जनसंख्या ७
७,८९८
/
उमेर र लिंगको आधारमा जनसंख्या वितरण
जनगणना २०६८जातिगत आधारमा जनसंख्या वितरण
जनगणना २०६८वार्ड अनुसार जनसंख्या वितरण
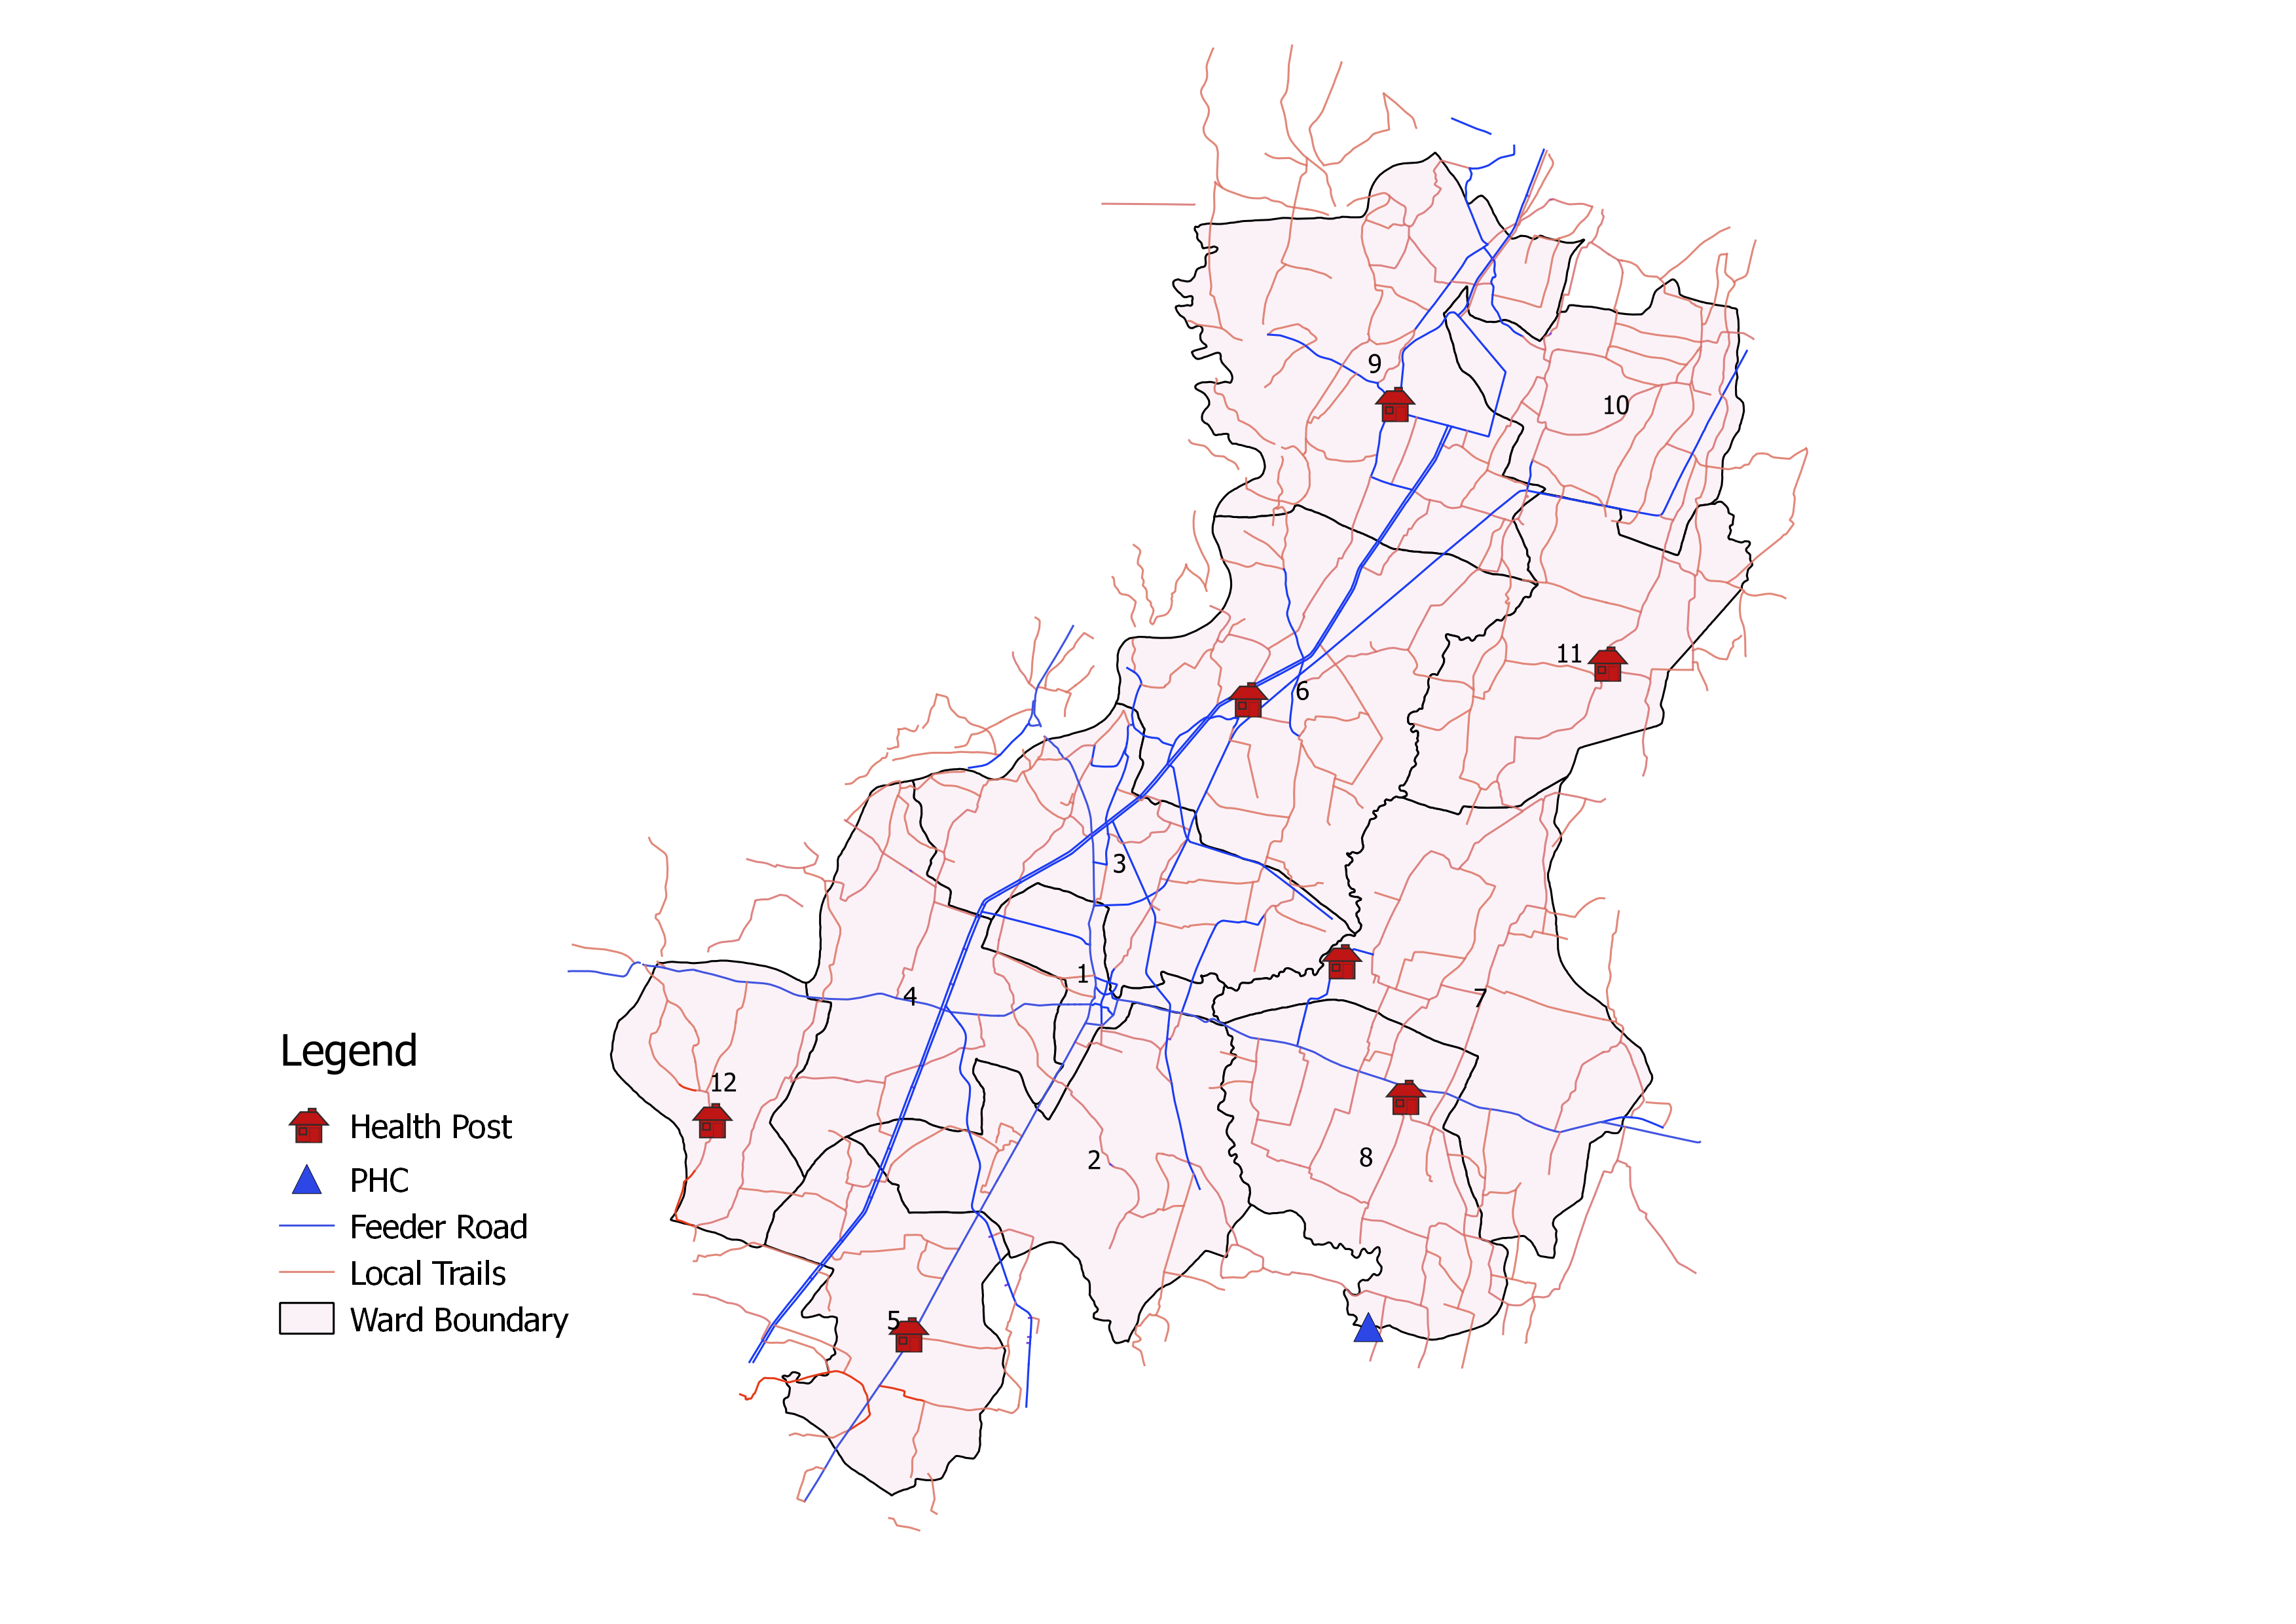
जनगणना २०६८स्वास्थ्य सेवा प्रवाह गर्ने संस्थाहरु

- अस्पताल -
- प्रास्वाके -
- स्वास्थ्य चौकी ७
- सामुदायिक स्वास्थ्य ईकाई -
- शहरी स्वास्थ्य केन्द्र १
- गाउँघर क्लिनिक २५
- खोप क्लिनिक ४६
- आधारभूत स्वस्थ सेवाकेन्द्र ५
- बर्थिंग सेन्टर १
सरकारी संस्था
- अस्पताल तथा नर्सिंग होम -
- पोलिक्लिनिक २
- औषधि पसल -
निजी (गैर-सरकारी संस्था समेत)
अन्य स्वास्थ्य केन्द्रहरु
- माइक्रोस्कोपी केन्द्र १
- एआरटि केन्द्र -
- एचाईभी परीक्षण केन्द्र -
- क्षयरोग उपचार केन्द्र ७
- आयुर्वेद अस्पताल/केन्द्र १
- आँखा अस्पताल/केन्द्र १
अस्पताल शैयाहरू
- सार्वजनिक ५०
- निजी -
थप सेवाहरू
वडा अनुसार स्वास्थ्य संस्थाको जानकारी
| स्वास्थ्यसंस्थाको नाम | वार्ड न | बर्थिंग सेन्टर BEONC/CEONC | महिला स्वास्थ्य स्वयं सेवक संख्या | दक्ष प्रसुतिकर्मी संख्या | परिवार नियोजन *सेवा | स्वीकृत दरबन्दी | दरबन्दी अनुसार पदपूर्ति | करारका कर्मचारी |
|---|---|---|---|---|---|---|---|---|
| आधारभुत स्वास्थ्य केन्द्र १ | १ | होईन | ११ | ० | ३ साधनहरू | ३ | ० | ३ |
| आधारभुत स्वास्थ्य केन्द्र २ | २ | होईन | १२ | ० | ३ साधनहरू | ३ | ३ | ३ |
| आधारभुत स्वास्थ्य केन्द्र ३ | ३ | होईन | १४ | ० | ३ साधनहरू | ३ | ३ | ३ |
| आधारभुत स्वास्थ्य केन्द्र ४ | ४ | होईन | १२ | ० | ३ साधनहरू | ३ | ३ | ३ |
| गोटीहवा स्वास्थ्य चौकी | ५ | होईन | १३ | ० | ४ साधनहरू | ६ | ४ | ० |
| तिलौराकोट स्वास्थ्य चौकी | ६ | हो | १४ | ३ | ५ साधनहरू | ६ | ५ | ५ |
| धरमपनिया स्वास्थ्य चौकी | ७ | होईन | १३ | ० | ५ साधनहरू | ६ | ४ | ० |
| दोहोनि स्वास्थ्य चौकी | ८ | होईन | १४ | ० | ४ साधनहरू | ६ | ४ | ० |
| निग्लिहवा स्वास्थ्य चौकी | ९ | होईन | ११ | ० | ५ साधनहरू | ६ | ५ | १ |
| आधारभुत स्वास्थ्य केन्द्र बगियादाधा | १० | होईन | ० | ० | ३ साधनहरू | ३ | ३ | ३ |
| जहदी स्वास्थ्य चौकी | ११ | होईन | ९ | १ | ४ साधनहरू | ६ | ६ | १ |
| सौराहा स्वास्थ्य चौकी | १२ | होईन | १३ | ० | ३ साधनहरू | ६ | ४ | ० |
| बनगाई सहरी स्वास्थ्य केन्द्र | ११ | होईन | ० | ० | ३ साधनहरू | ३ | ३ | ३ |
| कुल कर्मचारी संख्या | १३६ | ४ | ६० | ४७ | २५ | |||
स्वास्थ्य सेवाको लागि मानव संसाधन
- CEONC साइटहरू-
- BEONC साइटहरू१
- आइयुसीडी तथा इम्पलान्ट सेवा प्रदायक५
- एकीकृत बालरोग व्यवस्थापन (IMCI) प्रशिक्षित कर्मचारी५५
- जनसंख्या (प्रति मस्वास्वका) ६८३
- जनसंख्या (प्रति स्वास्थ्यकर्मी) १९७६
- अनुमानित गर्भवति (प्रति दक्ष प्रसुतिकर्मी) ५७८
- अनुमानित गर्भवति (प्रति बर्थिङ्ग सेन्टर) २३१३
- जनसंख्या (प्रति स्वास्थ्य संस्था) (अस्पताल,प्रस्वाके र स्वाचौ सहित) -
- जनसंख्या (प्रति सरकारी अस्पताल) -
- जनसंख्या (प्रति अस्पताल र नर्सिंग होम (सबै) -
मातृशिशु बालस्वास्थ्य र परिवार नियोजन सेवा उपयोगको अवस्था
स्वास्थ्य सूचना व्यवस्थापन प्रणाली २०७८प्रमूख स्वास्थ्य सेवाहरूको उपयोगको तुलनात्मक अवस्था
| सूचक | कपिलबस्तु नगरपालिका | लुम्बिनी प्रदेश २०७८/७९ | राष्ट्रीय २०७८/७९ | |||
|---|---|---|---|---|---|---|
| २०७६/७७ | २०७७/७८ | २०७८/७९ | ||||
| खाेप |
ग्राफ
तालिका
|
|||||
| बि.सि.जि. कभरेज | ९९.१ | ११४.९ | १०७.९ | १०३.१ | १०३.५ | |
| २३ महिनाभित्र पूर्ण खोप प्राप्त गरेका बालबालिका (%) | ० | ० | ० | ० | ० | |
| डि.पि.टि. - हेप बि - हिव ३ कभरेज | ७५.३ | १२१.८ | ९६.३ | ९६.६ | ९५.२ | |
| दादुरा रूबेला १ (९-११ महिना) कभरेज | ८४.२ | १०९.१ | ९६.६ | ९६.७ | ९४.७ | |
| जे.इ कभरेज | ७९.६ | ११० | ९८.३ | ९८.९ | ९५.९ | |
| टि.डी. २ र टि. डी. २+ कभरेज | १००.५ | ९८.१ | ८५.८ | ७३.९ | ७१.७ | |
| पोषण |
ग्राफ
तालिका
|
|||||
| कम जन्म तौल भएका नवजात शिशुको प्रतिशत | ३१.४ | २७.७५ | १८ | १२ | ९.४ | |
| नयाँ तौल लिएका १ वर्ष मुनिका शिशुहरुको प्रतिशत | ६४.८ | १.६ | १.२ | १०९ | १०४.१ | |
| नयाँ तौल लिएका २ वर्ष मुनिका शिशुहरु मध्ये अति जोखिम अवस्थाका बालबालिकाहरुको प्रतिशत | ५.२ | १.९ | ३.२ | ३.५ | ३.६ | |
| गर्भवती अवस्थामा १८० दिन आइरन चक्की प्राप्त गरेका गर्भवती महिलाहरुको प्रतिशत | ३५.७ | ३९.५ | ६१.७ | ७५.८ | ६० | |
| सुत्केरी अवस्थामा भिटामिन ए प्राप्त गरेका महिलाहरुको प्रतिशत | ३४.५ | ९०.८ | १५०.६ | ९८.२ | ७६.३ | |
| नवजात शिशु तथा बाल रोगको एकीकृत व्यस्थापन |
ग्राफ
तालिका
|
|||||
| नाभी मलम लगाएका नवजात शिशुको प्रतिशत | ७६.८ | ५६.२ | ८१.२ | ९४.२ | ८२.९ | |
| ब्याक्टेरियाको गम्भीर संक्रमण भएकामध्ये जेन्टामाईसिन सुईद्वारा पूर्ण उपचार पाएको प्रतिशत | ० | ० | ० | ३९.५ | ४७.४ | |
| नयाँ निमोनिया बिरामीको दर (प्रति हजार पाँच वर्षमुनिका बालबालिकाहरुमा) | १८.४ | १३.२ | ६.४ | २९.३ | ३६.८ | |
| नयाँ एआरआई (स्वाशप्रश्वाका) बिरामी मध्ये कडा निमोनिया भएका बिरामीको प्रतिशत | ० | ० | ० | ०.०५ | ०.१८ | |
| नयाँ झाडापखालाका बिरामीको दर (प्रति हजार पाँच वर्ष मुनिका बालबालिकाहरुमा) | २५६.६ | ३९६.६ | ३८०.३ | ३३९ | ३५२.४ | |
| ५ वर्ष मुनिका झाडापखालाका बिरामी मध्ये जिंक र पुनर्जलीय झोलबाट उपचार गरेको प्रतिशत | ९३.३ | ८४.५ | १०० | ९८.७ | ९४.५ | |
| जम्मा नवजात शिशु मृत्यु संख्या | १ | ० | ३ | ५७३ | १९१४ | |
| सुरक्षित मातृत्व तथा परिवार नियोजन |
ग्राफ
तालिका
|
|||||
| प्परोटोकल अनुसार पहिलो पटक गर्भवती जाँच गराएका गर्भवती महिलाहरुको प्रतिशत | ६९.७ | ६४.४ | ६७.१ | ९३.५ | ९१.४ | |
| प्रजनन् उमेरका महिलाहरुमा परिवार नियोजनको प्रयोगकर्ता दर (आधुनिक साधन) | ० | ० | ० | ० | ० | |
| ४ पटक गर्भवती जाँच (महिना: ४,६,८,९/हप्ता: १६, २०-२४,३२ र ३६) महिलाहरुको प्रतिशत | ६१.६ | ३९.९ | ५९.३ | ७९.७ | ७९.४ | |
| स्वास्थ्य संस्था प्रसुति दर | ८३ | ९५ | ११९ | ९४.२ | ७९ | |
| दक्ष प्रसुतिकर्मी/स्वास्थ्यकर्मीद्वारा प्रसुति गराएको प्रतिशत | ८० | ९५ | ११८.९ | ८९.८ | ७५ | |
| प्रोटोकल अनुसार ४ पटक (आ.व २०७८/७९ सम्म ३ पटक) सुत्केरी जाँच गराउने आमाहरुको प्रतिशत | ०.३७ | ५.६ | ३९.२ | ५३.७ | ४०.८ | |
| जम्मा मातृ मृत्यु संख्या | २ | ० | १ | ७४ | २३१ | |
| परिवार नियोजन सेवाका नयाँ सेवाग्राही दर (प्रजनन उमेरका महिलाहरु मध्ये) | १८.६ | १२.३ | १०.३ | १२.४ | ११.५ | |
| औलो रोग, क्षय रोग, कुष्ठरोग र एचआईभी |
ग्राफ
तालिका
|
|||||
| औलोको स्लाइड नमुना पोजेटिभ दर | ०.२५ | ० | ०.५४ | ०.२७ | ०.१७ | |
| डेंगुको जम्मा विरामी संख्या | ० | ० | ० | ० | ० | |
| आयातित औलोरोगको प्रतिशत (नयाँ औलो रोग मध्ये | १०० | - | ६६.७ | ९५.५ | ८९.५ | |
| जम्मा औलो रोग मध्ये प्लाज्मोडियम फाल्सिपारमको अनुपात | ० | ० | ३३.३ | ३८.७ | २२.८ | |
| नयाँ क्षयरोगी बिरामी पत्ता लागेको दर | ८८.२ | ११२ | १३३.६ | १५७.४ | १२९.१ | |
| क्षयरोगको उपचार सफलता दर | ० | ८६.३ | ९०.२ | ९१ | ९१.५ | |
| कुष्ठरोगको रोग प्रकोप दर (प्रति १०००० मा) | ० | ०.७७ | ०.८८ | ०.९ | ० | |
| ए. आर. टी. उपचारमा रहेका जम्मा एच. आइ. भी. पोजेटिभको संख्या | ० | ० | ० | ४३२६ | २२१५२ | |
| उपचारात्मक सेवा |
ग्राफ
तालिका
|
|||||
| ओ पि डी मा आएका बिरामी मध्ये नयाँ बिरामीको दर | ० | ० | ६२ | ९४.५ | ९२ | |
शीर्ष १० स्वास्थ्य अवस्थाको सूची
स्वास्थ्य सूचना व्यवस्थापन प्रणाली २०७८स्वास्थ्य क्षेत्रमा बजेट
- सशर्त स्वास्थ्यमा छुट्याएको बजेट
- समानीकरणबाट विनियोजित स्वास्थ्य बजेट
- अन्य श्रोतबाट बिनियोजित स्वास्थ्य बजेट
| बजेट | कपिलबस्तु नगरपालिका | |||||
|---|---|---|---|---|---|---|
| २०७७/७८ | २०७८/७९ | २०७९/८० | ||||
| ग्राफ | ||||||
| पालिकाको कुल बजेट (रु ) | १,३४०,०००,००० | ४२,४००,००० | ५७,५००,००० | |||
| स्वास्थ्य बजेट (सबै स्रोत) | ५७,५००,००० | ४२,५००,००० | ४२,५००,००० | |||
| सशर्त स्वास्थ्यमा छुट्याएको बजेट | ४२,५००,००० | २७,५००,००० | ४२,५००,००० | |||
| समानीकरणबाट विनियोजित स्वास्थ्य बजेट | १५,०००,००० | १५,०००,००० | ||||
| अन्य श्रोतबाट बिनियोजित स्वास्थ्य बजेट | - | |||||
| बजेट खर्च (%) | ५७,५००,००० | ४२,५००,००० | ४२,५००,००० | |||
| तालिका | ||||||
महत्वपूर्ण सम्पर्क
Kapilbastu Municipality
ठेगाना : तौलिहवा, कपिलवस्तु
टेलिफोन : -
वेबसाइट : https://kapilvastumun.gov.np/
स्वास्थ्य शाखा प्रमुख
नाम : उमेश प्रसाद गुप्ता
सम्पर्क : ९८५७०५२५४५
ईमेल : umeshguptahealth@gmail.com

यो प्रोफाइल अमेरिकी अन्तर्राष्ट्रिय विकास नियोग (युएसएआइडी) मार्फत अमेरिकी जनताहरुको सहयोगका कारण सम्भव बनेको हो । यो प्रतिवेदन भित्रका विषयवस्तु र सामग्री स्वास्थ्यका लागि सक्षम प्रणालीका एकल जिम्मेवारी हुन् र तिनले युएसएआइडी वा अमेरिकी सरकारको विचारको प्रतिविम्बित गर्छन् भन्ने जरुरी छैन ।