संक्षिप्त परिचय खाँडाचक्र नगरपालिका
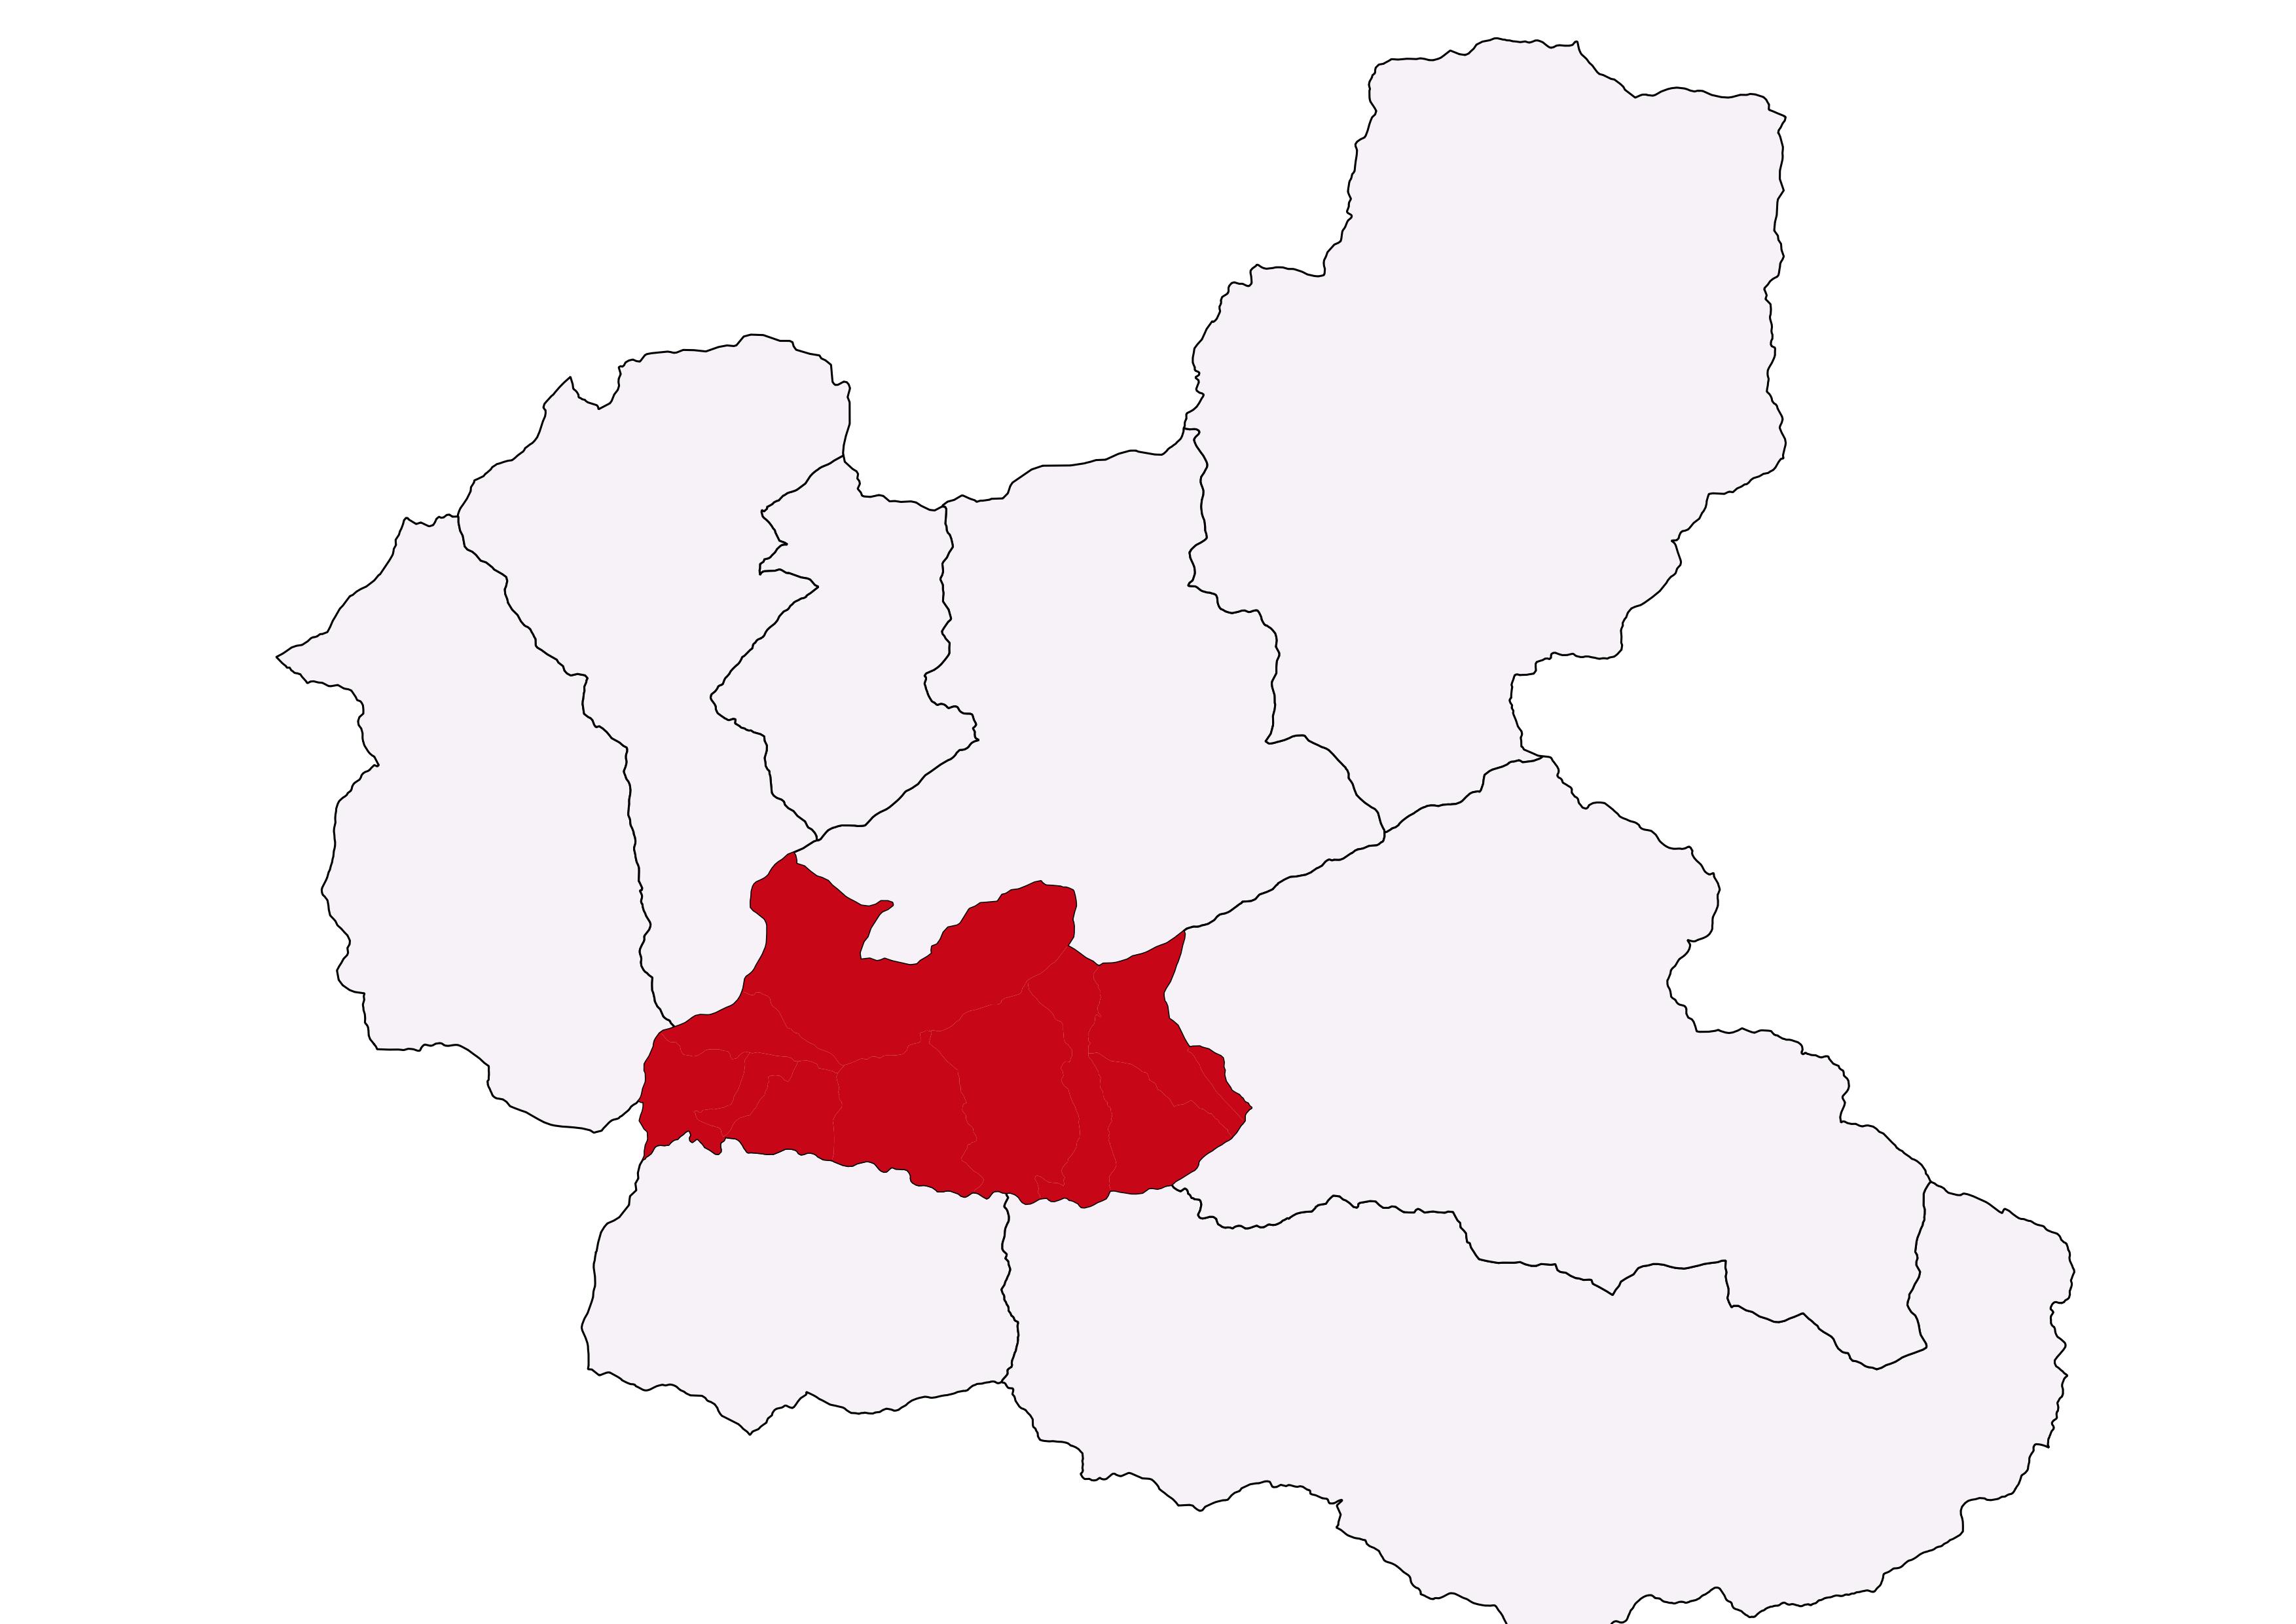
कालिकोट जिल्लाको ९ वटा पालिका मध्ये खाँडाचक्र नगरपालिका एक पालिका हो । १३३.२९ वर्ग कि.मि.को क्षेत्रफलमा फैलिएको खाँडाचक्र नगरपालिका कुल ११ वटा वडाहरूमा विभाजित छ । यसको पुर्वि सिमानामा तिलागुफा नगरपालिका, पश्चिममा नरहरीनाथ तथा सान्नी त्रिवेणी गाउँपालिका, उत्तरमा पचाँलझरना गाउँपालिका र दक्षिणमा शुभकालिका गाउँपालिका तथा महावै गाउँपालिका रहेको छ ।
जनसाङ्खिक सूचक
-
कूल जनसंख्या १
२३,८७७
२०७९/०८० -
१ बर्ष भन्दा मुनिको जनसंख्या १
६४४
२०७९/०८० -
पाँच बर्ष भन्दा मुनिको जनसंख्या १
३,२४०
२०७९/०८० -
किशोरावस्था (१०-१९ बर्ष) को जनसंख्या १
४,९८१
२०७९/०८० -
प्रजनन उमेरका महिला (१५ -४९ बर्ष ) १
५,८००
२०७९/०८० -
अनुमानित गर्भवती महिलाहरु १
७२८
२०७९/०८० -
अनुमानित जिवित जन्मको संख्या १
५७७
२०७९/०८० -
परिवारमा अनुपस्थित (विदेशमा बस्ने) जनसंख्या २
२४१
-
मोबाइल फोन भएका घरधुरी (%) २
३८
-
टेलिभिजन भएका घरधुरी (%) २
१०
-
लैङ्गिक अनुपात २
१०४
-
१४ बर्ष र सो भन्दा कम उमेरका जनसंख्या २
८,९७२
-
६५ बर्ष र सो भन्दा माथि उमेरका जनसंख्या २
५२७
उमेर र लिंगको आधारमा जनसंख्या वितरण
जनगणना २०६८जातिगत आधारमा जनसंख्या वितरण
जनगणना २०६८वार्ड अनुसार जनसंख्या वितरण
जनगणना २०६८स्वास्थ्य सेवा प्रवाह गर्ने संस्थाहरु

- अस्पताल १
- प्रास्वाके -
- स्वास्थ्य चौकी २
- सामुदायिक स्वास्थ्य ईकाई १
- शहरी स्वास्थ्य केन्द्र -
- गाउँघर क्लिनिक -
- खोप क्लिनिक १४
- आधारभूत स्वस्थ सेवाकेन्द्र ८
- बर्थिंग सेन्टर ३
सरकारी संस्था
- अस्पताल तथा नर्सिंग होम -
- पोलिक्लिनिक -
- औषधि पसल ५
निजी (गैर-सरकारी संस्था समेत)
अन्य स्वास्थ्य केन्द्रहरु
- माइक्रोस्कोपी केन्द्र २
- एआरटि केन्द्र १
- एचाईभी परीक्षण केन्द्र १
- क्षयरोग उपचार केन्द्र ३
- आयुर्वेद अस्पताल/केन्द्र १
- आँखा अस्पताल/केन्द्र १
अस्पताल शैयाहरू
- सार्वजनिक १५
- निजी -
वडा अनुसार स्वास्थ्य संस्थाको जानकारी
| स्वास्थ्यसंस्थाको नाम | वार्ड न | बर्थिंग सेन्टर BEONC/CEONC | महिला स्वास्थ्य स्वयं सेवक संख्या | दक्ष प्रसुतिकर्मी संख्या | परिवार नियोजन *सेवा | स्वीकृत दरबन्दी | दरबन्दी अनुसार पदपूर्ति | करारका कर्मचारी |
|---|---|---|---|---|---|---|---|---|
| दाहा स्वास्थ्य चाैकी | ५ | बर्थिङ्ग सेन्टर | ३ | २ | ५ साधनहरू | ५ | ५ | ३ |
| पाखा स्वास्थ्य चाैकी | ९ | बर्थिङ्ग सेन्टर | ३ | २ | ४ साधनहरू | ५ | ४ | ३ |
| आधारभुत स्वास्थ्य सेवा केन्द्र सेरीघाट | २ | - | ६ | ० | ३ साधनहरू | ० | ० | २ |
| आधारभुत स्वास्थ्य सेवा केन्द्र तारी | ३ | - | ३ | ० | ३ साधनहरू | ० | ० | २ |
| आधारभुत स्वास्थ्य सेवा केन्द्र चिउरेला | ४ | - | २ | ० | ४ साधनहरू | ० | ० | २ |
| आधारभुत स्वास्थ्य सेवा केन्द्र दाहा | ६ | - | ५ | ० | ३ साधनहरू | ० | ० | २ |
| आधारभुत स्वास्थ्य सेवा केन्द्र पिली | ७ | - | २ | ० | ३ साधनहरू | ० | ० | २ |
| आधारभुत स्वास्थ्य सेवा केन्द्र दाहाला | ८ | - | ५ | ० | ३ साधनहरू | ० | ० | २ |
| आधारभुत स्वास्थ्य सेवा केन्द्र चाैकी | १० | - | २ | ० | ३ साधनहरू | ० | ० | २ |
| आधारभुत स्वास्थ्य सेवा केन्द्र बदालकोट | ११ | - | ४ | ० | ३ साधनहरू | ० | ० | २ |
| कुल कर्मचारी संख्या | ७० | ८ | २० | १८ | ४४ | |||
स्वास्थ्य सेवाको लागि मानव संसाधन
- CEONC साइटहरू१
- BEONC साइटहरू-
- आइयुसीडी तथा इम्पलान्ट सेवा प्रदायक६
- एकीकृत बालरोग व्यवस्थापन (IMCI) प्रशिक्षित कर्मचारी१४
- जनसंख्या (प्रति मस्वास्वका) ३४१
- जनसंख्या (प्रति स्वास्थ्यकर्मी) १३२७
- अनुमानित गर्भवति (प्रति दक्ष प्रसुतिकर्मी) ९१
- अनुमानित गर्भवति (प्रति बर्थिङ्ग सेन्टर) २४३
- जनसंख्या (प्रति स्वास्थ्य संस्था) (अस्पताल,प्रस्वाके र स्वाचौ सहित) -
- जनसंख्या (प्रति सरकारी अस्पताल) २३८७७
- जनसंख्या (प्रति अस्पताल र नर्सिंग होम (सबै) २३८७७
मातृशिशु बालस्वास्थ्य र परिवार नियोजन सेवा उपयोगको अवस्था
स्वास्थ्य सूचना व्यवस्थापन प्रणाली २०७९प्रमूख स्वास्थ्य सेवाहरूको उपयोगको तुलनात्मक अवस्था
| सूचक | खाँडाचक्र नगरपालिका | कर्णाली प्रदेश २०७८/७९ | राष्ट्रीय २०७८/७९ | |||
|---|---|---|---|---|---|---|
| २०७६/७७ | २०७७/७८ | २०७८/७९ | ||||
| खाेप |
ग्राफ
तालिका
|
|||||
| बि.सि.जि. कभरेज | १२०.५ | १२१ | ७८.७ | ९२ | १०३.५ | |
| २३ महिनाभित्र पूर्ण खोप प्राप्त गरेका बालबालिका (%) | ० | ० | ० | ० | ० | |
| डि.पि.टि. - हेप बि - हिव ३ कभरेज | १०१.१ | १२३ | ७६.३ | ९४ | ९५.२ | |
| दादुरा रूबेला १ (९-११ महिना) कभरेज | ९९.२ | १०२ | ८४ | ९५ | ९४.७ | |
| जे.इ कभरेज | ९७.८ | १०३ | ७९ | ९६ | ९५.९ | |
| टि.डी. २ र टि. डी. २+ कभरेज | ६५.५ | १०१ | ६५ | ६६ | ७१.७ | |
| पोषण |
ग्राफ
तालिका
|
|||||
| कम जन्म तौल भएका नवजात शिशुको प्रतिशत | १०.३ | ४ | ११.३ | ६.८ | ९.४ | |
| नयाँ तौल लिएका १ वर्ष मुनिका शिशुहरुको प्रतिशत | ८४.६ | १०७ | ९५ | १२० | १०४.१ | |
| नयाँ तौल लिएका २ वर्ष मुनिका शिशुहरु मध्ये अति जोखिम अवस्थाका बालबालिकाहरुको प्रतिशत | १३ | ४ | ३.३ | ४.१ | ३.६ | |
| गर्भवती अवस्थामा १८० दिन आइरन चक्की प्राप्त गरेका गर्भवती महिलाहरुको प्रतिशत | १३३.५ | १०९ | ९४ | ७३ | ६० | |
| सुत्केरी अवस्थामा भिटामिन ए प्राप्त गरेका महिलाहरुको प्रतिशत | २७९.८ | १५९ | १०५ | ८८ | ७६.३ | |
| नवजात शिशु तथा बाल रोगको एकीकृत व्यस्थापन |
ग्राफ
तालिका
|
|||||
| नाभी मलम लगाएका नवजात शिशुको प्रतिशत | ९२.१ | ९५.६ | ९४ | ९६ | ८२.९ | |
| ब्याक्टेरियाको गम्भीर संक्रमण भएकामध्ये जेन्टामाईसिन सुईद्वारा पूर्ण उपचार पाएको प्रतिशत | १०० | १०० | ८२ | ७५ | ४७.४ | |
| नयाँ निमोनिया बिरामीको दर (प्रति हजार पाँच वर्षमुनिका बालबालिकाहरुमा) | १७९.१ | ६७ | ६८ | ११३ | ३६.८ | |
| नयाँ एआरआई (स्वाशप्रश्वाका) बिरामी मध्ये कडा निमोनिया भएका बिरामीको प्रतिशत | २.७ | ०.५२ | १ | ०.४१ | ०.१८ | |
| नयाँ झाडापखालाका बिरामीको दर (प्रति हजार पाँच वर्ष मुनिका बालबालिकाहरुमा) | १०५७.२ | २०६७ | ६५२ | ५७९ | ३५२.४ | |
| ५ वर्ष मुनिका झाडापखालाका बिरामी मध्ये जिंक र पुनर्जलीय झोलबाट उपचार गरेको प्रतिशत | १००.४ | १०० | १०० | ९५ | ९४.५ | |
| जम्मा नवजात शिशु मृत्यु संख्या | ७ | ३ | १ | १९९ | १९१४ | |
| सुरक्षित मातृत्व तथा परिवार नियोजन |
ग्राफ
तालिका
|
|||||
| प्परोटोकल अनुसार पहिलो पटक गर्भवती जाँच गराएका गर्भवती महिलाहरुको प्रतिशत | १३२.५ | १७६ | १४६ | १२२ | ९१.४ | |
| प्रजनन् उमेरका महिलाहरुमा परिवार नियोजनको प्रयोगकर्ता दर (आधुनिक साधन) | ० | ० | ० | ० | ० | |
| ४ पटक गर्भवती जाँच (महिना: ४,६,८,९/हप्ता: १६, २०-२४,३२ र ३६) महिलाहरुको प्रतिशत | ९७.७ | १३९ | १११ | ७३ | ७९.४ | |
| स्वास्थ्य संस्था प्रसुति दर | १४०.७ | १५५ | १११ | ८३ | ७९ | |
| दक्ष प्रसुतिकर्मी/स्वास्थ्यकर्मीद्वारा प्रसुति गराएको प्रतिशत | १३५.४ | १४६ | १०४ | ७० | ७५ | |
| प्रोटोकल अनुसार ४ पटक (आ.व २०७८/७९ सम्म ३ पटक) सुत्केरी जाँच गराउने आमाहरुको प्रतिशत | ४४.९ | ५७ | ५२ | ५३ | ४०.८ | |
| जम्मा मातृ मृत्यु संख्या | १ | १ | १ | १७ | २३१ | |
| परिवार नियोजन सेवाका नयाँ सेवाग्राही दर (प्रजनन उमेरका महिलाहरु मध्ये) | २७.६ | २२ | १९ | १९ | ११.५ | |
| औलो रोग, क्षय रोग, कुष्ठरोग र एचआईभी |
ग्राफ
तालिका
|
|||||
| औलोको स्लाइड नमुना पोजेटिभ दर | २.४ | २ | २ | ०.२५ | ०.१७ | |
| डेंगुको जम्मा विरामी संख्या | ० | ० | ० | ० | ० | |
| आयातित औलोरोगको प्रतिशत (नयाँ औलो रोग मध्ये | १०० | ३३ | ५० | ६३ | ८९.५ | |
| जम्मा औलो रोग मध्ये प्लाज्मोडियम फाल्सिपारमको अनुपात | १० | १७ | ० | २.१ | २२.८ | |
| नयाँ क्षयरोगी बिरामी पत्ता लागेको दर | ८७ | ३३ | ७७ | ९७ | १२९.१ | |
| क्षयरोगको उपचार सफलता दर | १०० | ९५ | ९१ | ९१ | ९१.५ | |
| कुष्ठरोगको रोग प्रकोप दर (प्रति १०००० मा) | ० | १.२ | १ | ०.५ | ० | |
| ए. आर. टी. उपचारमा रहेका जम्मा एच. आइ. भी. पोजेटिभको संख्या | २७ | ३७ | ६ | ६९१ | २२१५२ | |
| उपचारात्मक सेवा |
ग्राफ
तालिका
|
|||||
| ओ पि डी मा आएका बिरामी मध्ये नयाँ बिरामीको दर | ९९.४ | १०२ | ९२ | १०५ | ९२ | |
शीर्ष १० स्वास्थ्य अवस्थाको सूची
स्वास्थ्य सूचना व्यवस्थापन प्रणाली २०७९०८०स्वास्थ्य क्षेत्रमा बजेट
- सशर्त स्वास्थ्यमा छुट्याएको बजेट
- समानीकरणबाट विनियोजित स्वास्थ्य बजेट
- अन्य श्रोतबाट बिनियोजित स्वास्थ्य बजेट
| बजेट | खाँडाचक्र नगरपालिका | |||||
|---|---|---|---|---|---|---|
| २०७७/७८ | २०७८/७९ | २०७९/८० | ||||
| ग्राफ | ||||||
| पालिकाको कुल बजेट (रु ) | ६२२,०८५,८०० | ७०५,५१७,२३० | २९,०००,००० | |||
| स्वास्थ्य बजेट (सबै स्रोत) | ४०,६९०,००० | ३२,८५०,००० | ३३,०००,००० | |||
| सशर्त स्वास्थ्यमा छुट्याएको बजेट | २४,६८०,००० | २१,८००,००० | २९,०००,००० | |||
| समानीकरणबाट विनियोजित स्वास्थ्य बजेट | १६,०१०,००० | ११,०५०,००० | ४,०००,००० | |||
| अन्य श्रोतबाट बिनियोजित स्वास्थ्य बजेट | ||||||
| बजेट खर्च (%) | - | ९८ | ३३,०००,००० | |||
| तालिका | ||||||
महत्वपूर्ण सम्पर्क
Khandachakra Municipality
ठेगाना : खाँडाचक्र नगरपालिका, कालिकाेट
टेलिफोन : ०८७-४४००१२
वेबसाइट : http://www.khandachakramun.gov.np
प्रमुख कार्यकारी अधिकृत
नाम : देबेन्द्र प्रसाद श्रेष्ठ
सम्पर्क : ९८४९०१९४५०
ईमेल : khandachakra.mun@gmail.com
सूचना तथा संचार प्रविधि अधिकृत
नाम : दमन राज शाही
सम्पर्क : ९८४४८४३०८२
ईमेल : khandachakra.mun@gmail.com

यो प्रोफाइल अमेरिकी अन्तर्राष्ट्रिय विकास नियोग (युएसएआइडी) मार्फत अमेरिकी जनताहरुको सहयोगका कारण सम्भव बनेको हो । यो प्रतिवेदन भित्रका विषयवस्तु र सामग्री स्वास्थ्यका लागि सक्षम प्रणालीका एकल जिम्मेवारी हुन् र तिनले युएसएआइडी वा अमेरिकी सरकारको विचारको प्रतिविम्बित गर्छन् भन्ने जरुरी छैन ।