संक्षिप्त परिचय कोहलपुर नगरपालिका
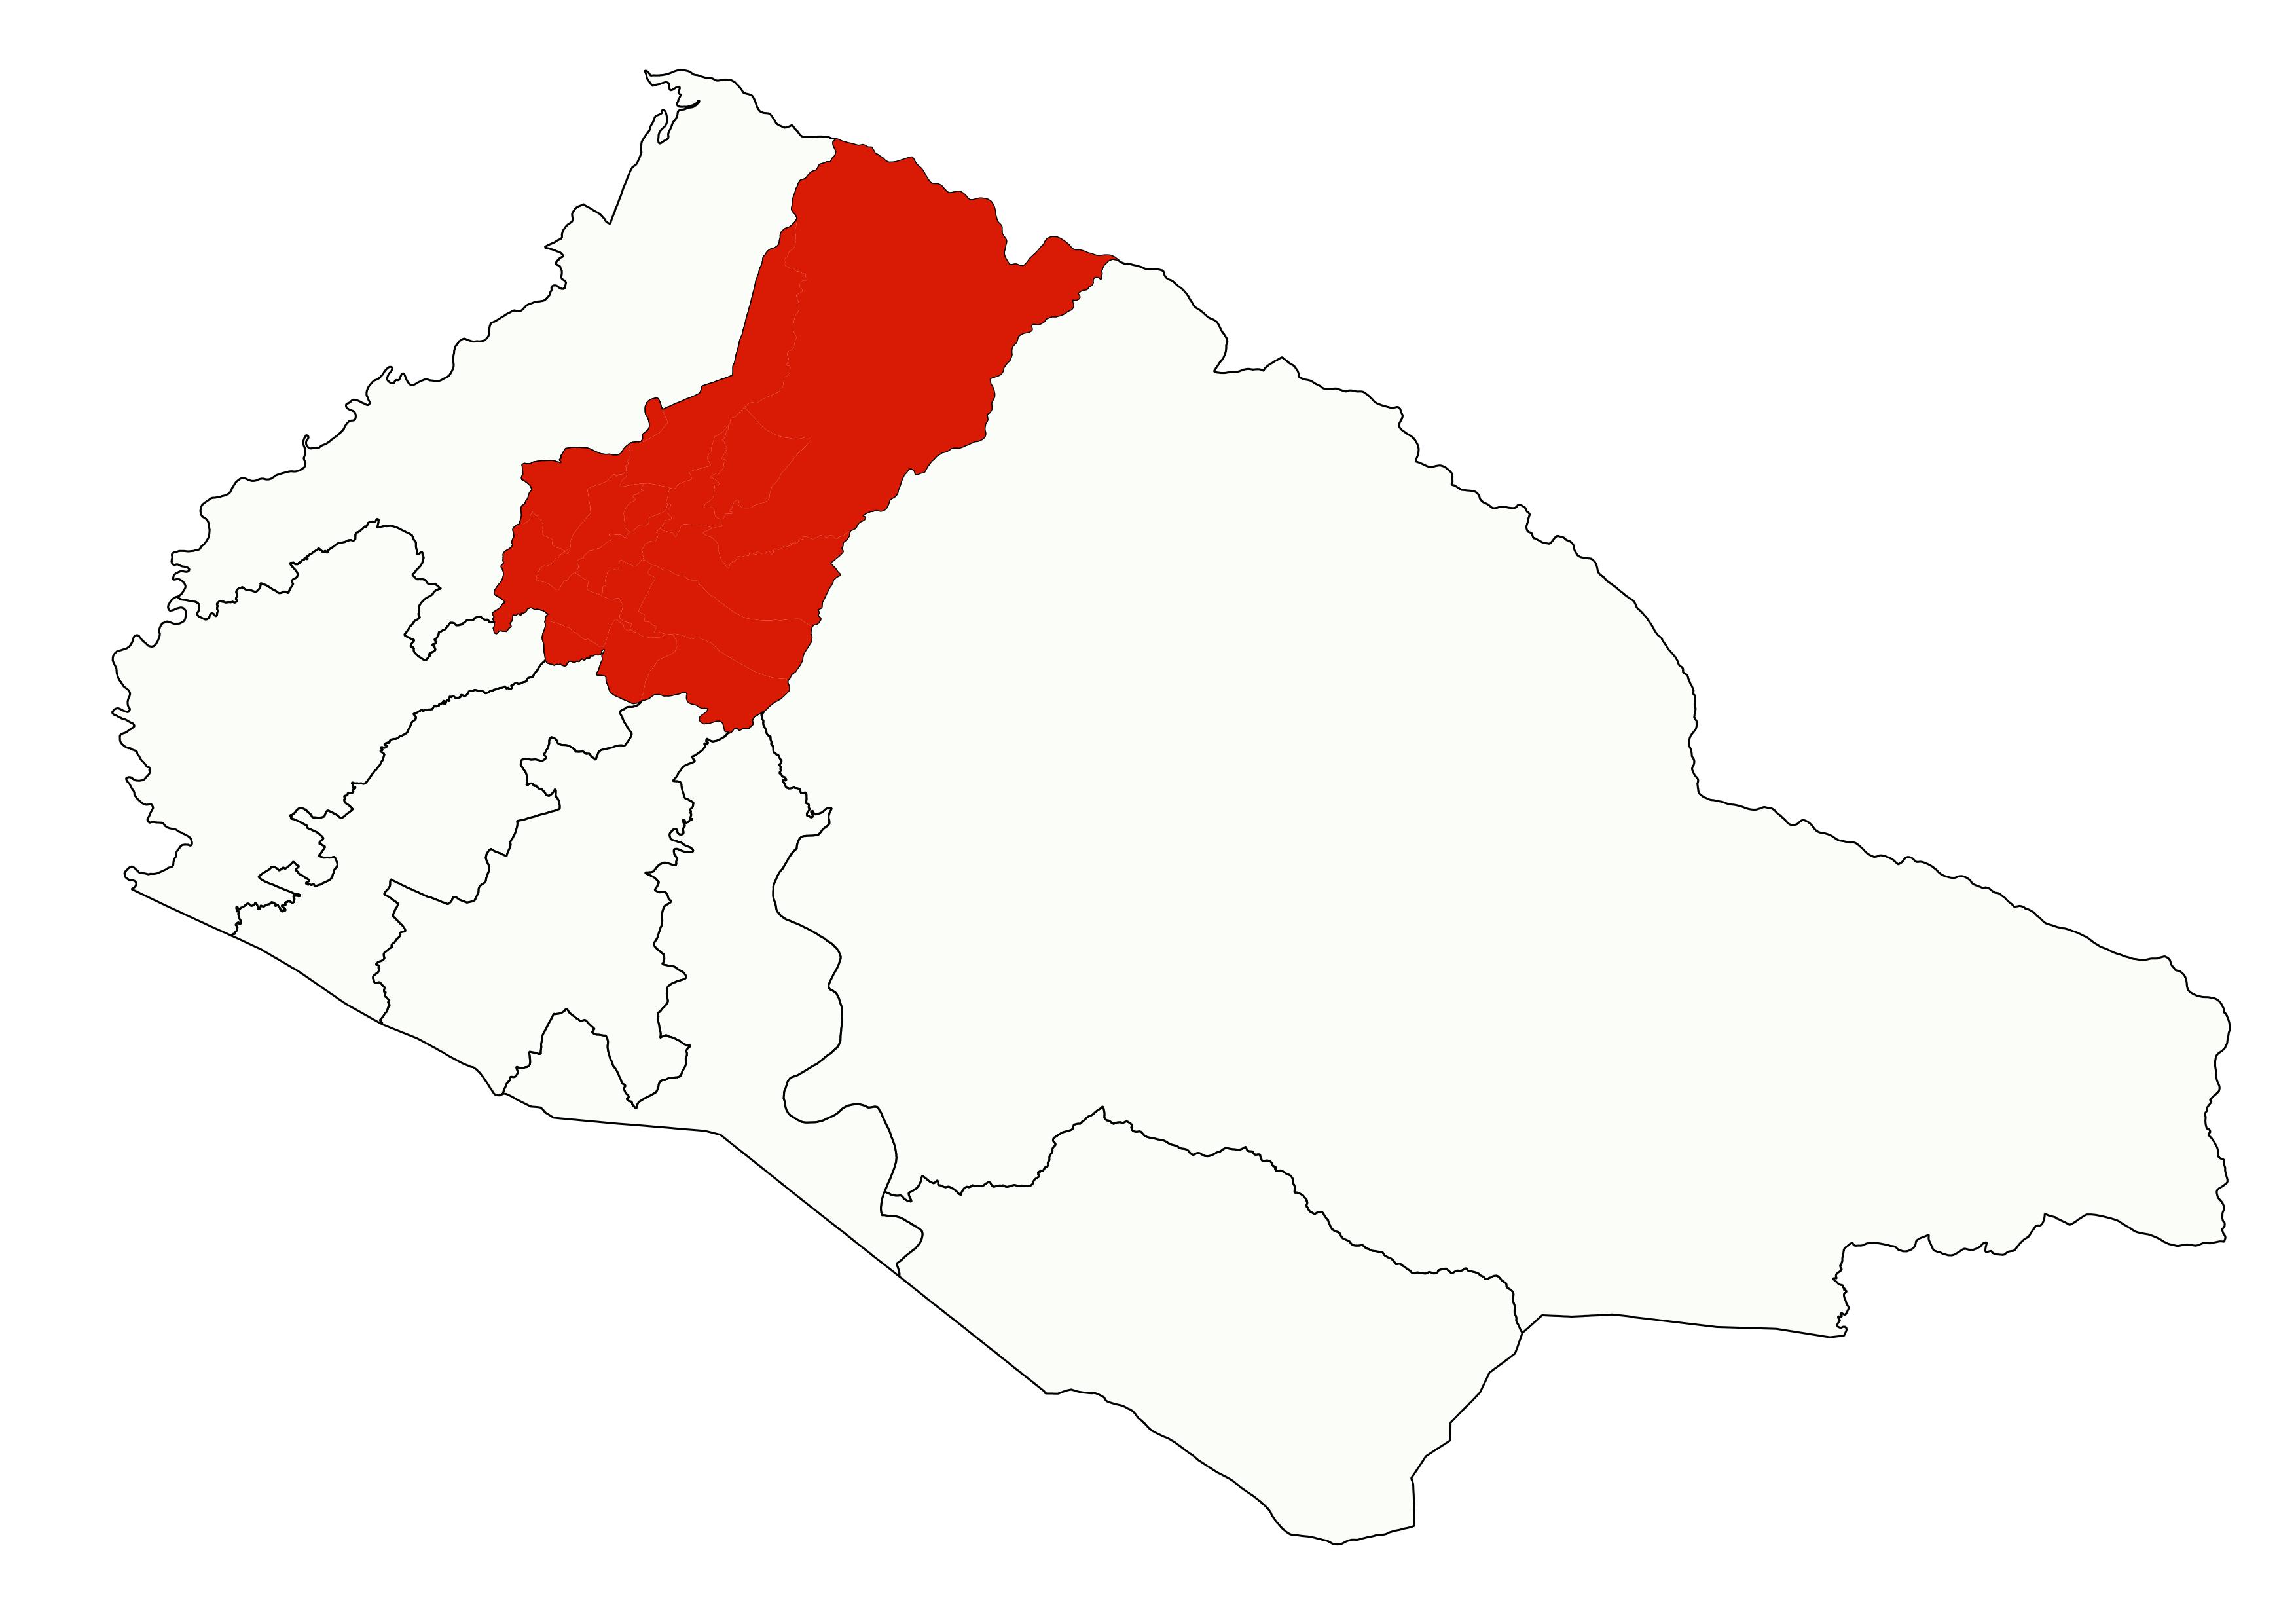
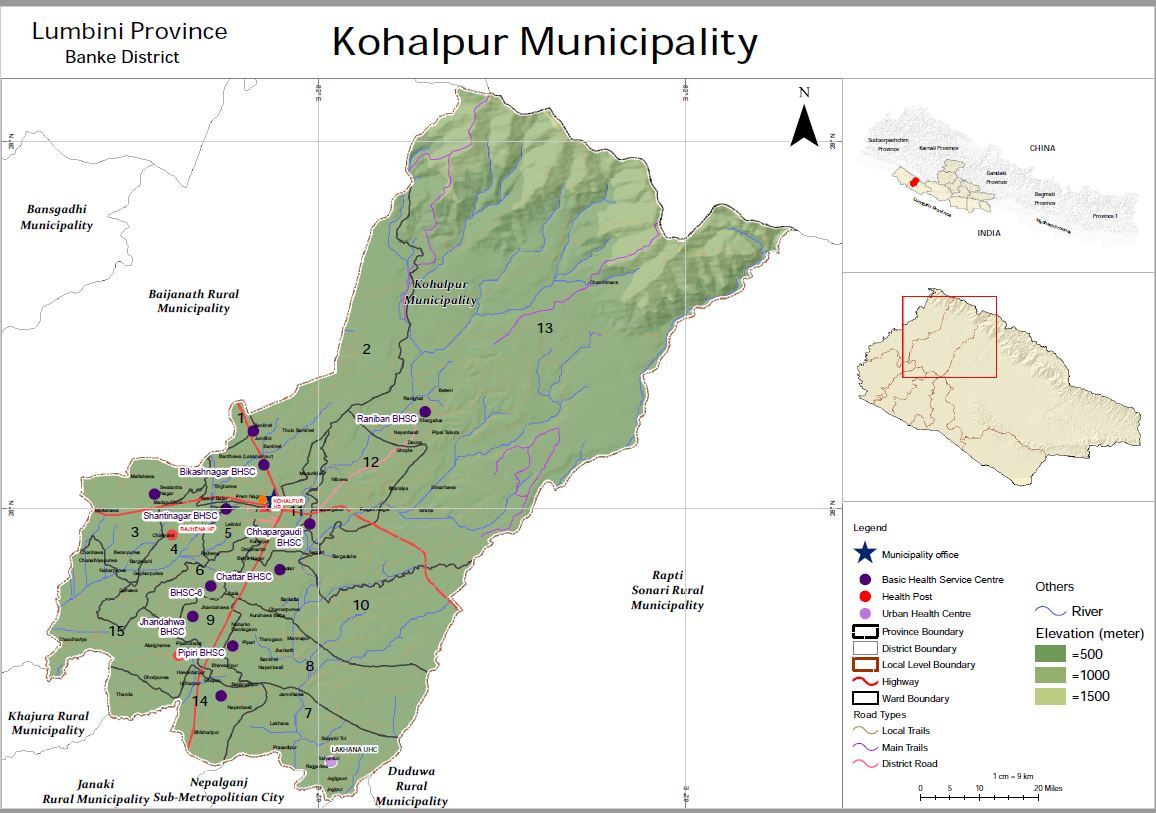
संघिय लोकतान्त्रिक गणतन्त्र नेपालको लुम्बिनी प्रदेश अन्तर्गत तराई क्षेत्रको बाके जिल्लाको उत्तर पश्चिम कुनामा अवस्थित कोहलपुर नगरपालिकाको पूर्वमा राप्तीसोनारी गाउँपालिका, पश्चिममा बैजनाथ गाउँपालिका, उत्तरमा सल्यान जिल्लाको चुरे पहाड श्रृंखला पर्दछ भने दक्षिणमा जानकी गाउँपालिका र नेपालगञ्ज उपमहानगरपालिका पर्दछ । विं. स. २०७१ वैशाख २५ गतेको नेपाल सरकार मन्त्रिपरिषदको निर्णय बमोजिम विं. स.२०७१ ज्येष्ठ ७ गते औपचारिक रुपमा साविकको रझेना गाविस र कोहलपुर गाविसको समायोजन भै कोहलपूर नगरपालिकाको स्थापना भएको हो । यस नगरपालिकाको क्षेत्रफल १८४.२६ वर्ग कि.मी. रहेको छ ।
जनसाङ्खिक सूचक
-
कूल जनसंख्या २
१००,२८९
२०७९ -
१ बर्ष भन्दा मुनिको जनसंख्या १
१,७३५
२०७९/८० -
पाँच बर्ष भन्दा मुनिको जनसंख्या १
८,७६१
२०७९/८० -
किशोरावस्था (१०-१९ बर्ष) को जनसंख्या १
१७,९७४
२०७९/८० -
प्रजनन उमेरका महिला (१५ -४९ बर्ष ) १
३१,८४८
२०७९/८० -
अनुमानित गर्भवती महिलाहरु १
२,१५१
२०७९/८० -
अनुमानित जिवित जन्मको संख्या १
१,६८६
२०७९/८० -
परिवारमा अनुपस्थित (विदेशमा बस्ने) जनसंख्या २
३,५४४
२०६८ -
मोबाइल फोन भएका घरधुरी (%) २
७८
२०६८ -
टेलिभिजन भएका घरधुरी (%) २
५४
२०६८ -
लैङ्गिक अनुपात २
९३
२०६८ -
१४ बर्ष र सो भन्दा कम उमेरका जनसंख्या १
२७,०१२
२०७९/८० -
६५ बर्ष र सो भन्दा माथि उमेरका जनसंख्या २
२,५४६
२०६८
उमेर र लिंगको आधारमा जनसंख्या वितरण
जनगणना २०६८जातिगत आधारमा जनसंख्या वितरण
जनगणना २०६८वार्ड अनुसार जनसंख्या वितरण
जनगणना २०६८स्वास्थ्य सेवा प्रवाह गर्ने संस्थाहरु
- अस्पताल १
- प्रास्वाके -
- स्वास्थ्य चौकी ३
- शहरी स्वास्थ्य केन्द्र १
- बर्थिंग सेन्टर २
सरकारी संस्था
- अस्पताल तथा नर्सिंग होम ७
- पोलिक्लिनिक ६
- औषधि पसल ३०
निजी (गैर-सरकारी संस्था समेत)
अन्य स्वास्थ्य केन्द्रहरु
- माइक्रोस्कोपी केन्द्र २
- एआरटि केन्द्र -
- एचाईभी परीक्षण केन्द्र -
- क्षयरोग उपचार केन्द्र ४
- आयुर्वेद अस्पताल/केन्द्र १
- आँखा अस्पताल/केन्द्र -
अस्पताल शैयाहरू
- सार्वजनिक १५
- निजी ५६५
थप सेवाहरू
- आधारभुत स्वास्थ्य सेवा केन्द्र ११
- सिकलसेल एनेमिया ल्याव १
वडा अनुसार स्वास्थ्य संस्थाको जानकारी
| स्वास्थ्यसंस्थाको नाम | वार्ड न | बर्थिंग सेन्टर BEONC/CEONC | महिला स्वास्थ्य स्वयं सेवक संख्या | दक्ष प्रसुतिकर्मी संख्या | परिवार नियोजन *सेवा | स्वीकृत दरबन्दी | दरबन्दी अनुसार पदपूर्ति | करारका कर्मचारी |
|---|---|---|---|---|---|---|---|---|
| काेहलपुर स्वास्थ्य चाैकी | ११ | बिर्थिंग केन्द्र | ४ | १ | ५ साधनहरू | ६ | ६ | ५ |
| रजेना स्वास्थ्य चाैकी | ४ | हाेइन | ३ | २ | ५ साधनहरू | ६ | ३ | - |
| शमशेरगञ्ज स्वास्थ्य चाैकी | १५ | बिर्थिंग केन्द्र | ८ | ४ | ५ साधनहरू | ६ | ७ | १ |
| आधारभुत स्वास्थ्य केन्द्र वार्ड नं १ | १ | हाेइन | २ | ० | ३ साधनहरू | - | - | २ |
| आधारभुत स्वास्थ्य केन्द्र वार्ड नं 2 | २ | हाेइन | ६ | १ | ३ साधनहरू | - | ४ | १ |
| आधारभुत स्वास्थ्य केन्द्र वार्ड नं 3 | ३ | हाेइन | ३ | ० | ३ साधनहरू | - | १ | २ |
| आधारभुत स्वास्थ्य केन्द्र वार्ड नं 5 | ५ | हाेइन | ४ | ० | ३ साधनहरू | - | १ | २ |
| अखना शहरी स्वास्थ्य केन्द्र | ७ | हाेइन | ६ | ० | ३ साधनहरू | - | १ | २ |
| आधारभुत स्वास्थ्य केन्द्र वार्ड नं 6 | ६ | हाेइन | ३ | १ | ३ साधनहरू | - | २ | १ |
| आधारभुत स्वास्थ्य केन्द्र वार्ड नं 8 | ८ | हाेइन | ४ | १ | ३ साधनहरू | - | १ | १ |
| आधारभुत स्वास्थ्य केन्द्र वार्ड नं 9 | ९ | हाेइन | ३ | १ | ३ साधनहरू | - | १ | २ |
| आधारभुत स्वास्थ्य केन्द्र वार्ड नं १0 | १० | हाेइन | ५ | ० | ३ साधनहरू | - | १ | १ |
| आधारभुत स्वास्थ्य केन्द्र वार्ड नं १२ | १२ | हाेइन | ५ | ० | ३ साधनहरू | - | २ | - |
| आधारभुत स्वास्थ्य केन्द्र वार्ड नं १३ | १३ | हाेइन | ७ | ० | ३ साधनहरू | - | २ | - |
| आधारभुत स्वास्थ्य केन्द्र वार्ड नं १४ | १४ | हाेइन | ८ | ० | ३ साधनहरू | - | - | २ |
| स्वास्थ्य शाखा | ११ | NO | ० | ० | ० साधनहरू | ३ | ५ | - |
| आयुर्बेद औषधालय | ११ | NO | ० | ० | ० साधनहरू | २ | २ | १ |
| आधारभुत अस्पताल | ११ | - | - | - | - | - | - | - |
| सिकलसेल | ११ | - | - | - | - | - | - | ४ |
| कुल कर्मचारी संख्या | ७१ | ११ | २३ | ३९ | २७ | |||
स्वास्थ्य सेवाको लागि मानव संसाधन
- CEONC साइटहरू१
- BEONC साइटहरू-
- आइयुसीडी तथा इम्पलान्ट सेवा प्रदायक९
- एकीकृत बालरोग व्यवस्थापन (IMCI) प्रशिक्षित कर्मचारी६६
- जनसंख्या (प्रति मस्वास्वका) १४१३
- जनसंख्या (प्रति स्वास्थ्यकर्मी) २५७२
- अनुमानित गर्भवति (प्रति दक्ष प्रसुतिकर्मी) १९६
- अनुमानित गर्भवति (प्रति बर्थिङ्ग सेन्टर) -
- जनसंख्या (प्रति स्वास्थ्य संस्था) (अस्पताल,प्रस्वाके र स्वाचौ सहित) -
- जनसंख्या (प्रति सरकारी अस्पताल) १००२८९
- जनसंख्या (प्रति अस्पताल र नर्सिंग होम (सबै) १२५३६
मातृशिशु बालस्वास्थ्य र परिवार नियोजन सेवा उपयोगको अवस्था
स्वास्थ्य सूचना व्यवस्थापन प्रणाली २०७९प्रमूख स्वास्थ्य सेवाहरूको उपयोगको तुलनात्मक अवस्था
| सूचक | कोहलपुर नगरपालिका | लुम्बिनी प्रदेश २०७८/७९ | राष्ट्रीय २०७८/७९ | |||
|---|---|---|---|---|---|---|
| २०७६/७७ | २०७७/७८ | २०७८/७९ | ||||
| खाेप |
ग्राफ
तालिका
|
|||||
| बि.सि.जि. कभरेज | ९५ | ११६.४ | ११७.३ | १०३.१ | १०३.५ | |
| २३ महिनाभित्र पूर्ण खोप प्राप्त गरेका बालबालिका (%) | ० | ० | ० | ० | ० | |
| डि.पि.टि. - हेप बि - हिव ३ कभरेज | ८८ | ९८.६ | ९५.७ | ९६.६ | ९५.२ | |
| दादुरा रूबेला १ (९-११ महिना) कभरेज | ९३ | ९२.७ | ९२.९ | ९६.७ | ९४.७ | |
| जे.इ कभरेज | ९८ | १०३.२ | ९४.४ | ९८.९ | ९५.९ | |
| टि.डी. २ र टि. डी. २+ कभरेज | ७८ | ६८.२ | ७२.७ | ७३.९ | ७१.७ | |
| पोषण |
ग्राफ
तालिका
|
|||||
| कम जन्म तौल भएका नवजात शिशुको प्रतिशत | २१.१ | २६.३ | २४.२ | १२ | ९.४ | |
| नयाँ तौल लिएका १ वर्ष मुनिका शिशुहरुको प्रतिशत | ४३ | १९.७ | ७३.२ | १०९ | १०४.१ | |
| नयाँ तौल लिएका २ वर्ष मुनिका शिशुहरु मध्ये अति जोखिम अवस्थाका बालबालिकाहरुको प्रतिशत | २.३ | ५.१ | ६.६ | ३.५ | ३.६ | |
| गर्भवती अवस्थामा १८० दिन आइरन चक्की प्राप्त गरेका गर्भवती महिलाहरुको प्रतिशत | ३८ | ३०.४ | ७५.२ | ७५.८ | ६० | |
| सुत्केरी अवस्थामा भिटामिन ए प्राप्त गरेका महिलाहरुको प्रतिशत | ९.५ | १३.४ | ३१० | ९८.२ | ७६.३ | |
| नवजात शिशु तथा बाल रोगको एकीकृत व्यस्थापन |
ग्राफ
तालिका
|
|||||
| नाभी मलम लगाएका नवजात शिशुको प्रतिशत | ६३ | ८३.३ | ९०.३ | ९४.२ | ८२.९ | |
| ब्याक्टेरियाको गम्भीर संक्रमण भएकामध्ये जेन्टामाईसिन सुईद्वारा पूर्ण उपचार पाएको प्रतिशत | ० | ३३.३ | ० | ३९.५ | ४७.४ | |
| नयाँ निमोनिया बिरामीको दर (प्रति हजार पाँच वर्षमुनिका बालबालिकाहरुमा) | २५ | ११.२ | ६ | २९.३ | ३६.८ | |
| नयाँ एआरआई (स्वाशप्रश्वाका) बिरामी मध्ये कडा निमोनिया भएका बिरामीको प्रतिशत | ० | ० | ० | ०.०५ | ०.१८ | |
| नयाँ झाडापखालाका बिरामीको दर (प्रति हजार पाँच वर्ष मुनिका बालबालिकाहरुमा) | २१६ | २५७ | २२७.३ | ३३९ | ३५२.४ | |
| ५ वर्ष मुनिका झाडापखालाका बिरामी मध्ये जिंक र पुनर्जलीय झोलबाट उपचार गरेको प्रतिशत | ९७.२ | १०० | १०० | ९८.७ | ९४.५ | |
| जम्मा नवजात शिशु मृत्यु संख्या | ६५ | ७० | ६२ | ५७३ | १९१४ | |
| सुरक्षित मातृत्व तथा परिवार नियोजन |
ग्राफ
तालिका
|
|||||
| प्परोटोकल अनुसार पहिलो पटक गर्भवती जाँच गराएका गर्भवती महिलाहरुको प्रतिशत | ६७ | ६२.८ | ८४.६ | ९३.५ | ९१.४ | |
| प्रजनन् उमेरका महिलाहरुमा परिवार नियोजनको प्रयोगकर्ता दर (आधुनिक साधन) | ० | ० | ० | ० | ० | |
| ४ पटक गर्भवती जाँच (महिना: ४,६,८,९/हप्ता: १६, २०-२४,३२ र ३६) महिलाहरुको प्रतिशत | १०२ | ७५.९ | १२१.२ | ७९.७ | ७९.४ | |
| स्वास्थ्य संस्था प्रसुति दर | ३३३ | २७७.६ | ३५२.६ | ९४.२ | ७९ | |
| दक्ष प्रसुतिकर्मी/स्वास्थ्यकर्मीद्वारा प्रसुति गराएको प्रतिशत | ३३३ | २७७.६ | ३२५.१ | ८९.८ | ७५ | |
| प्रोटोकल अनुसार ४ पटक (आ.व २०७८/७९ सम्म ३ पटक) सुत्केरी जाँच गराउने आमाहरुको प्रतिशत | ९ | ५.४ | १२.९ | ५३.७ | ४०.८ | |
| जम्मा मातृ मृत्यु संख्या | ० | १ | ११ | ७४ | २३१ | |
| परिवार नियोजन सेवाका नयाँ सेवाग्राही दर (प्रजनन उमेरका महिलाहरु मध्ये) | २० | १६.४ | १५.४ | १२.४ | ११.५ | |
| औलो रोग, क्षय रोग, कुष्ठरोग र एचआईभी |
ग्राफ
तालिका
|
|||||
| औलोको स्लाइड नमुना पोजेटिभ दर | ०.०५ | ०.१ | ०.१४ | ०.२७ | ०.१७ | |
| डेंगुको जम्मा विरामी संख्या | ० | ० | ० | ० | ० | |
| आयातित औलोरोगको प्रतिशत (नयाँ औलो रोग मध्ये | १०० | १०० | १०० | ९५.५ | ८९.५ | |
| जम्मा औलो रोग मध्ये प्लाज्मोडियम फाल्सिपारमको अनुपात | ५० | १०० | १०० | ३८.७ | २२.८ | |
| नयाँ क्षयरोगी बिरामी पत्ता लागेको दर | १५१ | १५९.२ | १८२.८ | १५७.४ | १२९.१ | |
| क्षयरोगको उपचार सफलता दर | ९६ | ९०.७ | ९६.४ | ९१ | ९१.५ | |
| कुष्ठरोगको रोग प्रकोप दर (प्रति १०००० मा) | १.७ | ०.९ | १.८ | ०.९ | ० | |
| ए. आर. टी. उपचारमा रहेका जम्मा एच. आइ. भी. पोजेटिभको संख्या | ० | ० | ० | ४३२६ | २२१५२ | |
| उपचारात्मक सेवा |
ग्राफ
तालिका
|
|||||
| ओ पि डी मा आएका बिरामी मध्ये नयाँ बिरामीको दर | ७८.५ | ७५.५ | ६८.२ | ९४.५ | ९२ | |
शीर्ष १० स्वास्थ्य अवस्थाको सूची
स्वास्थ्य सूचना व्यवस्थापन प्रणाली २०७८-७९स्वास्थ्य क्षेत्रमा बजेट
- सशर्त स्वास्थ्यमा छुट्याएको बजेट
- समानीकरणबाट विनियोजित स्वास्थ्य बजेट
- अन्य श्रोतबाट बिनियोजित स्वास्थ्य बजेट
| बजेट | कोहलपुर नगरपालिका | |||||
|---|---|---|---|---|---|---|
| २०७७/७८ | २०७८/७९ | २०७९/८० | ||||
| ग्राफ | ||||||
| पालिकाको कुल बजेट (रु ) | १,०४२,५५७,३३० | ९०३,५३४,८५२ | १,१६७,६००,००० | |||
| स्वास्थ्य बजेट (सबै स्रोत) | ९२,०४८,६०० | ९३,८३९,००० | ८४,४००,००० | |||
| सशर्त स्वास्थ्यमा छुट्याएको बजेट | ६१,१००,००० | ६६,६८३,००० | ६५,९००,००० | |||
| समानीकरणबाट विनियोजित स्वास्थ्य बजेट | ३०,८९६,००० | २७,१५६,००० | १४,५००,००० | |||
| अन्य श्रोतबाट बिनियोजित स्वास्थ्य बजेट | ५२,६०० | - | ४,०००,००० | |||
| बजेट खर्च (%) | ६४ | ७३ | - | |||
| तालिका | ||||||
महत्वपूर्ण सम्पर्क
Kohalpur Municipality
ठेगाना : काेहाेलपुर नगरपालिका
टेलिफोन : ०८१५४००९
वेबसाइट : http://www.kohalpurmun.gov.np/en
नगर प्रमुख
नाम : पुर्ण प्रसाद आचार्य
सम्पर्क : ९८५१२००६००
नगर उप प्रमुख
नाम : संगिता सुवेदी
सम्पर्क : ९८५८०२६८२९
ईमेल : deputy.mayor@kohalpurmun.gov.np; poudelsangita829@gmail.com
प्रमुख प्रशासकिय अधिकृत
नाम : टिकाराम ढकाल
सम्पर्क : ९८५८०६७१११

यो प्रोफाइल अमेरिकी अन्तर्राष्ट्रिय विकास नियोग (युएसएआइडी) मार्फत अमेरिकी जनताहरुको सहयोगका कारण सम्भव बनेको हो । यो प्रतिवेदन भित्रका विषयवस्तु र सामग्री स्वास्थ्यका लागि सक्षम प्रणालीका एकल जिम्मेवारी हुन् र तिनले युएसएआइडी वा अमेरिकी सरकारको विचारको प्रतिविम्बित गर्छन् भन्ने जरुरी छैन ।