संक्षिप्त परिचय कृष्णनगर नगरपालिका
कृष्णनगर नगरपालिका नेपालकाे पश्चिमाअञ्चल विकास क्षेत्रअन्तर्गत लुम्विनि अञ्चलमा पर्ने कपिलबस्तु जिल्लामा अवस्थित एक नगरपालिका हो । कृष्णनगर बजार रहेको ठाँउलाई नगरपालिकाको केन्द्र बनाइएको छ। यो नगरपालिका २०६८ साउन १ देखि लागू हुने गरी बनाइएको हो तर कार्यन्वयनमा हाल २०७१ जेष्ठ ४ देखि आएको हो । यसलाई नगरपालिका घोषणा गर्दा कृष्णनगर, शिवराज र सिर्सिहवा गाउँ विकास समितिहरू समावेश गरिएका हुन् ।
कृष्णनगर,शिवराज र सिर्सिहवा गाविसहरूलाई मिलाएर कृष्णनगर नगरपालिका बनाइएको हो । बि.स.२०६८ को जनगणना अनुसार कृष्णनगर नगरपालिकाको जनसङ्ख्या ६२३६० रहेको छ ।
यो पूर्व मा महाराजगंज नगरपालिका, दक्षिण र पश्चिम मा भारत, उत्तर मा शिवराज नगरपालिका र विजयनगर गाउँपालिका द्वारा घेरिएको छ। यो जिल्ला मुख्यालय ताैलिहवा बाट २ किमी को दूरी मा स्थित छ।
जनसाङ्खिक सूचक
-
कूल जनसंख्या ७
७२,९९५
/ -
१ बर्ष भन्दा मुनिको जनसंख्या ७
१,६५२
/ -
पाँच बर्ष भन्दा मुनिको जनसंख्या ७
८,२३८
/ -
किशोरावस्था (१०-१९ बर्ष) को जनसंख्या ७
१४,३७८
/ -
प्रजनन उमेरका महिला (१५ -४९ बर्ष ) ७
१९,२२९
/ -
अनुमानित गर्भवती महिलाहरु ७
२,०३५
/ -
अनुमानित जिवित जन्मको संख्या ७
१,६२७
/ -
परिवारमा अनुपस्थित (विदेशमा बस्ने) जनसंख्या २
१,३१५
-
मोबाइल फोन भएका घरधुरी (%) २
२,२५१
-
टेलिभिजन भएका घरधुरी (%) २
२,००७
-
लैङ्गिक अनुपात २
१०७
-
१४ बर्ष र सो भन्दा कम उमेरका जनसंख्या २
८,२६६
-
६५ बर्ष र सो भन्दा माथि उमेरका जनसंख्या २
२,८९८
उमेर र लिंगको आधारमा जनसंख्या वितरण
जनगणना २०६८जातिगत आधारमा जनसंख्या वितरण
जनगणना २०६८वार्ड अनुसार जनसंख्या वितरण
जनगणना २०६८स्वास्थ्य सेवा प्रवाह गर्ने संस्थाहरु
- अस्पताल १
- प्रास्वाके -
- स्वास्थ्य चौकी ९
- सामुदायिक स्वास्थ्य ईकाई -
- शहरी स्वास्थ्य केन्द्र २
- गाउँघर क्लिनिक ४६
- खोप क्लिनिक ५०
- आधारभूत स्वस्थ सेवाकेन्द्र -
- बर्थिंग सेन्टर ३
सरकारी संस्था
- अस्पताल तथा नर्सिंग होम -
- पोलिक्लिनिक -
- औषधि पसल ८
निजी (गैर-सरकारी संस्था समेत)
अन्य स्वास्थ्य केन्द्रहरु
- माइक्रोस्कोपी केन्द्र १
- एआरटि केन्द्र -
- एचाईभी परीक्षण केन्द्र -
- क्षयरोग उपचार केन्द्र १०
- आयुर्वेद अस्पताल/केन्द्र १
- आँखा अस्पताल/केन्द्र ३
अस्पताल शैयाहरू
- सार्वजनिक १५
- निजी -
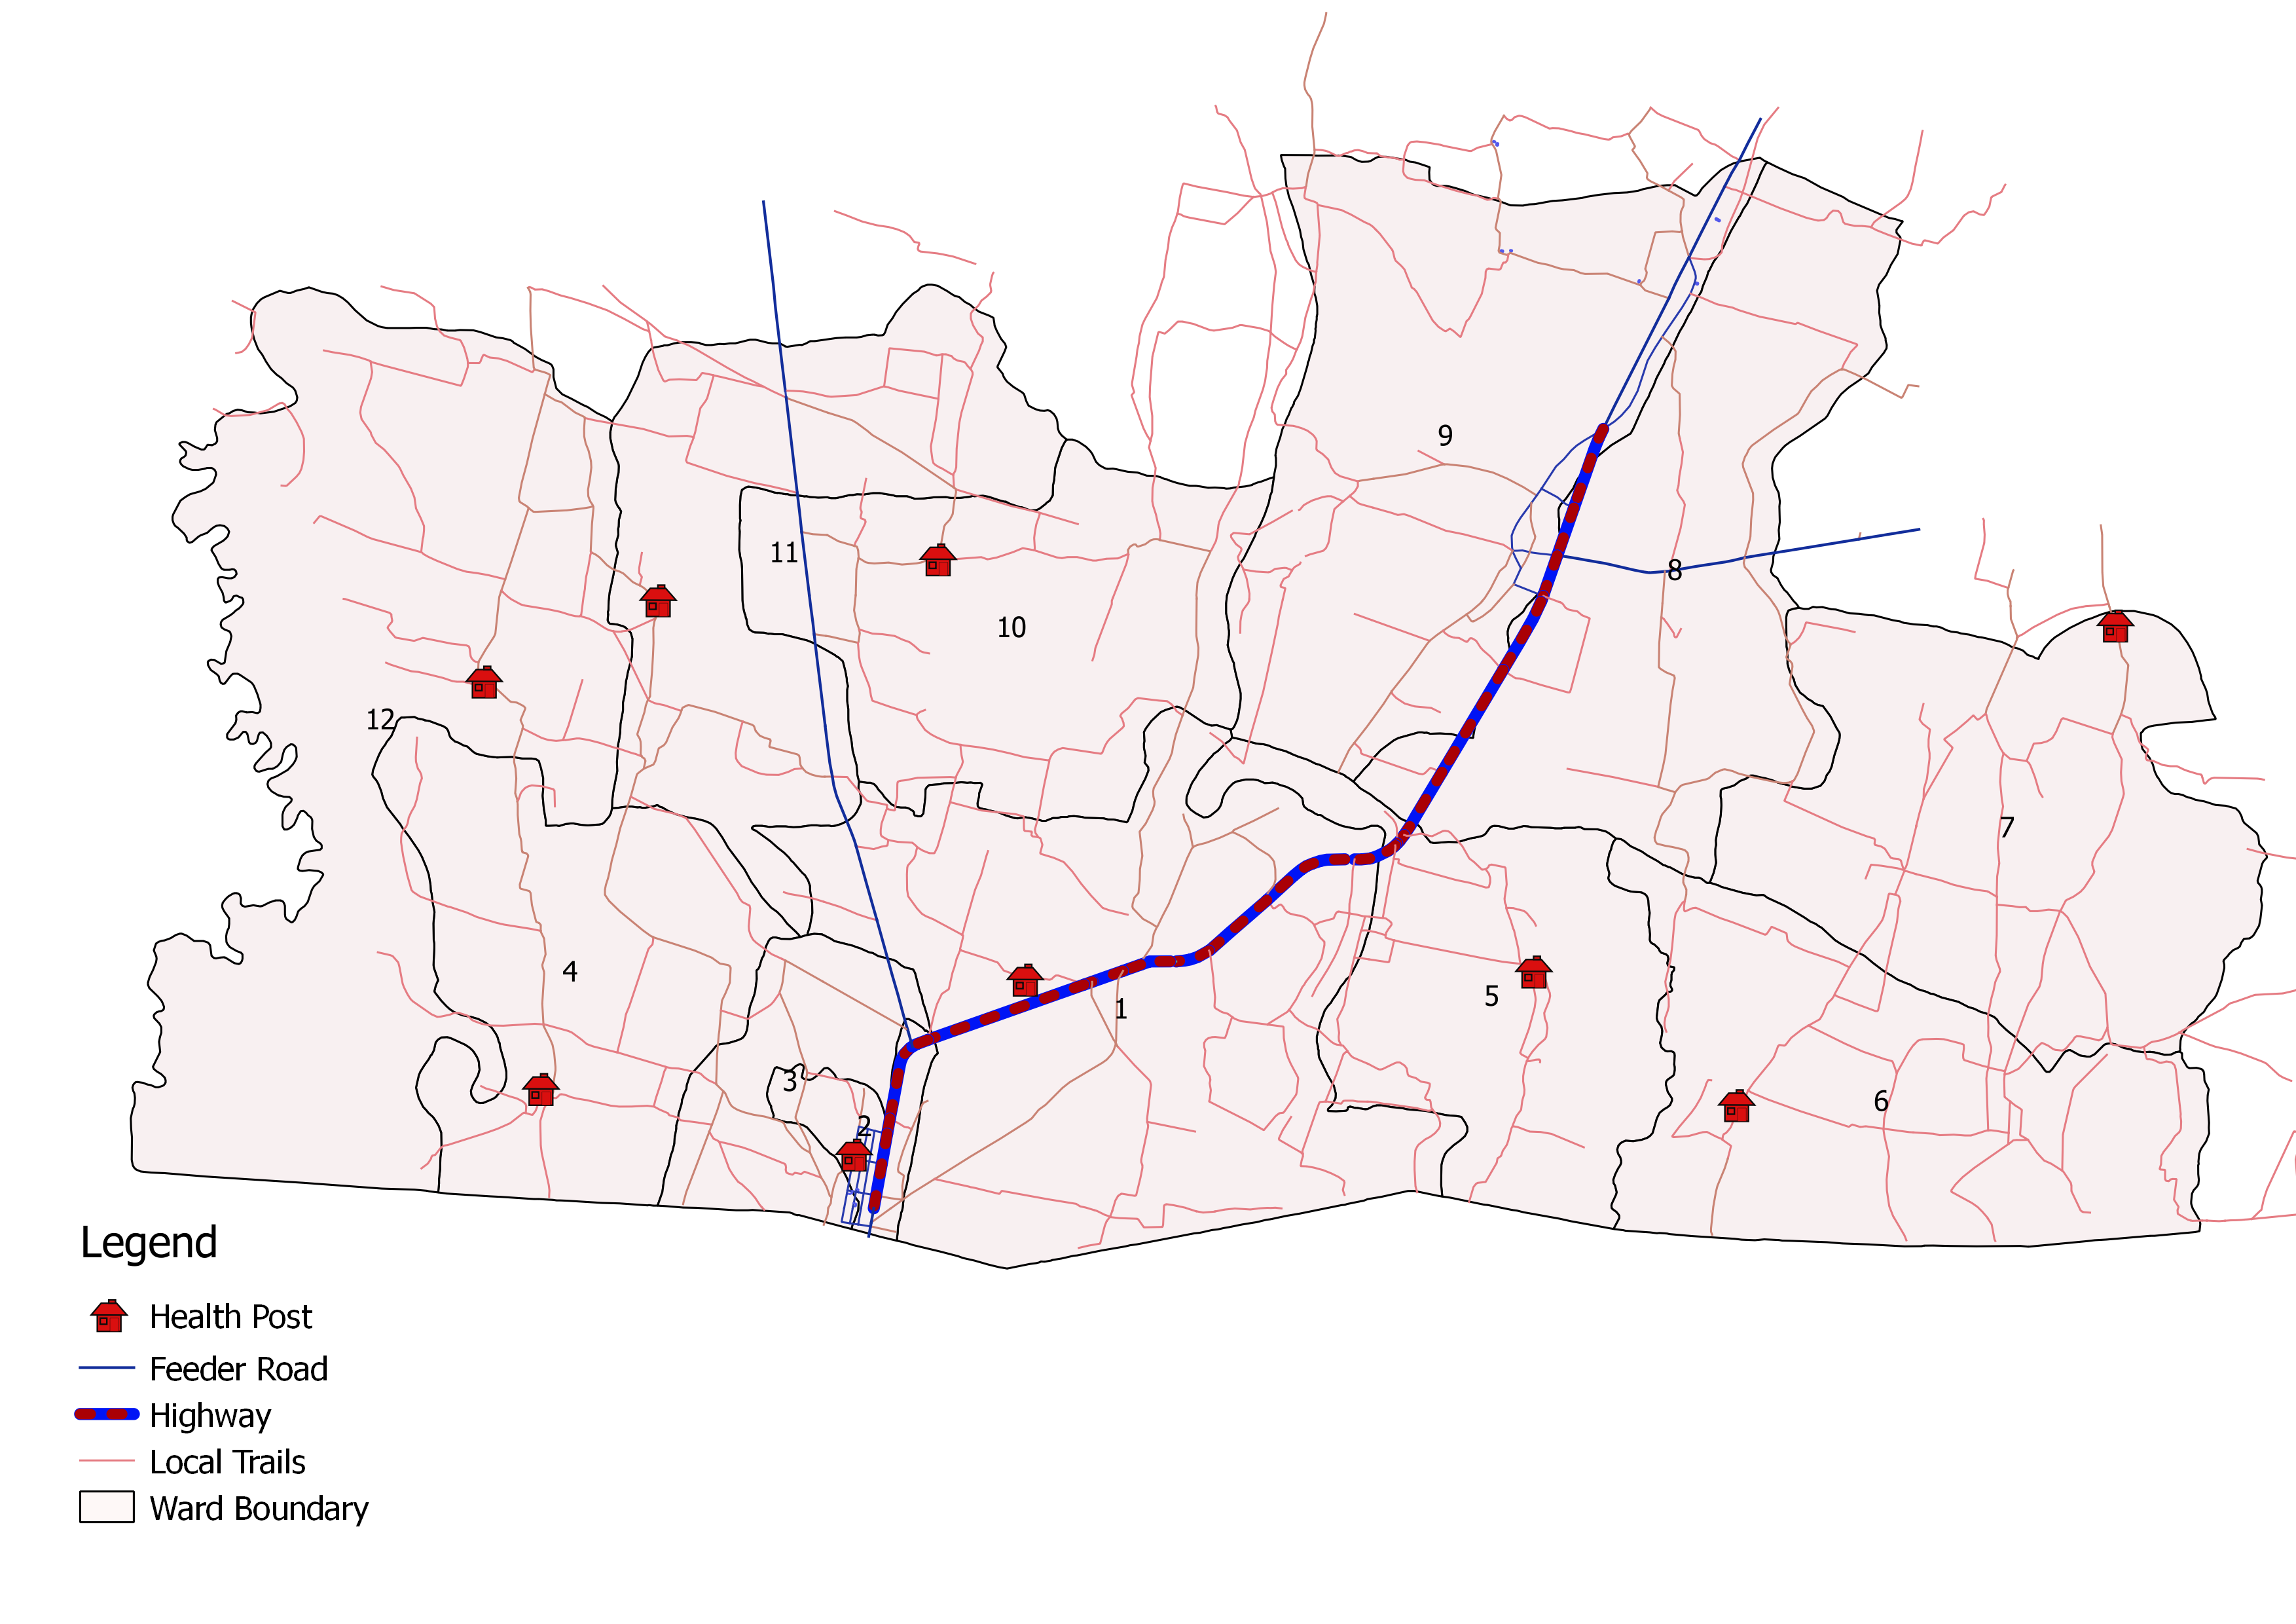
वडा अनुसार स्वास्थ्य संस्थाको जानकारी
| स्वास्थ्यसंस्थाको नाम | वार्ड न | बर्थिंग सेन्टर BEONC/CEONC | महिला स्वास्थ्य स्वयं सेवक संख्या | दक्ष प्रसुतिकर्मी संख्या | परिवार नियोजन *सेवा | स्वीकृत दरबन्दी | दरबन्दी अनुसार पदपूर्ति | करारका कर्मचारी |
|---|---|---|---|---|---|---|---|---|
| शिभानगर स्वा.चाै | १ | - | ११ | ० | ३ साधनहरू | ६ | २ | ३ |
| कृण्नगर स्वा.चाै | ३ | प्रशुती केन्द | १२ | २ | ५ साधनहरू | ६ | ३ | ४ |
| शिर्शीहवा स्वा.चाै | ४ | - | १० | ० | ३ साधनहरू | ६ | १ | २ |
| पूर्साेतमपूर स्वा.चाै | ५ | - | ९ | ० | ३ साधनहरू | ६ | ३ | १ |
| भेल्मि स्वा.चाै | ६ | - | १५ | ० | ३ साधनहरू | ६ | ३ | १ |
| अजिगया स्वा.चाै | ७ | - | १० | ३ | ५ साधनहरू | ६ | १ | ३ |
| शिवराज अस्पताल | ८ | १५ | ३ | ५ साधनहरू | २८ | ७ | १६ | |
| भिद्यानगर स्वा.चाै | ९ | - | ११ | ० | ३ साधनहरू | ६ | ३ | २ |
| रामनगर स्वा.चाै | ११ | - | १० | ० | ३ साधनहरू | ६ | १ | २ |
| भगवानपूर स्वा.चाै | १२ | प्रशुती केन्द | १० | १ | ३ साधनहरू | ६ | २ | ४ |
| मनिपाैरा शहरी स्वास्थ्य केन्द्र | १ | - | - | ० | ३ साधनहरू | - | - | १ |
| हरीहरपू शहरी स्वास्थ्य केन्द्र | १२ | - | - | ० | ३ साधनहरू | - | - | १ |
| कुल कर्मचारी संख्या | ११३ | ९ | ८२ | २६ | ४० | |||
स्वास्थ्य सेवाको लागि मानव संसाधन
- CEONC साइटहरू-
- BEONC साइटहरू-
- आइयुसीडी तथा इम्पलान्ट सेवा प्रदायक-
- एकीकृत बालरोग व्यवस्थापन (IMCI) प्रशिक्षित कर्मचारी-
- जनसंख्या (प्रति मस्वास्वका) ६४६
- जनसंख्या (प्रति स्वास्थ्यकर्मी) २८०८
- अनुमानित गर्भवति (प्रति दक्ष प्रसुतिकर्मी) २२६
- अनुमानित गर्भवति (प्रति बर्थिङ्ग सेन्टर) ६७८
- जनसंख्या (प्रति स्वास्थ्य संस्था) (अस्पताल,प्रस्वाके र स्वाचौ सहित) -
- जनसंख्या (प्रति सरकारी अस्पताल) ७२९९५
- जनसंख्या (प्रति अस्पताल र नर्सिंग होम (सबै) ७२९९५
मातृशिशु बालस्वास्थ्य र परिवार नियोजन सेवा उपयोगको अवस्था
स्वास्थ्य सूचना व्यवस्थापन प्रणाली २०७९प्रमूख स्वास्थ्य सेवाहरूको उपयोगको तुलनात्मक अवस्था
| सूचक | कृष्णनगर नगरपालिका | लुम्बिनी प्रदेश २०७८/७९ | राष्ट्रीय २०७८/७९ | |||
|---|---|---|---|---|---|---|
| २०७६/७७ | २०७७/७८ | २०७८/७९ | ||||
| खाेप |
ग्राफ
तालिका
|
|||||
| बि.सि.जि. कभरेज | ८८.९ | ९९ | ८२ | १०३.१ | १०३.५ | |
| २३ महिनाभित्र पूर्ण खोप प्राप्त गरेका बालबालिका (%) | ० | ० | ० | ० | ० | |
| डि.पि.टि. - हेप बि - हिव ३ कभरेज | ७३ | ९० | ८१.४ | ९६.६ | ९५.२ | |
| दादुरा रूबेला १ (९-११ महिना) कभरेज | ७०.७ | ८३.४ | ७७ | ९६.७ | ९४.७ | |
| जे.इ कभरेज | ६०.९ | ७८ | ८३ | ९८.९ | ९५.९ | |
| टि.डी. २ र टि. डी. २+ कभरेज | ६८.८ | ८० | ७६ | ७३.९ | ७१.७ | |
| पोषण |
ग्राफ
तालिका
|
|||||
| कम जन्म तौल भएका नवजात शिशुको प्रतिशत | १४.४ | ९ | १०.५ | १२ | ९.४ | |
| नयाँ तौल लिएका १ वर्ष मुनिका शिशुहरुको प्रतिशत | ५१.२ | ६३ | ६६ | १०९ | १०४.१ | |
| नयाँ तौल लिएका २ वर्ष मुनिका शिशुहरु मध्ये अति जोखिम अवस्थाका बालबालिकाहरुको प्रतिशत | ४ | ४ | ८ | ३.५ | ३.६ | |
| गर्भवती अवस्थामा १८० दिन आइरन चक्की प्राप्त गरेका गर्भवती महिलाहरुको प्रतिशत | २३.२ | ३८ | ४९ | ७५.८ | ६० | |
| सुत्केरी अवस्थामा भिटामिन ए प्राप्त गरेका महिलाहरुको प्रतिशत | ८१.६ | ६७ | ९७ | ९८.२ | ७६.३ | |
| नवजात शिशु तथा बाल रोगको एकीकृत व्यस्थापन |
ग्राफ
तालिका
|
|||||
| नाभी मलम लगाएका नवजात शिशुको प्रतिशत | ४३.३ | ८६ | ९२ | ९४.२ | ८२.९ | |
| ब्याक्टेरियाको गम्भीर संक्रमण भएकामध्ये जेन्टामाईसिन सुईद्वारा पूर्ण उपचार पाएको प्रतिशत | ० | ० | ० | ३९.५ | ४७.४ | |
| नयाँ निमोनिया बिरामीको दर (प्रति हजार पाँच वर्षमुनिका बालबालिकाहरुमा) | २१.६ | ३९ | ८० | २९.३ | ३६.८ | |
| नयाँ एआरआई (स्वाशप्रश्वाका) बिरामी मध्ये कडा निमोनिया भएका बिरामीको प्रतिशत | ० | .५४ | .५९ | ०.०५ | ०.१८ | |
| नयाँ झाडापखालाका बिरामीको दर (प्रति हजार पाँच वर्ष मुनिका बालबालिकाहरुमा) | २४७.८ | ३३८ | २९२.५ | ३३९ | ३५२.४ | |
| ५ वर्ष मुनिका झाडापखालाका बिरामी मध्ये जिंक र पुनर्जलीय झोलबाट उपचार गरेको प्रतिशत | १०४ | ९४ | ९० | ९८.७ | ९४.५ | |
| जम्मा नवजात शिशु मृत्यु संख्या | १३ | १ | ० | ५७३ | १९१४ | |
| सुरक्षित मातृत्व तथा परिवार नियोजन |
ग्राफ
तालिका
|
|||||
| प्परोटोकल अनुसार पहिलो पटक गर्भवती जाँच गराएका गर्भवती महिलाहरुको प्रतिशत | ७३.९ | ७८ | ९६ | ९३.५ | ९१.४ | |
| प्रजनन् उमेरका महिलाहरुमा परिवार नियोजनको प्रयोगकर्ता दर (आधुनिक साधन) | ० | ० | ० | ० | ० | |
| ४ पटक गर्भवती जाँच (महिना: ४,६,८,९/हप्ता: १६, २०-२४,३२ र ३६) महिलाहरुको प्रतिशत | ३८.५ | ४५ | ५१ | ७९.७ | ७९.४ | |
| स्वास्थ्य संस्था प्रसुति दर | ९८.९ | १०९ | ८५ | ९४.२ | ७९ | |
| दक्ष प्रसुतिकर्मी/स्वास्थ्यकर्मीद्वारा प्रसुति गराएको प्रतिशत | २२.३ | १०९ | ८६ | ८९.८ | ७५ | |
| प्रोटोकल अनुसार ४ पटक (आ.व २०७८/७९ सम्म ३ पटक) सुत्केरी जाँच गराउने आमाहरुको प्रतिशत | ० | ४५ | ५७ | ५३.७ | ४०.८ | |
| जम्मा मातृ मृत्यु संख्या | ७.३ | ० | ० | ७४ | २३१ | |
| परिवार नियोजन सेवाका नयाँ सेवाग्राही दर (प्रजनन उमेरका महिलाहरु मध्ये) | ०.३८ | ११ | १२ | १२.४ | ११.५ | |
| औलो रोग, क्षय रोग, कुष्ठरोग र एचआईभी |
ग्राफ
तालिका
|
|||||
| औलोको स्लाइड नमुना पोजेटिभ दर | १०० | ०.२९ | ०.७५ | ०.२७ | ०.१७ | |
| डेंगुको जम्मा विरामी संख्या | ० | ० | ० | ० | ० | |
| आयातित औलोरोगको प्रतिशत (नयाँ औलो रोग मध्ये | २० | १०० | ६६ | ९५.५ | ८९.५ | |
| जम्मा औलो रोग मध्ये प्लाज्मोडियम फाल्सिपारमको अनुपात | ६७.७ | ० | ० | ३८.७ | २२.८ | |
| नयाँ क्षयरोगी बिरामी पत्ता लागेको दर | ८५.७ | ९४ | १५६ | १५७.४ | १२९.१ | |
| क्षयरोगको उपचार सफलता दर | ०.१४ | ९१ | ९३ | ९१ | ९१.५ | |
| कुष्ठरोगको रोग प्रकोप दर (प्रति १०००० मा) | ०.१४ | ०.६८ | १.८ | ०.९ | ० | |
| ए. आर. टी. उपचारमा रहेका जम्मा एच. आइ. भी. पोजेटिभको संख्या | ० | ० | ० | ४३२६ | २२१५२ | |
| उपचारात्मक सेवा |
ग्राफ
तालिका
|
|||||
| ओ पि डी मा आएका बिरामी मध्ये नयाँ बिरामीको दर | ५३.९ | ५६ | ५३ | ९४.५ | ९२ | |
शीर्ष १० स्वास्थ्य अवस्थाको सूची
स्वास्थ्य सूचना व्यवस्थापन प्रणाली २०७९स्वास्थ्य क्षेत्रमा बजेट
- सशर्त स्वास्थ्यमा छुट्याएको बजेट
- समानीकरणबाट विनियोजित स्वास्थ्य बजेट
- अन्य श्रोतबाट बिनियोजित स्वास्थ्य बजेट
| बजेट | कृष्णनगर नगरपालिका | |||||
|---|---|---|---|---|---|---|
| २०७७/७८ | २०७८/७९ | २०७९/८० | ||||
| ग्राफ | ||||||
| पालिकाको कुल बजेट (रु ) | ९९७,७०४,६६६ | ७८४,८१९,००० | ७६३,२४५,००० | |||
| स्वास्थ्य बजेट (सबै स्रोत) | ८३,२००,००० | ८०,०५५,००० | ८८,५००,००० | |||
| सशर्त स्वास्थ्यमा छुट्याएको बजेट | ७६,२५०,००० | ७१,३००,००० | ७२,९००,००० | |||
| समानीकरणबाट विनियोजित स्वास्थ्य बजेट | ६,९५०,००० | ८,७५५,००० | १५,६००,००० | |||
| अन्य श्रोतबाट बिनियोजित स्वास्थ्य बजेट | ||||||
| बजेट खर्च (%) | ८३,२००,००० | ८०,०५५,००० | ८८,५००,००० | |||
| तालिका | ||||||
महत्वपूर्ण सम्पर्क
Krishnanagar Municipality
ठेगाना : नगर कार्यपालिकाकाे कायार्लय, कृण्णनगर, कपिलबस्तु, लुम्बिनी प्रदेश, नेपाल
टेलिफोन : ९८४७९२९५८८
वेबसाइट : https://krishnanagarmun.gov.np

यो प्रोफाइल अमेरिकी अन्तर्राष्ट्रिय विकास नियोग (युएसएआइडी) मार्फत अमेरिकी जनताहरुको सहयोगका कारण सम्भव बनेको हो । यो प्रतिवेदन भित्रका विषयवस्तु र सामग्री स्वास्थ्यका लागि सक्षम प्रणालीका एकल जिम्मेवारी हुन् र तिनले युएसएआइडी वा अमेरिकी सरकारको विचारको प्रतिविम्बित गर्छन् भन्ने जरुरी छैन ।