संक्षिप्त परिचय लमही नगरपालिका
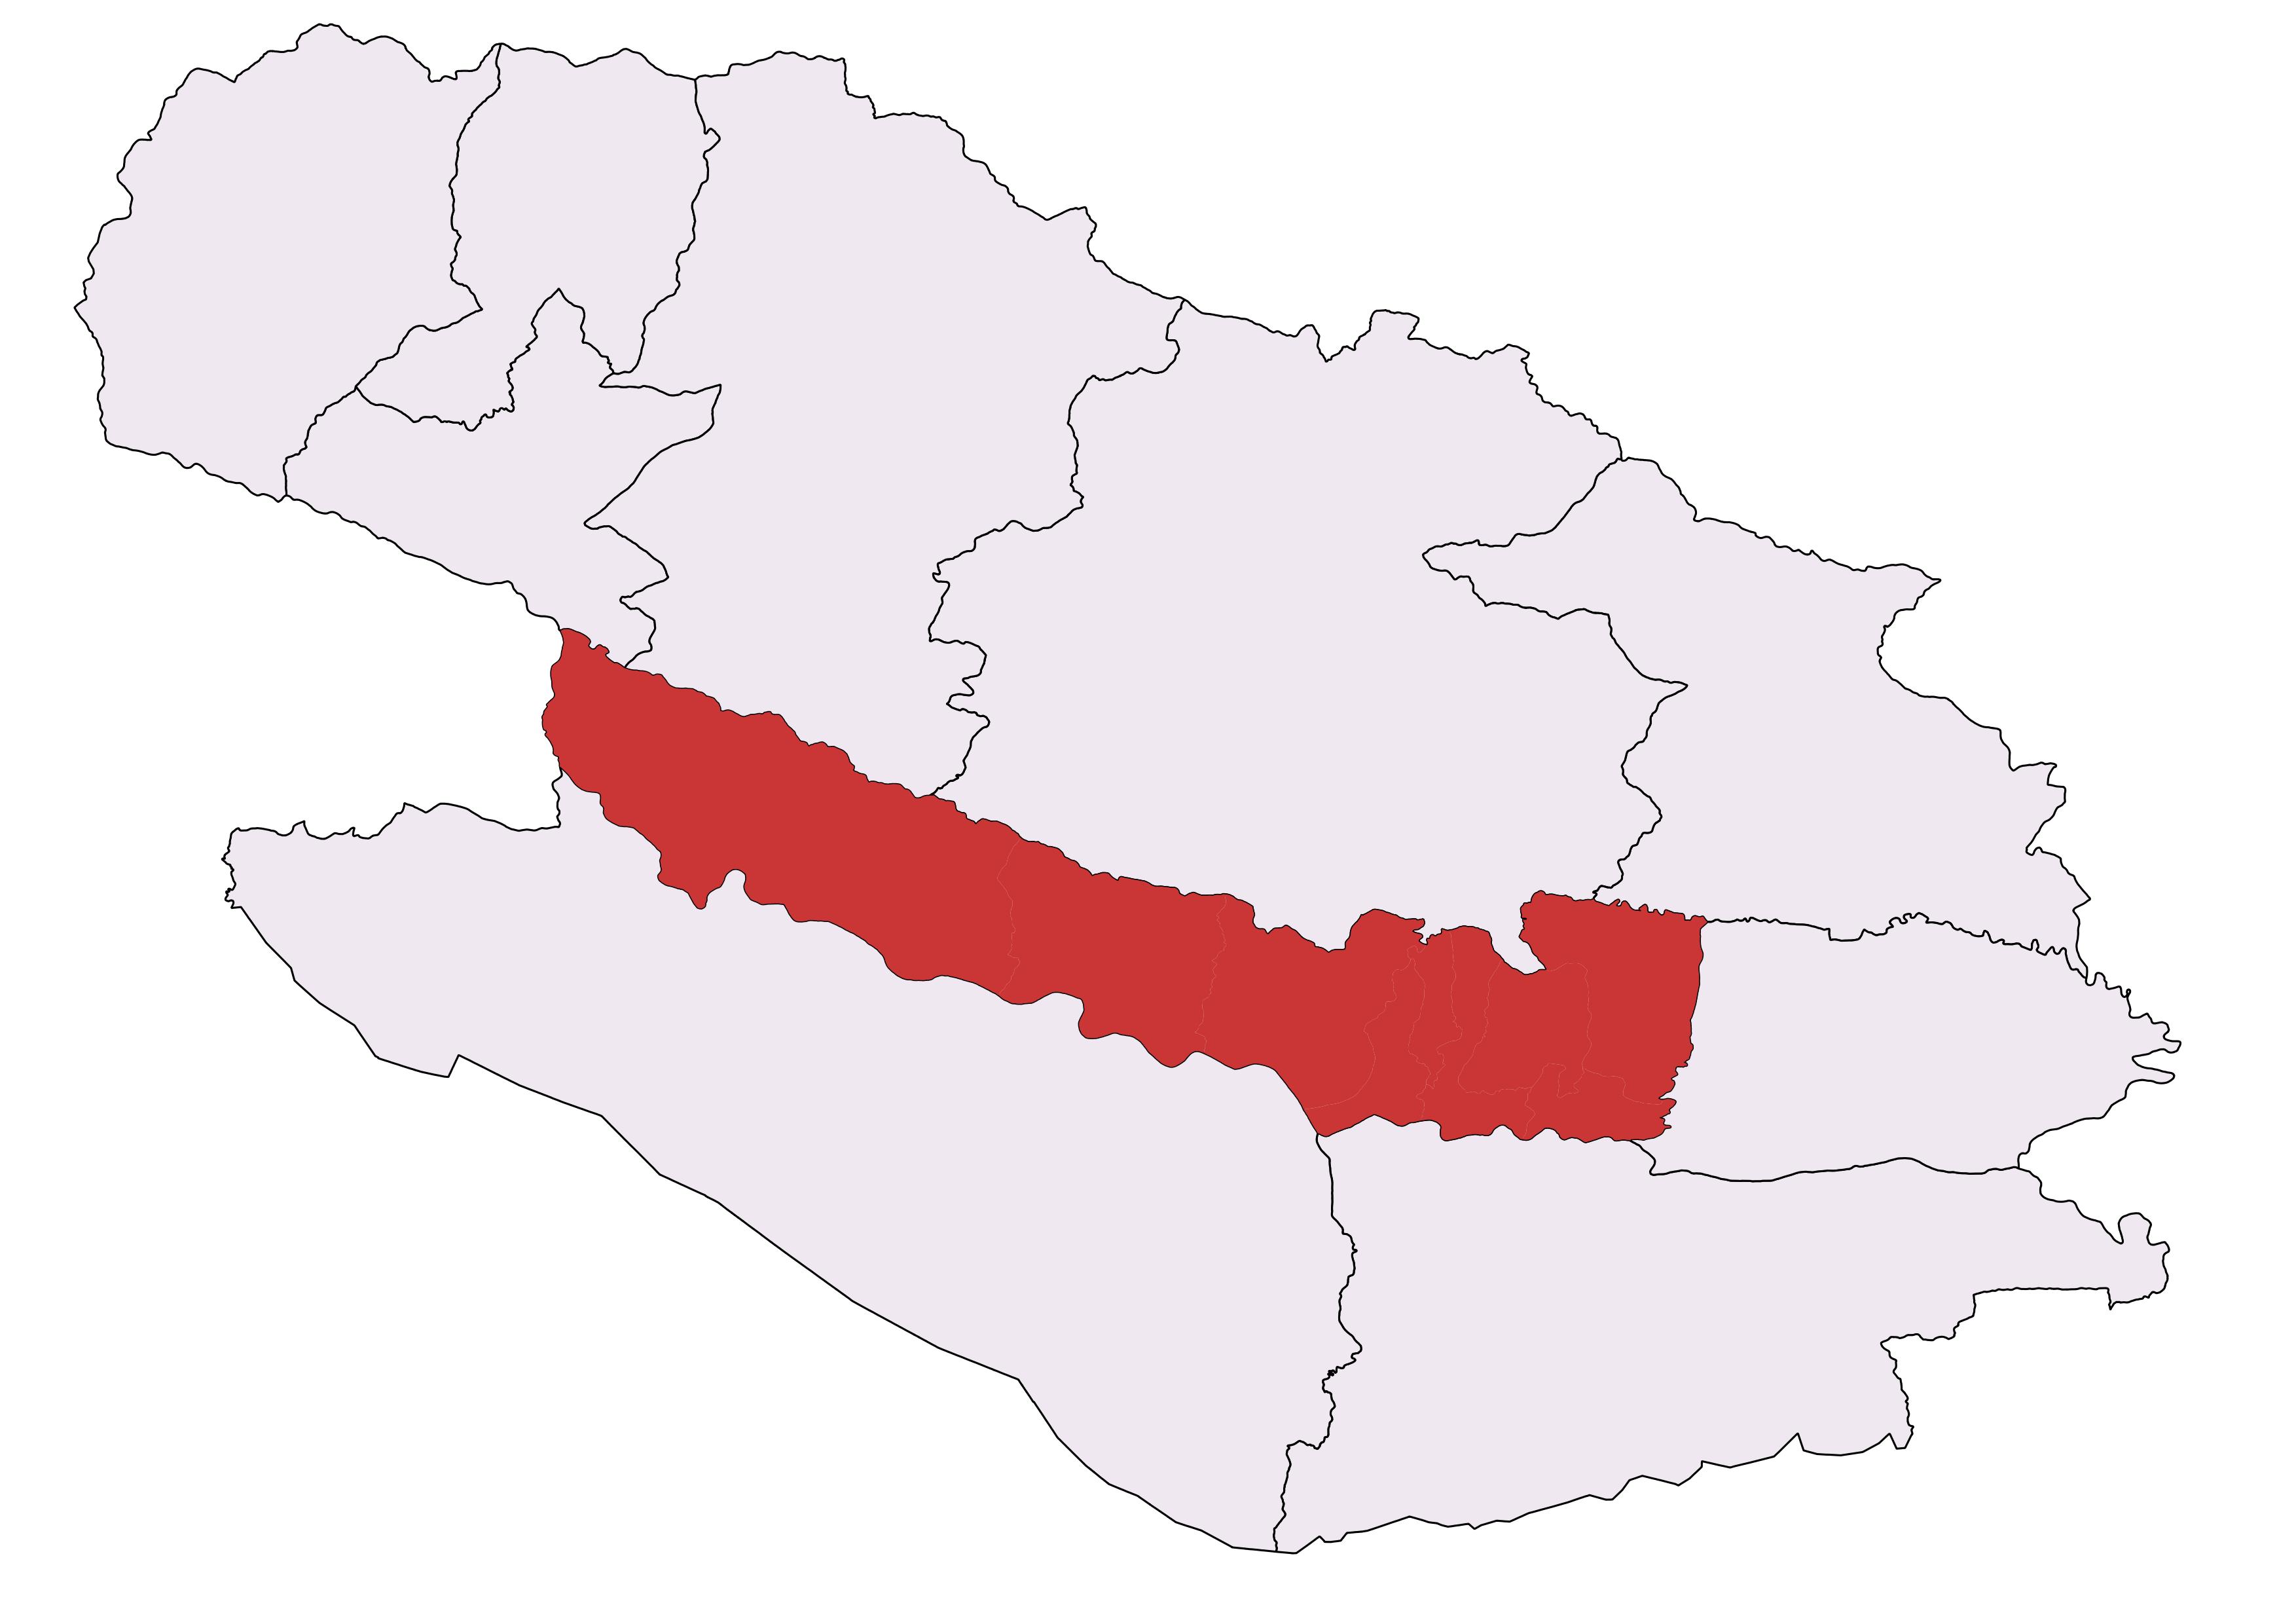
नेपालकाे संविधान २०७२ अनुसार लुम्विनी प्रदेश अन्तर्गत पर्ने याे नगर दाङ जिल्ला का २ वटा उपमहानगरपालिका सहित तेश्राे नगरपालिका हाे । यो नगरपालिका विगतको चैलाही गाउँपालिका, सतवरीया गाउँपालिका र सोनपुर गाउँपालिका मिलेर बनेको हो । दाङ जिल्लाकाे देउखुरी उपत्यकाकाे वीच भागमा पर्ने याे नगरपालिकाकाे केन्द्र लमही वजार जिल्ला सदरमुकाम घाेराही वाट करिव २५ किलाेमिटरकाे दुरीमा पर्छ । नयाँ संरचना अनुसार यस नगरपालिकामा ९ वटा वडाहरू रहेका छन् । वि.सं. २०६८काे जणगणना अनुसार यस नगरपालिकामा ९,४३२ घरपरिवार वसाेवास गर्दछन् र यस नगरपालिकाकाे कुल जनसंख्या ४७,६५५ रहेकाे छ । जसमा पुरूषकाे संख्या २२,८९८ र महिलाकाे जनसंख्या २४,७५७ रहेकाे छ ।
याे क्षेत्र समुद्र सतह देखि सरदर २४६ मिटरकाे उचाइमा छ । यस लमही नगरपालिका लाई पूर्व पश्चिम राजमार्गले करिव करिव वीच भागवाट छेडेर गएकाे छ । यस नगरपालिकाकाे पूर्वमा राप्ती गाउँपालिका, उत्तरमा घाेराही उपमहानगरपालिका र बङ्गलाचुली गाउँपालिका, पश्चिममा बाँकेको राप्ती सोनारी गाउँपालिका र दक्षिणमा राजपुर र गढवा गाउँपालिका पर्दछन् ।
जनसाङ्खिक सूचक
-
कूल जनसंख्या ७
६०,१६३
/ -
१ बर्ष भन्दा मुनिको जनसंख्या ७
९४५
/ -
पाँच बर्ष भन्दा मुनिको जनसंख्या ७
४,७९०
/ -
किशोरावस्था (१०-१९ बर्ष) को जनसंख्या ७
१०,४५८
/ -
प्रजनन उमेरका महिला (१५ -४९ बर्ष ) ७
१८,११०
/ -
अनुमानित गर्भवती महिलाहरु ७
१,२३०
/ -
अनुमानित जिवित जन्मको संख्या ७
९६३
/ -
परिवारमा अनुपस्थित (विदेशमा बस्ने) जनसंख्या २
१,२६८
-
मोबाइल फोन भएका घरधुरी (%) २
६९
-
टेलिभिजन भएका घरधुरी (%) २
२०
-
लैङ्गिक अनुपात २
११८
-
१४ बर्ष र सो भन्दा कम उमेरका जनसंख्या ७
१४,९१४
/ -
६५ बर्ष र सो भन्दा माथि उमेरका जनसंख्या २
१,१११
उमेर र लिंगको आधारमा जनसंख्या वितरण
जनगणना २०६८जातिगत आधारमा जनसंख्या वितरण
जनगणना २०६८वार्ड अनुसार जनसंख्या वितरण
जनगणना २०६८स्वास्थ्य सेवा प्रवाह गर्ने संस्थाहरु
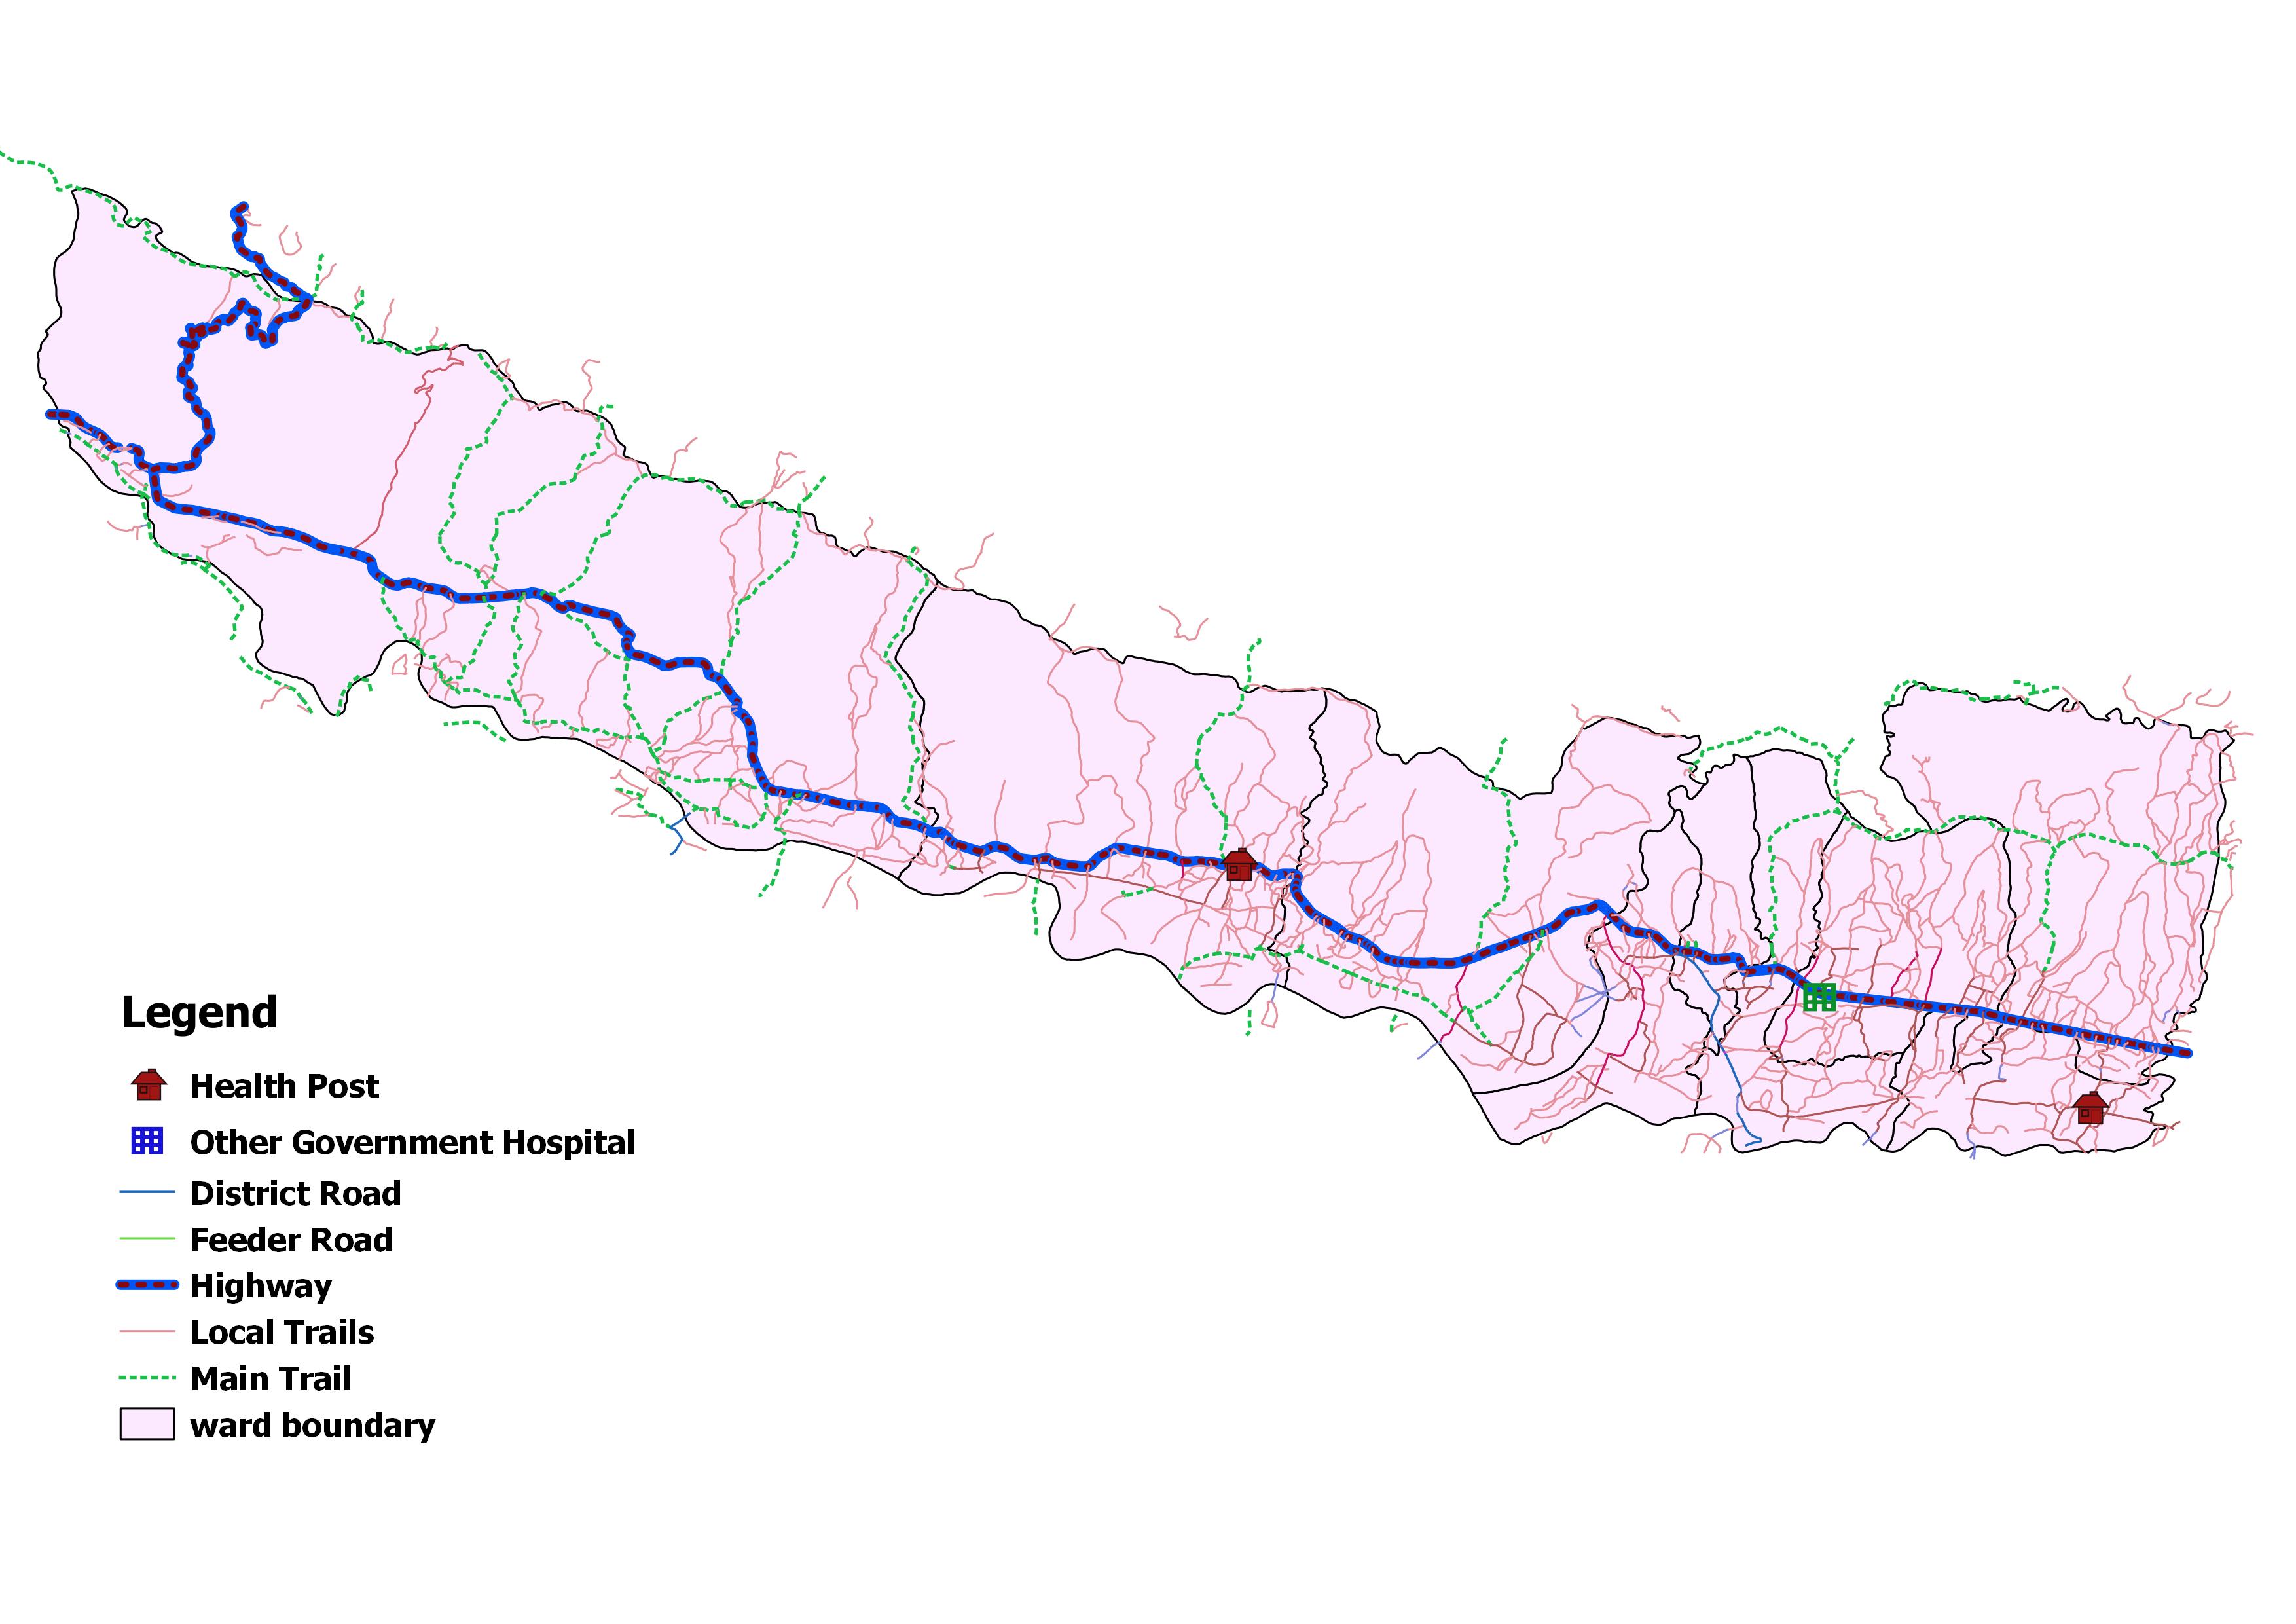
- अस्पताल १
- प्रास्वाके -
- स्वास्थ्य चौकी २
- सामुदायिक स्वास्थ्य ईकाई -
- शहरी स्वास्थ्य केन्द्र ८
- गाउँघर क्लिनिक ३
- खोप क्लिनिक १७
- आधारभूत स्वस्थ सेवाकेन्द्र -
- बर्थिंग सेन्टर ३
सरकारी संस्था
- अस्पताल तथा नर्सिंग होम ५
- पोलिक्लिनिक ४
- औषधि पसल २५
निजी (गैर-सरकारी संस्था समेत)
अन्य स्वास्थ्य केन्द्रहरु
- माइक्रोस्कोपी केन्द्र १
- एआरटि केन्द्र -
- एचाईभी परीक्षण केन्द्र १
- क्षयरोग उपचार केन्द्र ३
- आयुर्वेद अस्पताल/केन्द्र १
- आँखा अस्पताल/केन्द्र १
अस्पताल शैयाहरू
- सार्वजनिक १५
- निजी -
वडा अनुसार स्वास्थ्य संस्थाको जानकारी
| स्वास्थ्यसंस्थाको नाम | वार्ड न | बर्थिंग सेन्टर BEONC/CEONC | महिला स्वास्थ्य स्वयं सेवक संख्या | दक्ष प्रसुतिकर्मी संख्या | परिवार नियोजन *सेवा | स्वीकृत दरबन्दी | दरबन्दी अनुसार पदपूर्ति | करारका कर्मचारी |
|---|---|---|---|---|---|---|---|---|
| लमहि अस्पताल | ४ | प्रसुती केन्द्र | - | ८ | ५ साधनहरू | - | - | - |
| सोनपुर स्वास्थ्य चौकी | २ | प्रसुती केन्द्र | २२ | १ | ५ साधनहरू | ६ | ६ | १ |
| सतबरिया स्वास्थ्य चौकी | ८ | प्रसुती केन्द्र | २३ | ३ | ५ साधनहरू | ६ | ६ | २ |
| बसन्तपुर शहरि स्वास्थ्य केन्द्र | १ | - | - | ० | ४ साधनहरू | ० | ० | २ |
| बनकट्टी शहरि स्वास्थ्य केन्द्र | २ | - | - | ० | ३ साधनहरू | ० | ० | २ |
| मध्यनगर शहरि स्वास्थ्य केन्द्र | ६ | - | - | ० | ३ साधनहरू | ० | ० | २ |
| बनगाई शहरि स्वास्थ्य केन्द्र | ७ | - | - | ० | ३ साधनहरू | ० | ० | २ |
| सेम्रहवा शहरी स्वास्थ्य केन्द्र-४ | ४ | - | - | ० | ४ साधनहरू | ० | ० | २ |
| अमिलिया शहरि स्वास्थ्य केन्द्र-९ | ९ | - | - | ० | ३ साधनहरू | ० | ० | २ |
| कोलही शहरी स्वास्थ्य केन्द्र | ५ | - | २७ | ० | ४ साधनहरू | ० | ० | २ |
| टिकुलीगढ शहरी स्वास्थ्य केन्द्र | ३ | - | - | ० | ४ साधनहरू | ० | ० | २ |
| कुल कर्मचारी संख्या | ७२ | १२ | १२ | १२ | १९ | |||
स्वास्थ्य सेवाको लागि मानव संसाधन
- CEONC साइटहरू१
- BEONC साइटहरू-
- आइयुसीडी तथा इम्पलान्ट सेवा प्रदायक३
- एकीकृत बालरोग व्यवस्थापन (IMCI) प्रशिक्षित कर्मचारी१५
- जनसंख्या (प्रति मस्वास्वका) ८३६
- जनसंख्या (प्रति स्वास्थ्यकर्मी) ५०१४
- अनुमानित गर्भवति (प्रति दक्ष प्रसुतिकर्मी) १०३
- अनुमानित गर्भवति (प्रति बर्थिङ्ग सेन्टर) ४१०
- जनसंख्या (प्रति स्वास्थ्य संस्था) (अस्पताल,प्रस्वाके र स्वाचौ सहित) -
- जनसंख्या (प्रति सरकारी अस्पताल) ६०१६३
- जनसंख्या (प्रति अस्पताल र नर्सिंग होम (सबै) १००२७
मातृशिशु बालस्वास्थ्य र परिवार नियोजन सेवा उपयोगको अवस्था
स्वास्थ्य सूचना व्यवस्थापन प्रणाली २०७९प्रमूख स्वास्थ्य सेवाहरूको उपयोगको तुलनात्मक अवस्था
| सूचक | लमही नगरपालिका | लुम्बिनी प्रदेश २०७८/७९ | राष्ट्रीय २०७८/७९ | |||
|---|---|---|---|---|---|---|
| - | - | २०७९/८० | ||||
| खाेप |
ग्राफ
तालिका
|
|||||
| बि.सि.जि. कभरेज | - | - | ९१ | १०३.१ | १०३.५ | |
| २३ महिनाभित्र पूर्ण खोप प्राप्त गरेका बालबालिका (%) | - | - | ९४ | ० | ० | |
| डि.पि.टि. - हेप बि - हिव ३ कभरेज | - | - | ९६ | ९६.६ | ९५.२ | |
| दादुरा रूबेला १ (९-११ महिना) कभरेज | - | - | ९२ | ९६.७ | ९४.७ | |
| जे.इ कभरेज | - | - | ९७ | ९८.९ | ९५.९ | |
| टि.डी. २ र टि. डी. २+ कभरेज | - | - | ७२ | ७३.९ | ७१.७ | |
| पोषण |
ग्राफ
तालिका
|
|||||
| कम जन्म तौल भएका नवजात शिशुको प्रतिशत | - | - | ७ | १२ | ९.४ | |
| नयाँ तौल लिएका १ वर्ष मुनिका शिशुहरुको प्रतिशत | - | - | १३२ | १०९ | १०४.१ | |
| नयाँ तौल लिएका २ वर्ष मुनिका शिशुहरु मध्ये अति जोखिम अवस्थाका बालबालिकाहरुको प्रतिशत | - | - | २ | ३.५ | ३.६ | |
| गर्भवती अवस्थामा १८० दिन आइरन चक्की प्राप्त गरेका गर्भवती महिलाहरुको प्रतिशत | - | - | ५४ | ७५.८ | ६० | |
| सुत्केरी अवस्थामा भिटामिन ए प्राप्त गरेका महिलाहरुको प्रतिशत | - | - | ९८ | ९८.२ | ७६.३ | |
| नवजात शिशु तथा बाल रोगको एकीकृत व्यस्थापन |
ग्राफ
तालिका
|
|||||
| नाभी मलम लगाएका नवजात शिशुको प्रतिशत | - | - | १०० | ९४.२ | ८२.९ | |
| ब्याक्टेरियाको गम्भीर संक्रमण भएकामध्ये जेन्टामाईसिन सुईद्वारा पूर्ण उपचार पाएको प्रतिशत | - | - | २६ | ३९.५ | ४७.४ | |
| नयाँ निमोनिया बिरामीको दर (प्रति हजार पाँच वर्षमुनिका बालबालिकाहरुमा) | - | - | १३ | २९.३ | ३६.८ | |
| नयाँ एआरआई (स्वाशप्रश्वाका) बिरामी मध्ये कडा निमोनिया भएका बिरामीको प्रतिशत | - | - | ० | ०.०५ | ०.१८ | |
| नयाँ झाडापखालाका बिरामीको दर (प्रति हजार पाँच वर्ष मुनिका बालबालिकाहरुमा) | - | - | ९१ | ३३९ | ३५२.४ | |
| ५ वर्ष मुनिका झाडापखालाका बिरामी मध्ये जिंक र पुनर्जलीय झोलबाट उपचार गरेको प्रतिशत | - | - | १०० | ९८.७ | ९४.५ | |
| जम्मा नवजात शिशु मृत्यु संख्या | - | - | २ | ५७३ | १९१४ | |
| सुरक्षित मातृत्व तथा परिवार नियोजन |
ग्राफ
तालिका
|
|||||
| प्परोटोकल अनुसार पहिलो पटक गर्भवती जाँच गराएका गर्भवती महिलाहरुको प्रतिशत | - | - | ६५ | ९३.५ | ९१.४ | |
| प्रजनन् उमेरका महिलाहरुमा परिवार नियोजनको प्रयोगकर्ता दर (आधुनिक साधन) | - | - | १५ | ० | ० | |
| ४ पटक गर्भवती जाँच (महिना: ४,६,८,९/हप्ता: १६, २०-२४,३२ र ३६) महिलाहरुको प्रतिशत | - | - | ८३ | ७९.७ | ७९.४ | |
| स्वास्थ्य संस्था प्रसुति दर | - | - | ५१ | ९४.२ | ७९ | |
| दक्ष प्रसुतिकर्मी/स्वास्थ्यकर्मीद्वारा प्रसुति गराएको प्रतिशत | - | - | ५१ | ८९.८ | ७५ | |
| प्रोटोकल अनुसार ४ पटक (आ.व २०७८/७९ सम्म ३ पटक) सुत्केरी जाँच गराउने आमाहरुको प्रतिशत | - | - | २५ | ५३.७ | ४०.८ | |
| जम्मा मातृ मृत्यु संख्या | - | - | ० | ७४ | २३१ | |
| परिवार नियोजन सेवाका नयाँ सेवाग्राही दर (प्रजनन उमेरका महिलाहरु मध्ये) | - | - | ४ | १२.४ | ११.५ | |
| औलो रोग, क्षय रोग, कुष्ठरोग र एचआईभी |
ग्राफ
तालिका
|
|||||
| औलोको स्लाइड नमुना पोजेटिभ दर | - | - | .२२ | ०.२७ | ०.१७ | |
| डेंगुको जम्मा विरामी संख्या | - | - | ५३ | ० | ० | |
| आयातित औलोरोगको प्रतिशत (नयाँ औलो रोग मध्ये | - | - | ० | ९५.५ | ८९.५ | |
| जम्मा औलो रोग मध्ये प्लाज्मोडियम फाल्सिपारमको अनुपात | - | - | ११ | ३८.७ | २२.८ | |
| नयाँ क्षयरोगी बिरामी पत्ता लागेको दर | - | - | १२५ | १५७.४ | १२९.१ | |
| क्षयरोगको उपचार सफलता दर | - | - | ९६ | ९१ | ९१.५ | |
| कुष्ठरोगको रोग प्रकोप दर (प्रति १०००० मा) | - | - | ०.३३ | ०.९ | ० | |
| ए. आर. टी. उपचारमा रहेका जम्मा एच. आइ. भी. पोजेटिभको संख्या | - | - | ० | ४३२६ | २२१५२ | |
| उपचारात्मक सेवा |
ग्राफ
तालिका
|
|||||
| ओ पि डी मा आएका बिरामी मध्ये नयाँ बिरामीको दर | - | - | ५८ | ९४.५ | ९२ | |
शीर्ष १० स्वास्थ्य अवस्थाको सूची
स्वास्थ्य सूचना व्यवस्थापन प्रणाली २०७९०८०स्वास्थ्य क्षेत्रमा बजेट
- सशर्त स्वास्थ्यमा छुट्याएको बजेट
- समानीकरणबाट विनियोजित स्वास्थ्य बजेट
- अन्य श्रोतबाट बिनियोजित स्वास्थ्य बजेट
| बजेट | लमही नगरपालिका | |||||
|---|---|---|---|---|---|---|
| २०७६/७७ | २०७७/७८ | २०७८/७९ | ||||
| ग्राफ | ||||||
| पालिकाको कुल बजेट (रु ) | ८७३,५१२,००० | ८८६,९५८,००० | १,१२५,०००,००० | |||
| स्वास्थ्य बजेट (सबै स्रोत) | २८,२४०,२५० | ६२,९००,००० | ११०,५४१,५७८ | |||
| सशर्त स्वास्थ्यमा छुट्याएको बजेट | १२,९९०,२५० | ३६,९००,००० | ३७,१००,००० | |||
| समानीकरणबाट विनियोजित स्वास्थ्य बजेट | १५,२५०,००० | २६,०००,००० | ७२,८४१,५७८ | |||
| अन्य श्रोतबाट बिनियोजित स्वास्थ्य बजेट | ६००,००० | |||||
| बजेट खर्च (%) | ८८ | २३ | - | |||
| तालिका | ||||||
महत्वपूर्ण सम्पर्क
Lamahi Municipality
ठेगाना : लमही नगरपालिका, प्रदेश नं ५, दाङ
टेलिफोन : ०८२५४०८५०
वेबसाइट : lamahimun.gov.np
प्रमुख प्रशासकीय अधिकृत
नाम : देवेन्द्र प्रसाद श्रेष्ठ
सम्पर्क : ९८५७८३७१११
ईमेल : lamahinapa@gmail.com
स्वास्थ्य शाखा प्रमुख
नाम : नारायण प्रशाद शर्मा
सम्पर्क : ९८५७८४०८५०
ईमेल : narayansharma123@gmail.com
सुचना प्रबिधि अधिकृत
नाम : नरेन्द्र कुमार गुप्ता
सम्पर्क : ९८४७८६५१३२
ईमेल : ito.lamahimun@gmail.com

यो प्रोफाइल अमेरिकी अन्तर्राष्ट्रिय विकास नियोग (युएसएआइडी) मार्फत अमेरिकी जनताहरुको सहयोगका कारण सम्भव बनेको हो । यो प्रतिवेदन भित्रका विषयवस्तु र सामग्री स्वास्थ्यका लागि सक्षम प्रणालीका एकल जिम्मेवारी हुन् र तिनले युएसएआइडी वा अमेरिकी सरकारको विचारको प्रतिविम्बित गर्छन् भन्ने जरुरी छैन ।