संक्षिप्त परिचय महाबु गाउँपालिका
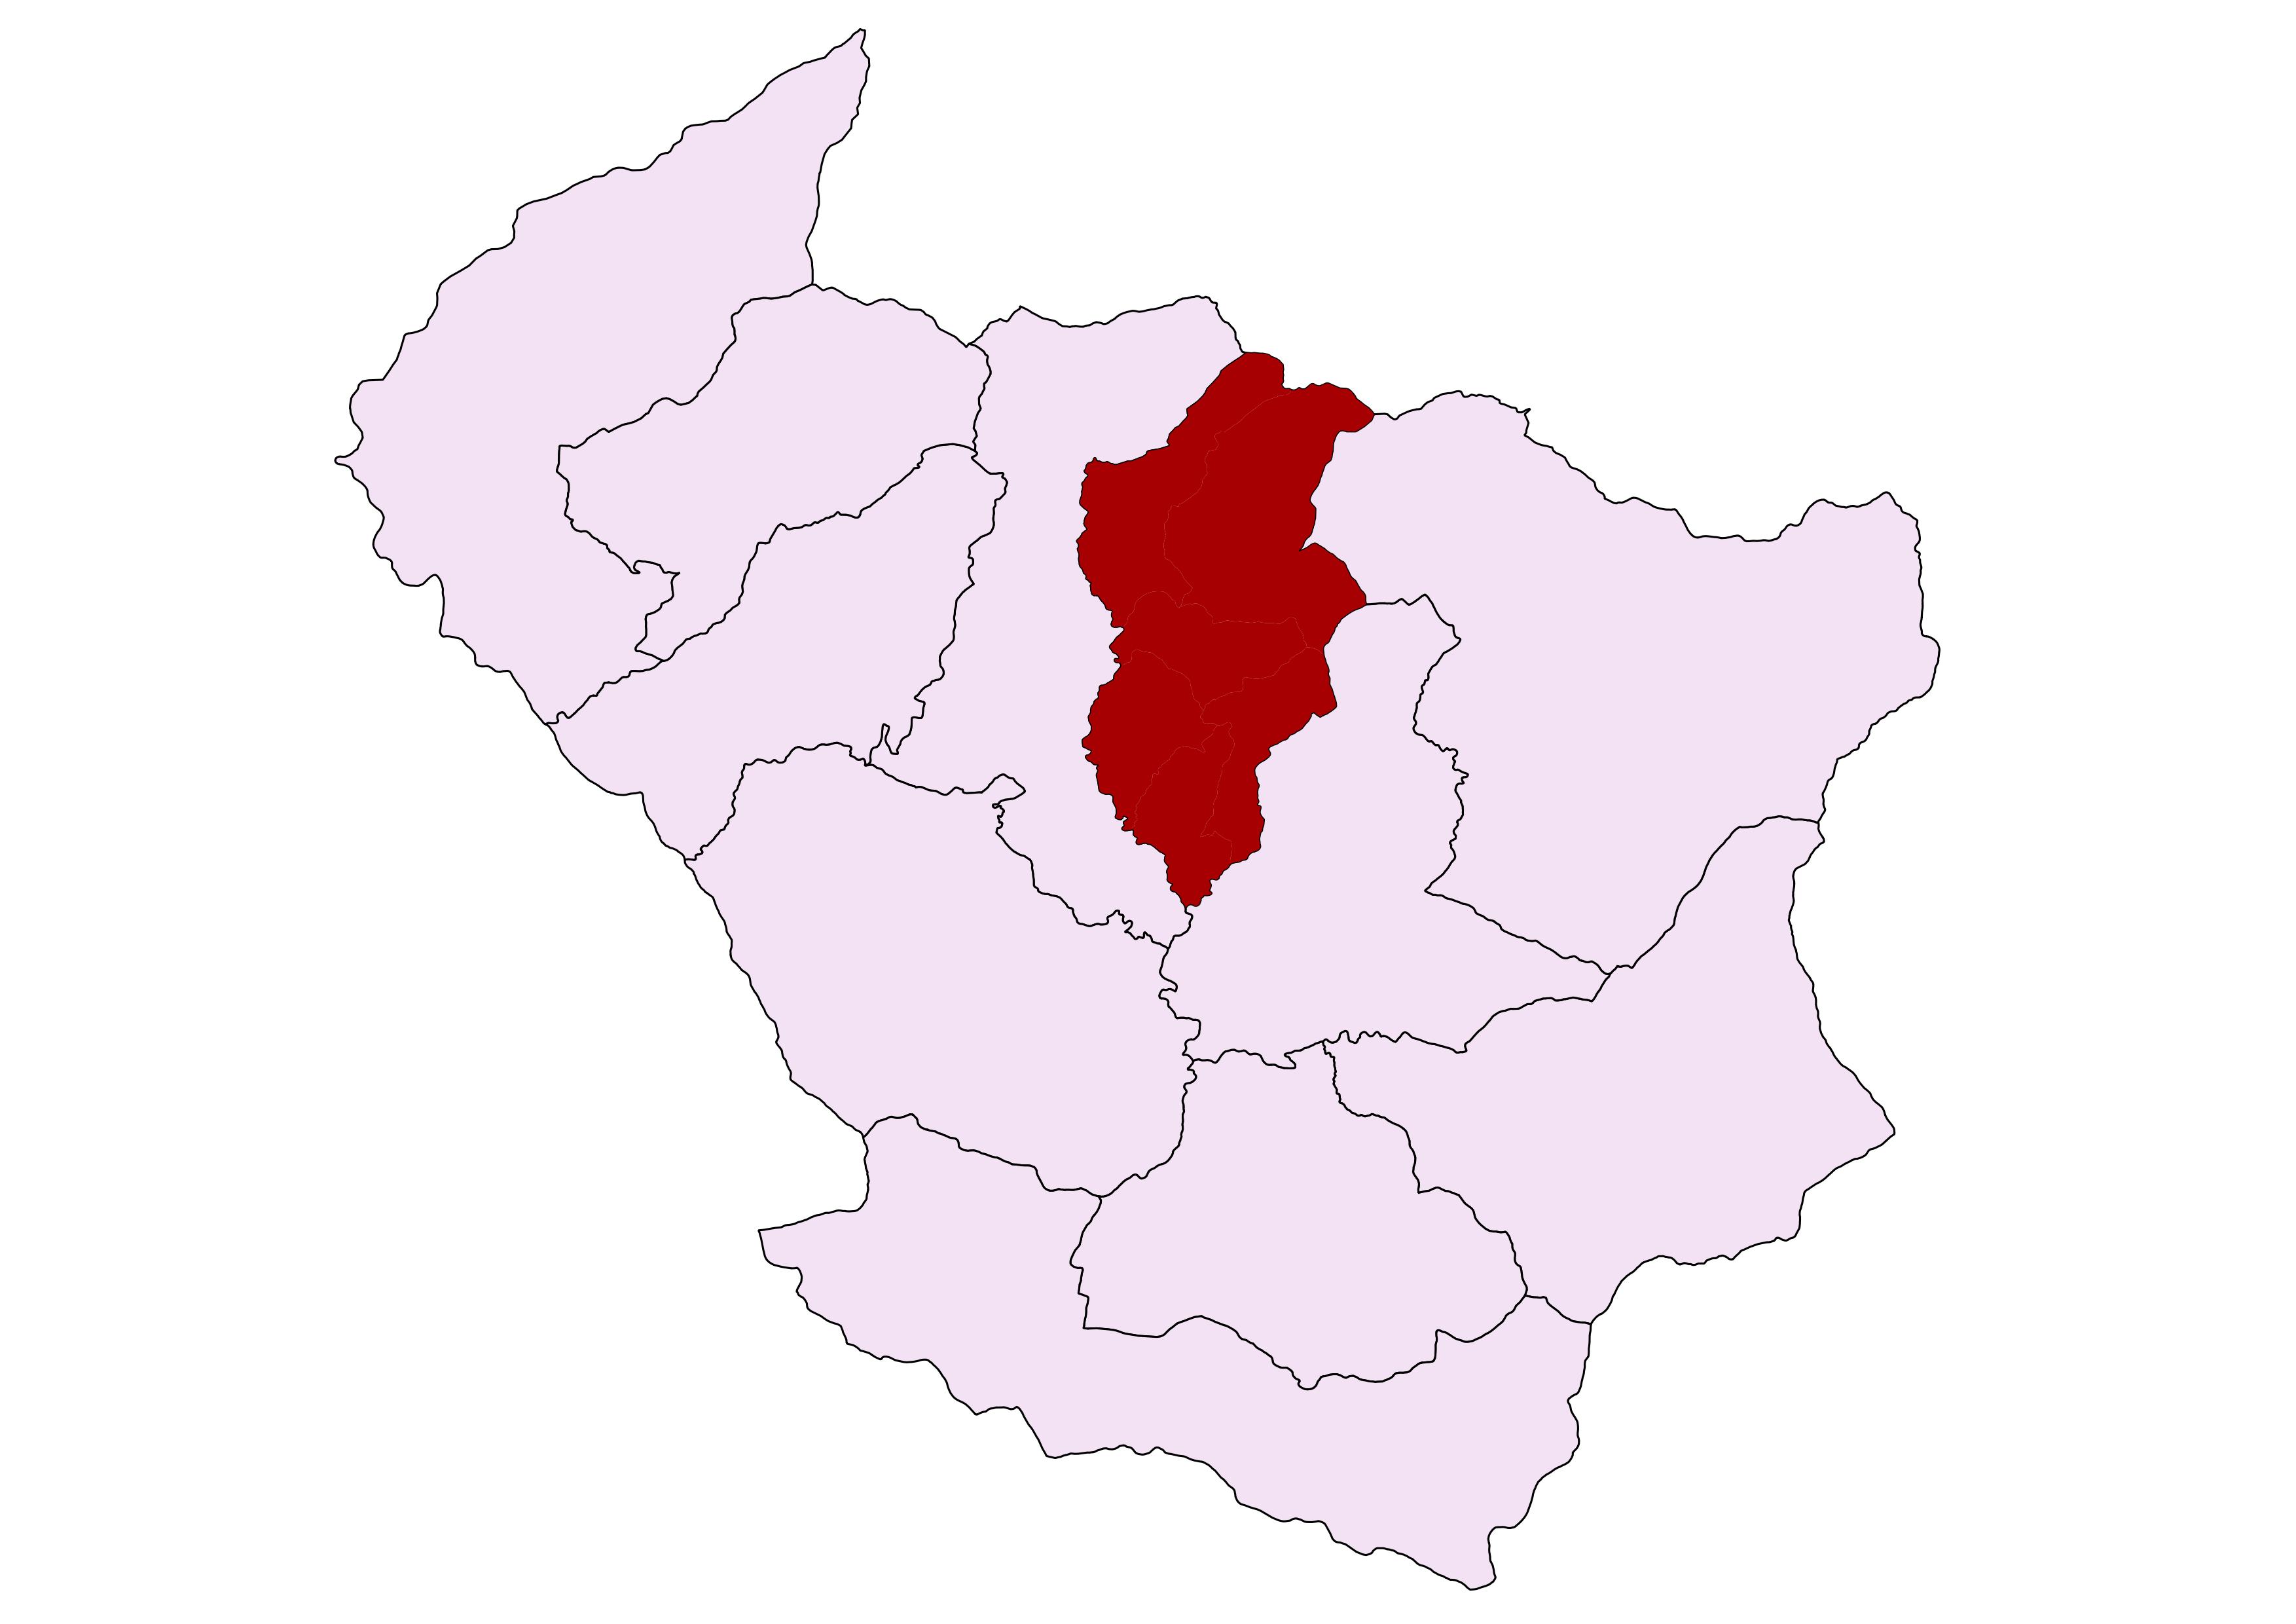
माहाबु गाँउपालिका स्थानिय सरकार को रूपमा बि स २०७३ म स्थापन भयको हो । माहाबु गाँउपालिका को मुख्यालय गैडाबाज, दैलेखमा अवस्थित छ । माहाबु गाँउपालिका पुर्ब मा नाैमुले गाँउपालिका,पस्चिम मा भैरबि गाँउपलिका , उत्तर मा कालिकोट जील्ला र दक्षीण मा नारायण नगरपालिका ले घेरियको छ । गाँउपालिका को कुल क्षेत्रफल ११० .८० बर्ग किलोमिटर रहेको छ।
जनसाङ्खिक सूचक
-
कूल जनसंख्या ७
१७,१६३
२०८०/८१ -
१ बर्ष भन्दा मुनिको जनसंख्या ७
३८४
२०८०/८१ -
पाँच बर्ष भन्दा मुनिको जनसंख्या ७
१,८३३
२०८०/८१ -
किशोरावस्था (१०-१९ बर्ष) को जनसंख्या ७
३,९८१
२०८०/८१ -
प्रजनन उमेरका महिला (१५ -४९ बर्ष ) ७
४,८५१
२०८०/८१ -
अनुमानित गर्भवती महिलाहरु ७
५९६
२०८०/८१ -
अनुमानित जिवित जन्मको संख्या ७
३८३
२०८०/८१ -
परिवारमा अनुपस्थित (विदेशमा बस्ने) जनसंख्या २
१,९५८
२०७८ -
मोबाइल फोन भएका घरधुरी (%) २
८२
२०७८ -
टेलिभिजन भएका घरधुरी (%) २
७
२०७८ -
लैङ्गिक अनुपात २
८४
२०७८ -
१४ बर्ष र सो भन्दा कम उमेरका जनसंख्या ७
५,६८१
२०८०/८१ -
६५ बर्ष र सो भन्दा माथि उमेरका जनसंख्या २
१,१९७
२०७८
उमेर र लिंगको आधारमा जनसंख्या वितरण
जनगणना २०७८जातिगत आधारमा जनसंख्या वितरण
जनगणना २०७८वार्ड अनुसार जनसंख्या वितरण
जनगणना २०७८स्वास्थ्य सेवा प्रवाह गर्ने संस्थाहरु

- अस्पताल १
- प्रास्वाके -
- स्वास्थ्य चौकी ५
- शहरी स्वास्थ्य केन्द्र -
- गाउँघर क्लिनिक १५
- खोप क्लिनिक १९
- आधारभूत स्वस्थ सेवाकेन्द्र -
- बर्थिंग सेन्टर ९
सरकारी संस्था
- अस्पताल तथा नर्सिंग होम -
- पोलिक्लिनिक -
- औषधि पसल १
निजी (गैर-सरकारी संस्था समेत)
अन्य स्वास्थ्य केन्द्रहरु
- माइक्रोस्कोपी केन्द्र १
- एआरटि केन्द्र -
- एचाईभी परीक्षण केन्द्र -
- क्षयरोग उपचार केन्द्र ५
- आयुर्वेद अस्पताल/केन्द्र -
- आँखा अस्पताल/केन्द्र -
अस्पताल शैयाहरू
- सार्वजनिक -
- निजी -
थप सेवाहरू
- सामुदाईक स्वास्थ्य इकाइ ४
वडा अनुसार स्वास्थ्य संस्थाको जानकारी
| स्वास्थ्यसंस्थाको नाम | वार्ड न | बर्थिंग सेन्टर BEONC/CEONC | महिला स्वास्थ्य स्वयं सेवक संख्या | दक्ष प्रसुतिकर्मी संख्या | परिवार नियोजन *सेवा | स्वीकृत दरबन्दी | दरबन्दी अनुसार पदपूर्ति | करारका कर्मचारी |
|---|---|---|---|---|---|---|---|---|
| बडाखोला स्वास्थ्य चौकी | २ | प्रसुति केन्द्र | १० | १ | ३ साधनहरू | ५ | ५ | २ |
| बाँसि स्वास्थ्य चौकी | ३ | प्रसुति केन्द्र | १२ | १ | ३ साधनहरू | ५ | ५ | ४ |
| कासिकाध स्वास्थ्य चौकी | ५ | प्रसुति केन्द्र | १४ | १ | ३ साधनहरू | ५ | ५ | ४ |
| खरिगैरा स्वास्थ्य चौकी | १ | प्रसुति केन्द्र | १० | १ | ३ साधनहरू | ५ | ५ | ३ |
| रानीबन स्वास्थ्य चौकी | ४ | प्रसुति केन्द्र | १५ | ० | ३ साधनहरू | ५ | ५ | ४ |
| टाकुरी सामुदायिक स्वास्थ्य इकाइ | ६ | १ | ० | ३ साधनहरू | ० | ० | ५ | |
| गिताचौर सामुदायिक स्वास्थ्य इकाइ | ४ | १ | ० | ३ साधनहरू | ० | ० | ४ | |
| एकपाटे सामुदायिक स्वास्थ्य इकाइ | ६ | १ | ० | ३ साधनहरू | ० | ० | ३ | |
| एराडी सामुदायिक स्वास्थ्य इकाइ | २ | १ | ० | ३ साधनहरू | ० | ० | ४ | |
| कुल कर्मचारी संख्या | ६५ | ४ | २५ | २५ | ३३ | |||
स्वास्थ्य सेवाको लागि मानव संसाधन
- CEONC साइटहरू-
- BEONC साइटहरू-
- आइयुसीडी तथा इम्पलान्ट सेवा प्रदायक२
- एकीकृत बालरोग व्यवस्थापन (IMCI) प्रशिक्षित कर्मचारी१८
- जनसंख्या (प्रति मस्वास्वका) २६४
- जनसंख्या (प्रति स्वास्थ्यकर्मी) ६८७
- अनुमानित गर्भवति (प्रति दक्ष प्रसुतिकर्मी) १४९
- अनुमानित गर्भवति (प्रति बर्थिङ्ग सेन्टर) -
- जनसंख्या (प्रति स्वास्थ्य संस्था) (अस्पताल,प्रस्वाके र स्वाचौ सहित) -
- जनसंख्या (प्रति सरकारी अस्पताल) १७१६३
- जनसंख्या (प्रति अस्पताल र नर्सिंग होम (सबै) १७१६३
मातृशिशु बालस्वास्थ्य र परिवार नियोजन सेवा उपयोगको अवस्था
स्वास्थ्य सूचना व्यवस्थापन प्रणाली २०८०प्रमूख स्वास्थ्य सेवाहरूको उपयोगको तुलनात्मक अवस्था
| सूचक | महाबु गाउँपालिका | कर्णाली प्रदेश २०७८/७९ | राष्ट्रीय २०७८/७९ | |||
|---|---|---|---|---|---|---|
| २०७९/८० | २०७७/७८ | २०७८/७९ | ||||
| खाेप |
ग्राफ
तालिका
|
|||||
| बि.सि.जि. कभरेज | ६८.४ | १०५.७ | ८३.४ | ९२ | १०३.५ | |
| २३ महिनाभित्र पूर्ण खोप प्राप्त गरेका बालबालिका (%) | ८२.९ | ७९ | ८१ | ० | ० | |
| डि.पि.टि. - हेप बि - हिव ३ कभरेज | ७५.१ | १००.७ | १०२.४ | ९४ | ९५.२ | |
| दादुरा रूबेला १ (९-११ महिना) कभरेज | ८१.३ | ९७.३ | ९२.८ | ९५ | ९४.७ | |
| जे.इ कभरेज | ७६.६ | ८६.४ | ९४.६ | ९६ | ९५.९ | |
| टि.डी. २ र टि. डी. २+ कभरेज | ५२.५ | ७२.६ | ४२.७ | ६६ | ७१.७ | |
| पोषण |
ग्राफ
तालिका
|
|||||
| कम जन्म तौल भएका नवजात शिशुको प्रतिशत | ०.७३ | ०.२७ | ०.७६ | ६.८ | ९.४ | |
| नयाँ तौल लिएका १ वर्ष मुनिका शिशुहरुको प्रतिशत | ८४.४ | १०९.१ | १०४.३ | १२० | १०४.१ | |
| नयाँ तौल लिएका २ वर्ष मुनिका शिशुहरु मध्ये अति जोखिम अवस्थाका बालबालिकाहरुको प्रतिशत | ३.५ | २.२ | १.९ | ४.१ | ३.६ | |
| गर्भवती अवस्थामा १८० दिन आइरन चक्की प्राप्त गरेका गर्भवती महिलाहरुको प्रतिशत | ३८.९ | ५७.३ | ५०.९ | ७३ | ६० | |
| सुत्केरी अवस्थामा भिटामिन ए प्राप्त गरेका महिलाहरुको प्रतिशत | ६८ | १३५.४ | ६१.९ | ८८ | ७६.३ | |
| नवजात शिशु तथा बाल रोगको एकीकृत व्यस्थापन |
ग्राफ
तालिका
|
|||||
| नाभी मलम लगाएका नवजात शिशुको प्रतिशत | १०० | १०१.७ | १०० | ९६ | ८२.९ | |
| ब्याक्टेरियाको गम्भीर संक्रमण भएकामध्ये जेन्टामाईसिन सुईद्वारा पूर्ण उपचार पाएको प्रतिशत | ५० | ६६.७ | ० | ७५ | ४७.४ | |
| नयाँ निमोनिया बिरामीको दर (प्रति हजार पाँच वर्षमुनिका बालबालिकाहरुमा) | ३५.५ | ६१.२ | ६९.५ | ११३ | ३६.८ | |
| नयाँ एआरआई (स्वाशप्रश्वाका) बिरामी मध्ये कडा निमोनिया भएका बिरामीको प्रतिशत | ०.४२ | ०.१९ | ०.०६ | ०.४१ | ०.१८ | |
| नयाँ झाडापखालाका बिरामीको दर (प्रति हजार पाँच वर्ष मुनिका बालबालिकाहरुमा) | १२८.४ | १४१.२ | १३८.१ | ५७९ | ३५२.४ | |
| ५ वर्ष मुनिका झाडापखालाका बिरामी मध्ये जिंक र पुनर्जलीय झोलबाट उपचार गरेको प्रतिशत | ९९.६ | ९६ | ९४.७ | ९५ | ९४.५ | |
| जम्मा नवजात शिशु मृत्यु संख्या | ० | २ | ० | १९९ | १९१४ | |
| सुरक्षित मातृत्व तथा परिवार नियोजन |
ग्राफ
तालिका
|
|||||
| प्परोटोकल अनुसार पहिलो पटक गर्भवती जाँच गराएका गर्भवती महिलाहरुको प्रतिशत | ५६.७ | ७५ | ६९ | १२२ | ९१.४ | |
| प्रजनन् उमेरका महिलाहरुमा परिवार नियोजनको प्रयोगकर्ता दर (आधुनिक साधन) | १२.७ | ९.८ | ११.९ | ० | ० | |
| ४ पटक गर्भवती जाँच (महिना: ४,६,८,९/हप्ता: १६, २०-२४,३२ र ३६) महिलाहरुको प्रतिशत | ४८.२ | ६१.५ | ५२.९ | ७३ | ७९.४ | |
| स्वास्थ्य संस्था प्रसुति दर | ६६.५ | २५.२ | ३९.२ | ८३ | ७९ | |
| दक्ष प्रसुतिकर्मी/स्वास्थ्यकर्मीद्वारा प्रसुति गराएको प्रतिशत | ४३.८ | ५६.९ | २४.३ | ७० | ७५ | |
| प्रोटोकल अनुसार ४ पटक (आ.व २०७८/७९ सम्म ३ पटक) सुत्केरी जाँच गराउने आमाहरुको प्रतिशत | ४८.९ | ६९ | ५७.२ | ५३ | ४०.८ | |
| जम्मा मातृ मृत्यु संख्या | ० | ० | ० | १७ | २३१ | |
| परिवार नियोजन सेवाका नयाँ सेवाग्राही दर (प्रजनन उमेरका महिलाहरु मध्ये) | १८.६ | १६.६ | १९.१ | १९ | ११.५ | |
| औलो रोग, क्षय रोग, कुष्ठरोग र एचआईभी |
ग्राफ
तालिका
|
|||||
| औलोको स्लाइड नमुना पोजेटिभ दर | ० | ० | ० | ०.२५ | ०.१७ | |
| डेंगुको जम्मा विरामी संख्या | ० | ० | ० | ० | ० | |
| आयातित औलोरोगको प्रतिशत (नयाँ औलो रोग मध्ये | ० | ० | ० | ६३ | ८९.५ | |
| जम्मा औलो रोग मध्ये प्लाज्मोडियम फाल्सिपारमको अनुपात | ० | ० | ० | २.१ | २२.८ | |
| नयाँ क्षयरोगी बिरामी पत्ता लागेको दर | ८१.६ | २७.४ | ६६.४ | ९७ | १२९.१ | |
| क्षयरोगको उपचार सफलता दर | ९१.७ | १०० | १०० | ९१ | ९१.५ | |
| कुष्ठरोगको रोग प्रकोप दर (प्रति १०००० मा) | ० | ० | ०.५५ | ०.५ | ० | |
| ए. आर. टी. उपचारमा रहेका जम्मा एच. आइ. भी. पोजेटिभको संख्या | ० | ० | ० | ६९१ | २२१५२ | |
| उपचारात्मक सेवा |
ग्राफ
तालिका
|
|||||
| ओ पि डी मा आएका बिरामी मध्ये नयाँ बिरामीको दर | ५९.१६ | ६८.६८ | ७६.०७ | १०५ | ९२ | |
शीर्ष १० स्वास्थ्य अवस्थाको सूची
स्वास्थ्य सूचना व्यवस्थापन प्रणाली २०७९-०८०स्वास्थ्य क्षेत्रमा बजेट
- सशर्त स्वास्थ्यमा छुट्याएको बजेट
- समानीकरणबाट विनियोजित स्वास्थ्य बजेट
- अन्य श्रोतबाट बिनियोजित स्वास्थ्य बजेट
| बजेट | महाबु गाउँपालिका | |||||
|---|---|---|---|---|---|---|
| २०७८/७९ | २०७९/८० | २०८०/८१ | ||||
| ग्राफ | ||||||
| पालिकाको कुल बजेट (रु ) | ४९०,४५५,२२५ | ४४१,९२७,१२१ | ४५३,०८३,६८० | |||
| स्वास्थ्य बजेट (सबै स्रोत) | ४१,२५८,००० | ४१,४५८,००० | ४५,४८८,२६० | |||
| सशर्त स्वास्थ्यमा छुट्याएको बजेट | २८,१००,००० | २८,३००,००० | ३६,५०९,००० | |||
| समानीकरणबाट विनियोजित स्वास्थ्य बजेट | ११,९८८,००० | ११,९८८,००० | ८,०४०,२६० | |||
| अन्य श्रोतबाट बिनियोजित स्वास्थ्य बजेट | १,१७०,००० | १,१७०,००० | ९३९,००० | |||
| बजेट खर्च (%) | १०० | ८७ | - | |||
| तालिका | ||||||
महत्वपूर्ण सम्पर्क
का.बा.अध्यक्ष
नाम : मञ्जु कुमारी शर्मा (पाण्डे)
सम्पर्क : ९८४८०६२९०३
ईमेल : manjupandey2079@gmail.com
प्रमुख प्रशासकीय अधिकृत
नाम : उदयराज उपाध्याय
सम्पर्क : ९८५८०७४६०३/९८५१०५९७२०
ईमेल : udaya.upadhyaya@nepal.gov.np

यो प्रोफाइल अमेरिकी अन्तर्राष्ट्रिय विकास नियोग (युएसएआइडी) मार्फत अमेरिकी जनताहरुको सहयोगका कारण सम्भव बनेको हो । यो प्रतिवेदन भित्रका विषयवस्तु र सामग्री स्वास्थ्यका लागि सक्षम प्रणालीका एकल जिम्मेवारी हुन् र तिनले युएसएआइडी वा अमेरिकी सरकारको विचारको प्रतिविम्बित गर्छन् भन्ने जरुरी छैन ।