संक्षिप्त परिचय मुसिकोट नगरपालिका
मुसिकोट नगरपालिका नेपालको सङ्घीय शासन प्रणाली अनुरूप नेपालको संबिधान २०७२ को धारा २९५ को उपधारा (३) बमोजिम गठित ७५३ वटा स्थानीय तह मध्यको एक हो ।कर्णाली प्रदेश अन्तर्गतको रुकुम (पक्ष्चिम ) जिल्लामा पर्ने यो मुसिकोट नगरपालिका साविकको खलंगा, सांख, चौखावाङ, भलाक्चा, छिवाङ गा.बि.स. तथा स्यालापाखा गा.बि.स.को वडा नम्बर ३ र ४ मिलेर छ । पूर्वमा सिस्ने र भुमे गाउँपालिका, पश्चिममा सानीभेरी गाउँपालिका, उत्तरमा वाँफीकोट गाउँपालिका र दक्षिणमा त्रिवेणी गाउँपालिका र रोल्पा जिल्ला रहेको यस नगरपालिकामा १४ वटा वडा रहेका छन् भने यसको क्षेत्रफल १३६.६ वर्ग कि.मि. रहेको छ ।
जनसाङ्खिक सूचक
-
कूल जनसंख्या १
३५,३७७
/ -
१ बर्ष भन्दा मुनिको जनसंख्या १
५९८
/ -
पाँच बर्ष भन्दा मुनिको जनसंख्या १
२,७७९
/ -
किशोरावस्था (१०-१९ बर्ष) को जनसंख्या १
६,६३६
/ -
प्रजनन उमेरका महिला (१५ -४९ बर्ष ) १
९,६५२
/ -
अनुमानित गर्भवती महिलाहरु १
७६०
/ -
अनुमानित जिवित जन्मको संख्या १
६१०
/ -
परिवारमा अनुपस्थित (विदेशमा बस्ने) जनसंख्या २
२,०४५
-
मोबाइल फोन भएका घरधुरी (%) २
३,८५६
-
टेलिभिजन भएका घरधुरी (%) २
७७८
-
लैङ्गिक अनुपात २
८८
-
१४ बर्ष र सो भन्दा कम उमेरका जनसंख्या १
८,९७०
/ -
६५ बर्ष र सो भन्दा माथि उमेरका जनसंख्या २
१,८९४
उमेर र लिंगको आधारमा जनसंख्या वितरण
जनगणना २०७८जातिगत आधारमा जनसंख्या वितरण
जनगणना २०६८वार्ड अनुसार जनसंख्या वितरण
जनगणना २०७८स्वास्थ्य सेवा प्रवाह गर्ने संस्थाहरु
- अस्पताल १
- प्रास्वाके -
- स्वास्थ्य चौकी ५
- शहरी स्वास्थ्य केन्द्र ४
- गाउँघर क्लिनिक ४
- खोप क्लिनिक २४
- आधारभूत स्वस्थ सेवाकेन्द्र ९
- बर्थिंग सेन्टर ३
सरकारी संस्था
- अस्पताल तथा नर्सिंग होम ३
- पोलिक्लिनिक -
- औषधि पसल १०
निजी (गैर-सरकारी संस्था समेत)
अन्य स्वास्थ्य केन्द्रहरु
- माइक्रोस्कोपी केन्द्र १
- एआरटि केन्द्र १
- एचाईभी परीक्षण केन्द्र १
- क्षयरोग उपचार केन्द्र ७
- आयुर्वेद अस्पताल/केन्द्र १
- आँखा अस्पताल/केन्द्र २
अस्पताल शैयाहरू
- सार्वजनिक २५
- निजी -
थप सेवाहरू
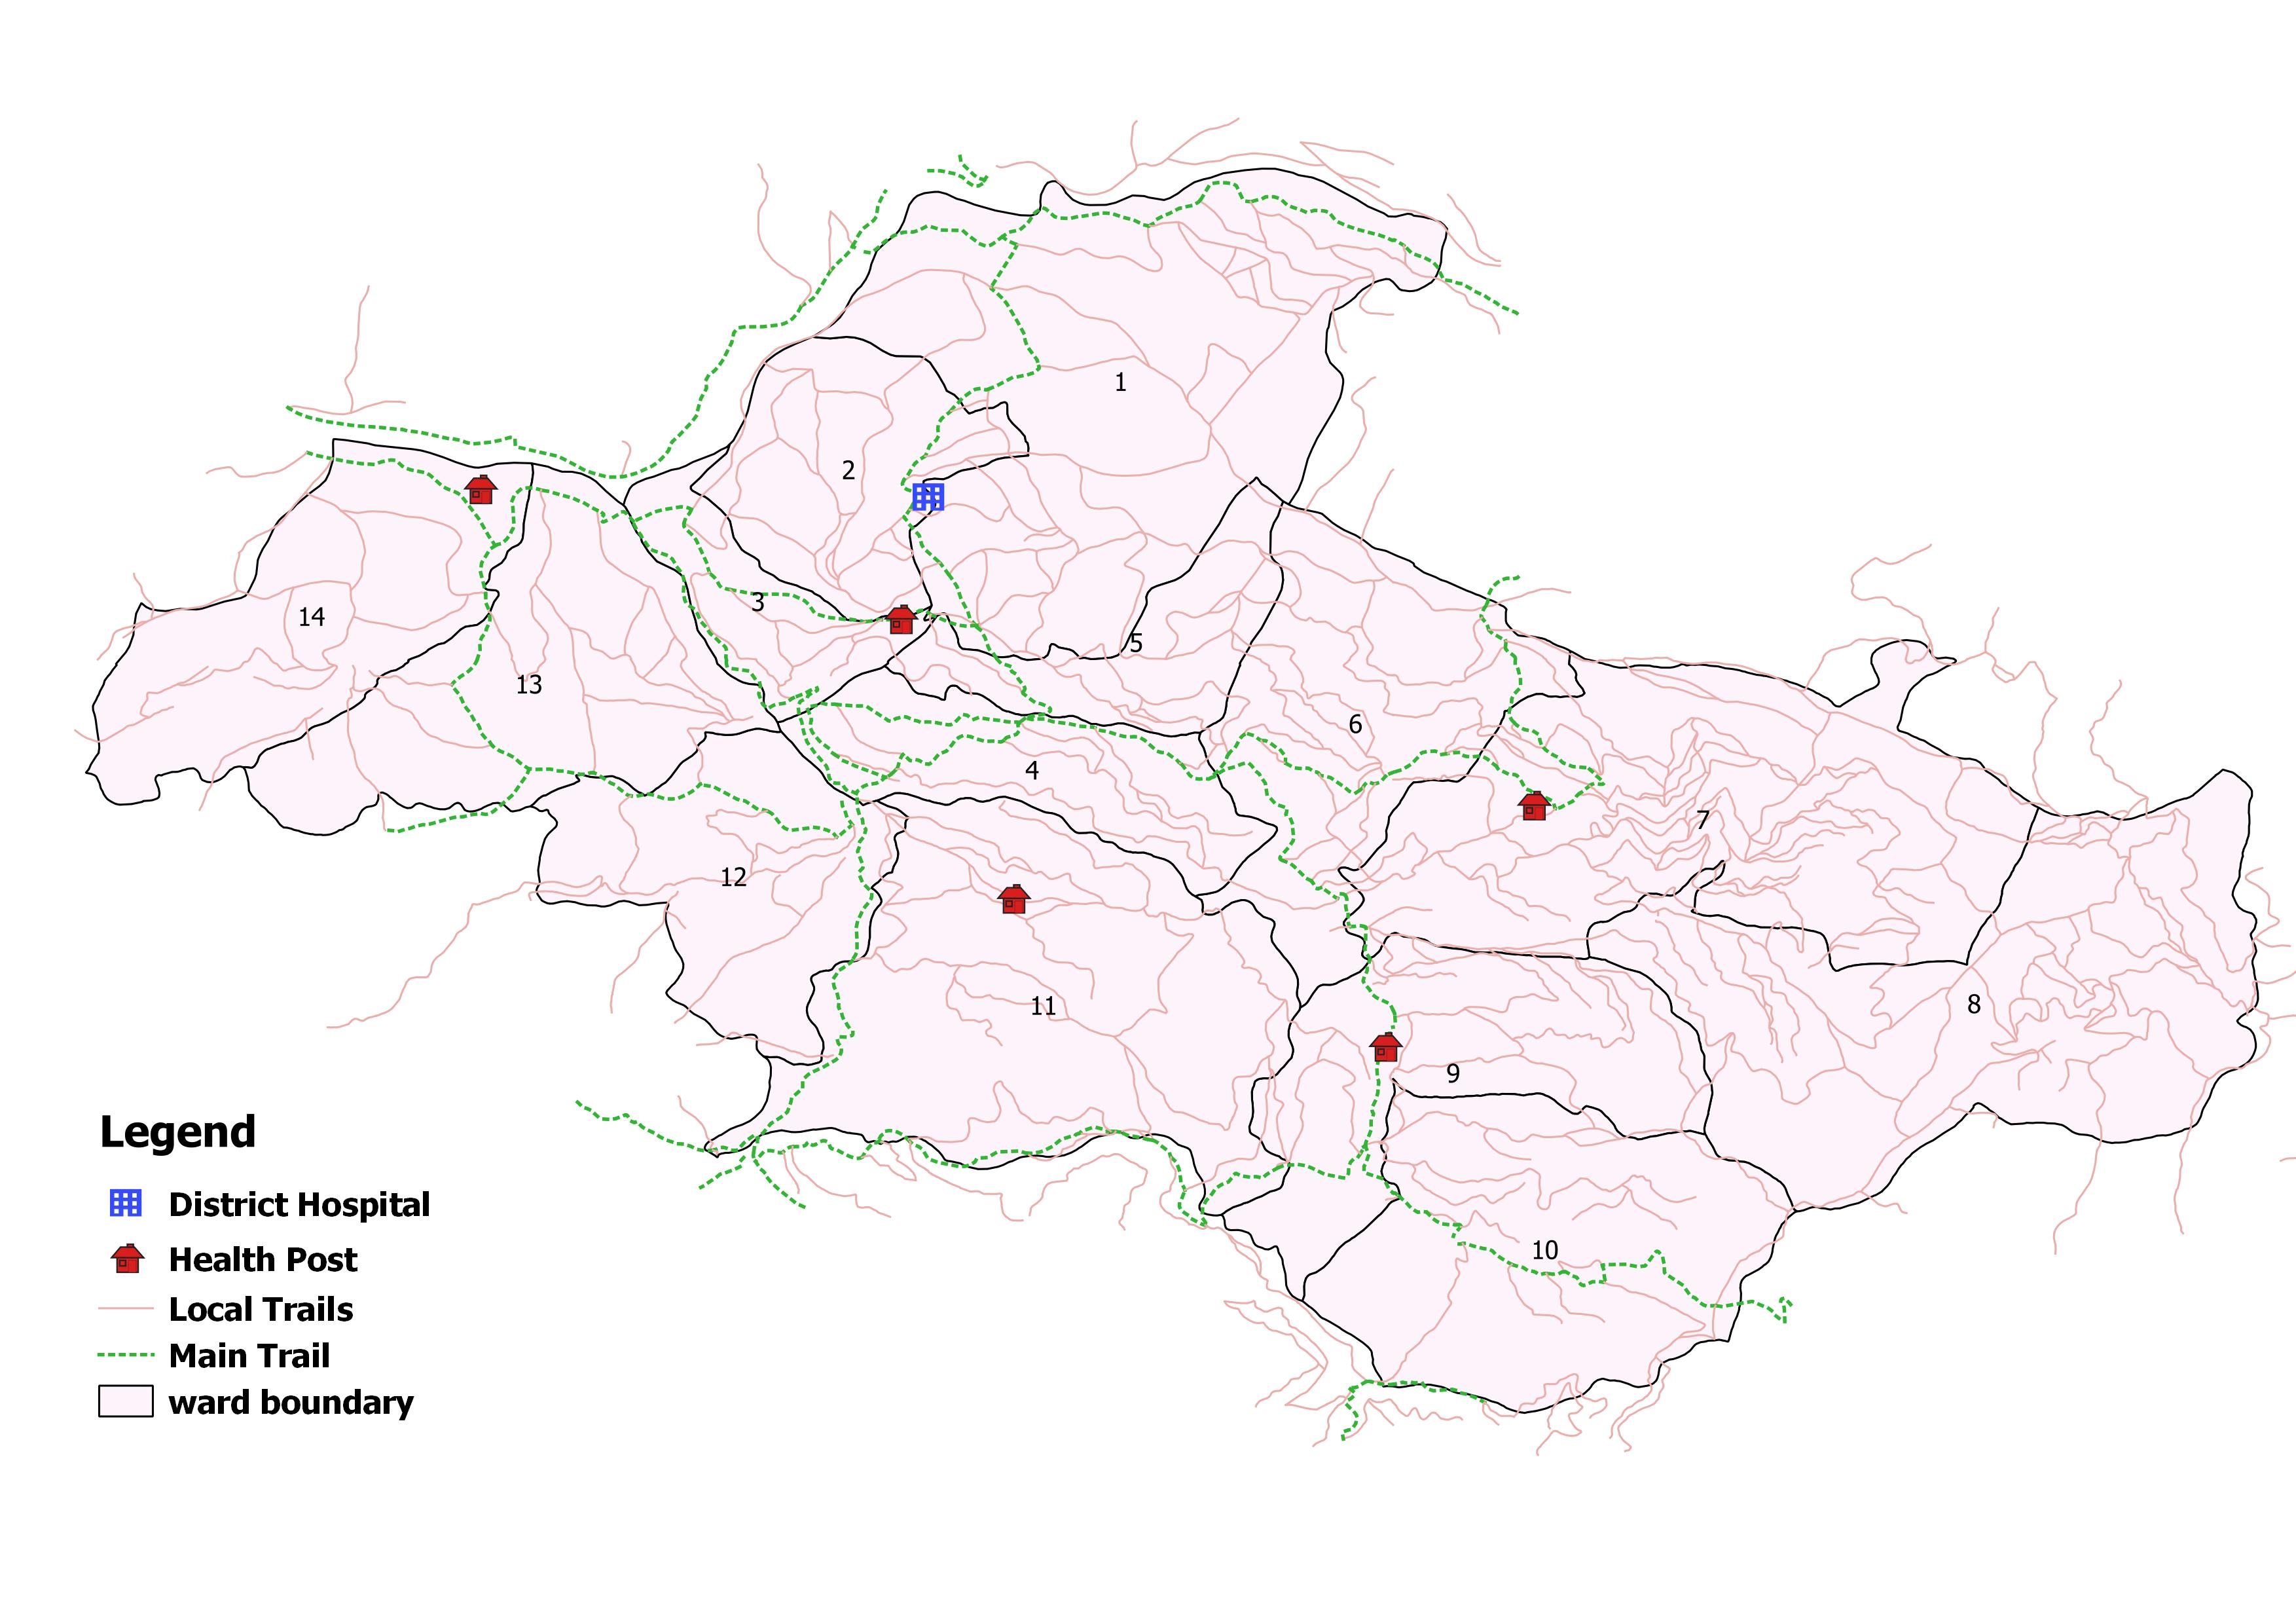
वडा अनुसार स्वास्थ्य संस्थाको जानकारी
| स्वास्थ्यसंस्थाको नाम | वार्ड न | बर्थिंग सेन्टर BEONC/CEONC | महिला स्वास्थ्य स्वयं सेवक संख्या | दक्ष प्रसुतिकर्मी संख्या | परिवार नियोजन *सेवा | स्वीकृत दरबन्दी | दरबन्दी अनुसार पदपूर्ति | करारका कर्मचारी |
|---|---|---|---|---|---|---|---|---|
| जिल्ला अस्पताल | १ | जिल्ला अस्पताल | ० | ८ | ५ साधनहरू | २४ | १३ | १७ |
| मुसिकाेट खलगां | ३ | - | - | २ | ४ साधनहरू | ५ | ३ | - |
| साँख स्वास्थ्य चाैकी | ७ | प्रसुति केन्द्र | ५ | १ | ४ साधनहरू | ५ | ५ | २ |
| भलक्स्वाचा स्वास्थ्य चाैकी | ११ | प्रसुति केन्द्र | ७ | २ | ४ साधनहरू | ५ | ५ | १ |
| चाैखवांग | ९ | - | ४ | १ | ३ साधनहरू | ५ | ४ | - |
| छिवांग स्वास्थ्य चाैकी | १४ | प्रसुति केन्द्र | ५ | २ | ३ साधनहरू | ५ | ६ | १ |
| आधारभूत स्वास्थ्य सेवा केन्द्र समिबोट | २ | - | २ | - | ३ साधनहरू | - | - | १ |
| शहरी स्वास्थ्य केन्द्र, झुलखेत | ६ | - | - | १ | ३ साधनहरू | - | - | ४ |
| आधारभूत स्वास्थ्य सेवा केन्द्र दहबाँग | ६ | - | २ | - | ३ साधनहरू | - | २ | - |
| आधारभूत स्वास्थ्य सेवा केन्द्र घोरखानी | ८ | - | १ | - | ३ साधनहरू | - | - | १ |
| आधारभूत स्वास्थ्य सेवा केन्द्र चुन | १० | - | ४ | - | ३ साधनहरू | - | - | १ |
| आधारभूत स्वास्थ्य सेवा केन्द्र पुरिनचौर | १२ | - | ४ | - | ३ साधनहरू | - | - | २ |
| आधारभूत स्वास्थ्य सेवा केन्द्र छिंग | १ | - | ४ | - | ३ साधनहरू | - | - | २ |
| आधारभूत स्वास्थ्य सेवा केन्द्र कोटचौतारा | ४ | - | २ | - | ३ साधनहरू | - | १ | १ |
| आधारभूत स्वास्थ्य सेवा केन्द्र थर्पु | ५ | - | २ | १ | ३ साधनहरू | - | १ | - |
| शहरी स्वास्थ्य केन्द्र, नुनथला | ८ | - | २ | - | ३ साधनहरू | - | - | २ |
| आधारभूत स्वास्थ्य सेवा केन्द्र दोपाई | १३ | - | २ | - | ३ साधनहरू | - | १ | १ |
| शहरी स्वास्थ्य केन्द्र, कैलदेउ | १ | - | १ | - | ३ साधनहरू | - | १ | १ |
| शहरी स्वास्थ्य केन्द्र, माछिमी | ३ | - | १ | - | ३ साधनहरू | - | २ | - |
| कुल कर्मचारी संख्या | ४८ | १८ | ४९ | ४४ | ३७ | |||
स्वास्थ्य सेवाको लागि मानव संसाधन
- CEONC साइटहरू१
- BEONC साइटहरू-
- आइयुसीडी तथा इम्पलान्ट सेवा प्रदायक११
- एकीकृत बालरोग व्यवस्थापन (IMCI) प्रशिक्षित कर्मचारी२५
- जनसंख्या (प्रति मस्वास्वका) ७३७
- जनसंख्या (प्रति स्वास्थ्यकर्मी) ८०४
- अनुमानित गर्भवति (प्रति दक्ष प्रसुतिकर्मी) ४२
- अनुमानित गर्भवति (प्रति बर्थिङ्ग सेन्टर) -
- जनसंख्या (प्रति स्वास्थ्य संस्था) (अस्पताल,प्रस्वाके र स्वाचौ सहित) -
- जनसंख्या (प्रति सरकारी अस्पताल) ३५३७७
- जनसंख्या (प्रति अस्पताल र नर्सिंग होम (सबै) ८८४४
मातृशिशु बालस्वास्थ्य र परिवार नियोजन सेवा उपयोगको अवस्था
स्वास्थ्य सूचना व्यवस्थापन प्रणाली २०८१प्रमूख स्वास्थ्य सेवाहरूको उपयोगको तुलनात्मक अवस्था
| सूचक | मुसिकोट नगरपालिका | कर्णाली प्रदेश २०७८/७९ | राष्ट्रीय २०७८/७९ | |||
|---|---|---|---|---|---|---|
| - | - | २०८०/८१ | ||||
| खाेप |
ग्राफ
तालिका
|
|||||
| बि.सि.जि. कभरेज | - | - | ० | ९२ | १०३.५ | |
| २३ महिनाभित्र पूर्ण खोप प्राप्त गरेका बालबालिका (%) | - | - | ० | ० | ० | |
| डि.पि.टि. - हेप बि - हिव ३ कभरेज | - | - | ० | ९४ | ९५.२ | |
| दादुरा रूबेला १ (९-११ महिना) कभरेज | - | - | ० | ९५ | ९४.७ | |
| जे.इ कभरेज | - | - | ० | ९६ | ९५.९ | |
| टि.डी. २ र टि. डी. २+ कभरेज | - | - | ० | ६६ | ७१.७ | |
| पोषण |
ग्राफ
तालिका
|
|||||
| कम जन्म तौल भएका नवजात शिशुको प्रतिशत | - | - | ० | ६.८ | ९.४ | |
| नयाँ तौल लिएका १ वर्ष मुनिका शिशुहरुको प्रतिशत | - | - | ० | १२० | १०४.१ | |
| नयाँ तौल लिएका २ वर्ष मुनिका शिशुहरु मध्ये अति जोखिम अवस्थाका बालबालिकाहरुको प्रतिशत | - | - | ० | ४.१ | ३.६ | |
| गर्भवती अवस्थामा १८० दिन आइरन चक्की प्राप्त गरेका गर्भवती महिलाहरुको प्रतिशत | - | - | ० | ७३ | ६० | |
| सुत्केरी अवस्थामा भिटामिन ए प्राप्त गरेका महिलाहरुको प्रतिशत | - | - | ० | ८८ | ७६.३ | |
| नवजात शिशु तथा बाल रोगको एकीकृत व्यस्थापन |
ग्राफ
तालिका
|
|||||
| नाभी मलम लगाएका नवजात शिशुको प्रतिशत | - | - | ० | ९६ | ८२.९ | |
| ब्याक्टेरियाको गम्भीर संक्रमण भएकामध्ये जेन्टामाईसिन सुईद्वारा पूर्ण उपचार पाएको प्रतिशत | - | - | ० | ७५ | ४७.४ | |
| नयाँ निमोनिया बिरामीको दर (प्रति हजार पाँच वर्षमुनिका बालबालिकाहरुमा) | - | - | ० | ११३ | ३६.८ | |
| नयाँ एआरआई (स्वाशप्रश्वाका) बिरामी मध्ये कडा निमोनिया भएका बिरामीको प्रतिशत | - | - | ० | ०.४१ | ०.१८ | |
| नयाँ झाडापखालाका बिरामीको दर (प्रति हजार पाँच वर्ष मुनिका बालबालिकाहरुमा) | - | - | ० | ५७९ | ३५२.४ | |
| ५ वर्ष मुनिका झाडापखालाका बिरामी मध्ये जिंक र पुनर्जलीय झोलबाट उपचार गरेको प्रतिशत | - | - | ० | ९५ | ९४.५ | |
| जम्मा नवजात शिशु मृत्यु संख्या | - | - | ० | १९९ | १९१४ | |
| सुरक्षित मातृत्व तथा परिवार नियोजन |
ग्राफ
तालिका
|
|||||
| प्परोटोकल अनुसार पहिलो पटक गर्भवती जाँच गराएका गर्भवती महिलाहरुको प्रतिशत | - | - | ० | १२२ | ९१.४ | |
| प्रजनन् उमेरका महिलाहरुमा परिवार नियोजनको प्रयोगकर्ता दर (आधुनिक साधन) | - | - | ० | ० | ० | |
| ४ पटक गर्भवती जाँच (महिना: ४,६,८,९/हप्ता: १६, २०-२४,३२ र ३६) महिलाहरुको प्रतिशत | - | - | ० | ७३ | ७९.४ | |
| स्वास्थ्य संस्था प्रसुति दर | - | - | ० | ८३ | ७९ | |
| दक्ष प्रसुतिकर्मी/स्वास्थ्यकर्मीद्वारा प्रसुति गराएको प्रतिशत | - | - | ० | ७० | ७५ | |
| प्रोटोकल अनुसार ४ पटक (आ.व २०७८/७९ सम्म ३ पटक) सुत्केरी जाँच गराउने आमाहरुको प्रतिशत | - | - | ० | ५३ | ४०.८ | |
| जम्मा मातृ मृत्यु संख्या | - | - | ० | १७ | २३१ | |
| परिवार नियोजन सेवाका नयाँ सेवाग्राही दर (प्रजनन उमेरका महिलाहरु मध्ये) | - | - | ० | १९ | ११.५ | |
| औलो रोग, क्षय रोग, कुष्ठरोग र एचआईभी |
ग्राफ
तालिका
|
|||||
| औलोको स्लाइड नमुना पोजेटिभ दर | - | - | ० | ०.२५ | ०.१७ | |
| डेंगुको जम्मा विरामी संख्या | - | - | ० | ० | ० | |
| आयातित औलोरोगको प्रतिशत (नयाँ औलो रोग मध्ये | - | - | ० | ६३ | ८९.५ | |
| जम्मा औलो रोग मध्ये प्लाज्मोडियम फाल्सिपारमको अनुपात | - | - | ० | २.१ | २२.८ | |
| नयाँ क्षयरोगी बिरामी पत्ता लागेको दर | - | - | ० | ९७ | १२९.१ | |
| क्षयरोगको उपचार सफलता दर | - | - | ० | ९१ | ९१.५ | |
| कुष्ठरोगको रोग प्रकोप दर (प्रति १०००० मा) | - | - | ० | ०.५ | ० | |
| ए. आर. टी. उपचारमा रहेका जम्मा एच. आइ. भी. पोजेटिभको संख्या | - | - | ० | ६९१ | २२१५२ | |
| उपचारात्मक सेवा |
ग्राफ
तालिका
|
|||||
| ओ पि डी मा आएका बिरामी मध्ये नयाँ बिरामीको दर | - | - | ० | १०५ | ९२ | |
शीर्ष १० स्वास्थ्य अवस्थाको सूची
स्वास्थ्य सूचना व्यवस्थापन प्रणाली २०८१-०८२स्वास्थ्य क्षेत्रमा बजेट
- सशर्त स्वास्थ्यमा छुट्याएको बजेट
- समानीकरणबाट विनियोजित स्वास्थ्य बजेट
- अन्य श्रोतबाट बिनियोजित स्वास्थ्य बजेट
| बजेट | मुसिकोट नगरपालिका | |||||
|---|---|---|---|---|---|---|
| २०७९/८० | २०८०/८१ | २०७९/८० | ||||
| ग्राफ | ||||||
| पालिकाको कुल बजेट (रु ) | ८६७,२७१,५२५ | ७४८,६२७,५२५ | ८६७,२७१,५२५ | |||
| स्वास्थ्य बजेट (सबै स्रोत) | ४६,३००,००० | ५०,२६०,४५० | ४६,३००,००० | |||
| सशर्त स्वास्थ्यमा छुट्याएको बजेट | ३५,५००,००० | ३९,३४७,००० | ३५,५००,००० | |||
| समानीकरणबाट विनियोजित स्वास्थ्य बजेट | १०,८००,००० | १०,९१३,४५० | १०,८००,००० | |||
| अन्य श्रोतबाट बिनियोजित स्वास्थ्य बजेट | - | |||||
| बजेट खर्च (%) | ९६ | ९० | ९६ | |||
| तालिका | ||||||
महत्वपूर्ण सम्पर्क
Musikot Municipality
ठेगाना : खलंगा, रूकुम (पक्ष्चिम )
टेलिफोन : ०८८५३०२६१
वेबसाइट : http://musikotmun.gov.np

यो प्रोफाइल अमेरिकी अन्तर्राष्ट्रिय विकास नियोग (युएसएआइडी) मार्फत अमेरिकी जनताहरुको सहयोगका कारण सम्भव बनेको हो । यो प्रतिवेदन भित्रका विषयवस्तु र सामग्री स्वास्थ्यका लागि सक्षम प्रणालीका एकल जिम्मेवारी हुन् र तिनले युएसएआइडी वा अमेरिकी सरकारको विचारको प्रतिविम्बित गर्छन् भन्ने जरुरी छैन ।