संक्षिप्त परिचय नरैनापुर गाउँपालिका
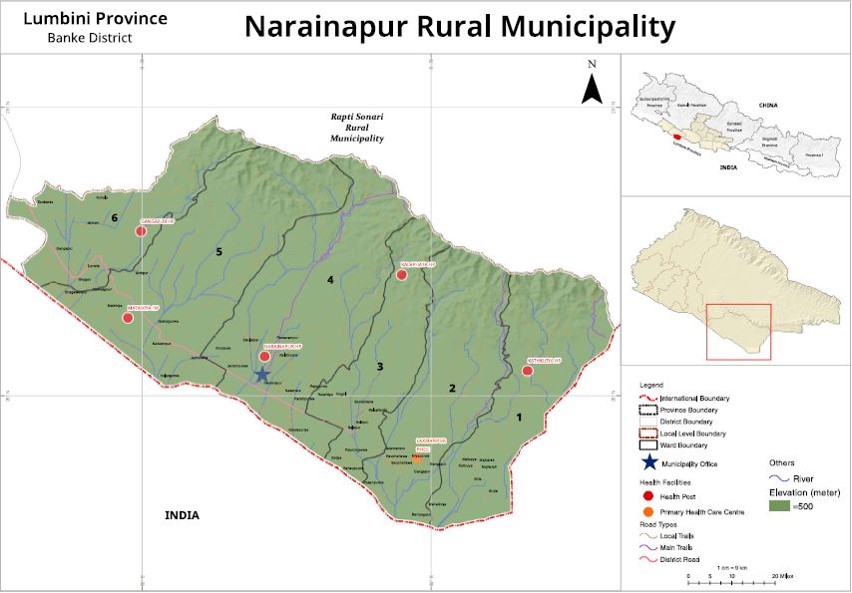
यस नरैनापुर गाउँपालिका लुम्बिनी प्रदेश अन्तर्गत बाँके जिल्लामा अवस्थित छ । कुल १७२.३४ कि.मी क्षेत्रफलमा फैलिएको यस नरैनापुर गाउँपालिका उत्तर तर्फ बाँके जिल्लाको राप्तीसोनारी गाउँपालिका,दक्षिण तर्फ भारतको सिमाना, पश्चिम तर्फ बाँके जिल्लाको डुडुवा गाउँपालिका र पूर्व तर्फ पनि भारतको सिमाना जोड्ने गरेको छ । यस गाउँपालिकामा ६ वटा वडा; कटकुइया, लक्ष्मणपुर, कालाफाँटा, नरैनापुर, मटेहिया तथा गंगापुर रहेको छ ।
जनसाङ्खिक सूचक
-
कूल जनसंख्या १
४४,९५८
/ -
१ बर्ष भन्दा मुनिको जनसंख्या १
८६३
/ -
पाँच बर्ष भन्दा मुनिको जनसंख्या १
४,१९२
/ -
किशोरावस्था (१०-१९ बर्ष) को जनसंख्या १
९,७९९
/ -
प्रजनन उमेरका महिला (१५ -४९ बर्ष ) १
१२,५१६
/ -
अनुमानित गर्भवती महिलाहरु १
१,०५२
/ -
अनुमानित जिवित जन्मको संख्या १
८८७
/ -
परिवारमा अनुपस्थित (विदेशमा बस्ने) जनसंख्या २
८०६
-
मोबाइल फोन भएका घरधुरी (%) २
२
-
लैङ्गिक अनुपात २
१०६
-
१४ बर्ष र सो भन्दा कम उमेरका जनसंख्या १
१४,४४५
/ -
६५ बर्ष र सो भन्दा माथि उमेरका जनसंख्या २
१,७३०
उमेर र लिंगको आधारमा जनसंख्या वितरण
जनगणना २०६८जातिगत आधारमा जनसंख्या वितरण
जनगणना २०६८वार्ड अनुसार जनसंख्या वितरण
जनगणना २०६८स्वास्थ्य सेवा प्रवाह गर्ने संस्थाहरु

- अस्पताल -
- प्रास्वाके १
- स्वास्थ्य चौकी ५
- सामुदायिक स्वास्थ्य ईकाई १
- शहरी स्वास्थ्य केन्द्र -
- गाउँघर क्लिनिक १२
- खोप क्लिनिक ३२
- आधारभूत स्वस्थ सेवाकेन्द्र -
- बर्थिंग सेन्टर ६
सरकारी संस्था
- अस्पताल तथा नर्सिंग होम -
- पोलिक्लिनिक -
- औषधि पसल -
निजी (गैर-सरकारी संस्था समेत)
अन्य स्वास्थ्य केन्द्रहरु
- माइक्रोस्कोपी केन्द्र १
- एआरटि केन्द्र -
- एचाईभी परीक्षण केन्द्र -
- क्षयरोग उपचार केन्द्र ६
- आयुर्वेद अस्पताल/केन्द्र -
- आँखा अस्पताल/केन्द्र -
अस्पताल शैयाहरू
- सार्वजनिक -
- निजी -
वडा अनुसार स्वास्थ्य संस्थाको जानकारी
| स्वास्थ्यसंस्थाको नाम | वार्ड न | बर्थिंग सेन्टर BEONC/CEONC | महिला स्वास्थ्य स्वयं सेवक संख्या | दक्ष प्रसुतिकर्मी संख्या | परिवार नियोजन *सेवा | स्वीकृत दरबन्दी | दरबन्दी अनुसार पदपूर्ति | करारका कर्मचारी |
|---|---|---|---|---|---|---|---|---|
| कालापफाँटा स्वास्थ्य चाैकी | ३ | प्रसुती केन्द्र | ११ | ३ | ४ साधनहरू | ६ | ४ | १ |
| कटकुइया स्वास्थ्य चाैकी | १ | प्रसुती केन्द्र | ९ | २ | ४ साधनहरू | ६ | २ | ३ |
| लक्ष्मणापुर प्राथमीक स्वास्थ्य केन्द्र | २ | प्रसुती केन्द्र | ११ | २ | ४ साधनहरू | १० | ६ | ५ |
| मटहइया स्वास्थ्य चाैकी | ५ | प्रसुती केन्द्र | १५ | २ | ४ साधनहरू | ६ | ५ | २ |
| नरैनापुर स्वास्थ्य चाैकी | ४ | प्रसुती केन्द्र | १० | २ | ४ साधनहरू | ६ | ४ | १ |
| गँगापुर स्वास्थ्य चाैकी | ६ | प्रसुती केन्द्र | १२ | ३ | ५ साधनहरू | ६ | ७ | १ |
| शाेनबषार्सा मुदायीक इकार्इ | ६ | हाेइन | ० | ० | ३ साधनहरू | - | - | २ |
| कुल कर्मचारी संख्या | ६८ | १४ | ४० | २८ | १५ | |||
स्वास्थ्य सेवाको लागि मानव संसाधन
- CEONC साइटहरू-
- BEONC साइटहरू१
- आइयुसीडी तथा इम्पलान्ट सेवा प्रदायक६
- एकीकृत बालरोग व्यवस्थापन (IMCI) प्रशिक्षित कर्मचारी३५
- जनसंख्या (प्रति मस्वास्वका) ६६१
- जनसंख्या (प्रति स्वास्थ्यकर्मी) १६०६
- अनुमानित गर्भवति (प्रति दक्ष प्रसुतिकर्मी) ७५
- अनुमानित गर्भवति (प्रति बर्थिङ्ग सेन्टर) १७५
- जनसंख्या (प्रति स्वास्थ्य संस्था) (अस्पताल,प्रस्वाके र स्वाचौ सहित) ७४९३
- जनसंख्या (प्रति सरकारी अस्पताल) -
- जनसंख्या (प्रति अस्पताल र नर्सिंग होम (सबै) -
मातृशिशु बालस्वास्थ्य र परिवार नियोजन सेवा उपयोगको अवस्था
स्वास्थ्य सूचना व्यवस्थापन प्रणाली २०८०प्रमूख स्वास्थ्य सेवाहरूको उपयोगको तुलनात्मक अवस्था
| सूचक | नरैनापुर गाउँपालिका | लुम्बिनी प्रदेश २०७८/७९ | राष्ट्रीय २०७८/७९ | |||
|---|---|---|---|---|---|---|
| २०७६/७७ | २०७७/७८ | २०७८/७९ | ||||
| खाेप |
ग्राफ
तालिका
|
|||||
| बि.सि.जि. कभरेज | १२६.७ | १५०.३ | १२२.९ | १०३.१ | १०३.५ | |
| २३ महिनाभित्र पूर्ण खोप प्राप्त गरेका बालबालिका (%) | ० | ० | ० | ० | ० | |
| डि.पि.टि. - हेप बि - हिव ३ कभरेज | ११०.६ | १२६.८ | १०७.३ | ९६.६ | ९५.२ | |
| दादुरा रूबेला १ (९-११ महिना) कभरेज | १०२.९ | १२४ | १०८.८ | ९६.७ | ९४.७ | |
| जे.इ कभरेज | ८७.६ | १०८ | ११० | ९८.९ | ९५.९ | |
| टि.डी. २ र टि. डी. २+ कभरेज | १०३ | १२०.६ | ९५ | ७३.९ | ७१.७ | |
| पोषण |
ग्राफ
तालिका
|
|||||
| कम जन्म तौल भएका नवजात शिशुको प्रतिशत | ९ | १०.८ | ११.३ | १२ | ९.४ | |
| नयाँ तौल लिएका १ वर्ष मुनिका शिशुहरुको प्रतिशत | ९१.१ | ९५.७ | ११५.९ | १०९ | १०४.१ | |
| नयाँ तौल लिएका २ वर्ष मुनिका शिशुहरु मध्ये अति जोखिम अवस्थाका बालबालिकाहरुको प्रतिशत | ११.६ | ६.३ | ९.३ | ३.५ | ३.६ | |
| गर्भवती अवस्थामा १८० दिन आइरन चक्की प्राप्त गरेका गर्भवती महिलाहरुको प्रतिशत | ९३.२ | १०४.४ | ८६.४ | ७५.८ | ६० | |
| सुत्केरी अवस्थामा भिटामिन ए प्राप्त गरेका महिलाहरुको प्रतिशत | १६८.४ | १७४.४ | १९१.९ | ९८.२ | ७६.३ | |
| नवजात शिशु तथा बाल रोगको एकीकृत व्यस्थापन |
ग्राफ
तालिका
|
|||||
| नाभी मलम लगाएका नवजात शिशुको प्रतिशत | ९५.१ | ९६.२ | ९८.९ | ९४.२ | ८२.९ | |
| ब्याक्टेरियाको गम्भीर संक्रमण भएकामध्ये जेन्टामाईसिन सुईद्वारा पूर्ण उपचार पाएको प्रतिशत | ६२.५ | ० | ३९.९ | ३९.५ | ४७.४ | |
| नयाँ निमोनिया बिरामीको दर (प्रति हजार पाँच वर्षमुनिका बालबालिकाहरुमा) | ११०.३ | ५४ | ५८.८ | २९.३ | ३६.८ | |
| नयाँ एआरआई (स्वाशप्रश्वाका) बिरामी मध्ये कडा निमोनिया भएका बिरामीको प्रतिशत | ०.२३ | २.१ | ० | ०.०५ | ०.१८ | |
| नयाँ झाडापखालाका बिरामीको दर (प्रति हजार पाँच वर्ष मुनिका बालबालिकाहरुमा) | ७१३.५ | ७३५.१ | ५०९.३ | ३३९ | ३५२.४ | |
| ५ वर्ष मुनिका झाडापखालाका बिरामी मध्ये जिंक र पुनर्जलीय झोलबाट उपचार गरेको प्रतिशत | ९७.५ | ९७.९ | ९९.१ | ९८.७ | ९४.५ | |
| जम्मा नवजात शिशु मृत्यु संख्या | ६ | १० | २ | ५७३ | १९१४ | |
| सुरक्षित मातृत्व तथा परिवार नियोजन |
ग्राफ
तालिका
|
|||||
| प्परोटोकल अनुसार पहिलो पटक गर्भवती जाँच गराएका गर्भवती महिलाहरुको प्रतिशत | १३२.७ | १४४.४ | १५९.३ | ९३.५ | ९१.४ | |
| प्रजनन् उमेरका महिलाहरुमा परिवार नियोजनको प्रयोगकर्ता दर (आधुनिक साधन) | ० | ० | ० | ० | ० | |
| ४ पटक गर्भवती जाँच (महिना: ४,६,८,९/हप्ता: १६, २०-२४,३२ र ३६) महिलाहरुको प्रतिशत | ९३.२ | १०४.४ | ८६.२ | ७९.७ | ७९.४ | |
| स्वास्थ्य संस्था प्रसुति दर | ११३.९ | १४४.४ | १२५.६ | ९४.२ | ७९ | |
| दक्ष प्रसुतिकर्मी/स्वास्थ्यकर्मीद्वारा प्रसुति गराएको प्रतिशत | १०१.२ | १२४.४ | ११२.६ | ८९.८ | ७५ | |
| प्रोटोकल अनुसार ४ पटक (आ.व २०७८/७९ सम्म ३ पटक) सुत्केरी जाँच गराउने आमाहरुको प्रतिशत | १००.७ | १३८.३ | ११४.९ | ५३.७ | ४०.८ | |
| जम्मा मातृ मृत्यु संख्या | २ | ६ | १ | ७४ | २३१ | |
| परिवार नियोजन सेवाका नयाँ सेवाग्राही दर (प्रजनन उमेरका महिलाहरु मध्ये) | १३.५ | १८.६ | १७.९ | १२.४ | ११.५ | |
| औलो रोग, क्षय रोग, कुष्ठरोग र एचआईभी |
ग्राफ
तालिका
|
|||||
| औलोको स्लाइड नमुना पोजेटिभ दर | ५ | २.२ | ३.३ | ०.२७ | ०.१७ | |
| डेंगुको जम्मा विरामी संख्या | ० | ० | ० | ० | ० | |
| आयातित औलोरोगको प्रतिशत (नयाँ औलो रोग मध्ये | ८३.३ | ९१.४ | ९८.९ | ९५.५ | ८९.५ | |
| जम्मा औलो रोग मध्ये प्लाज्मोडियम फाल्सिपारमको अनुपात | ० | ४० | ४७.२ | ३८.७ | २२.८ | |
| नयाँ क्षयरोगी बिरामी पत्ता लागेको दर | १४२.५ | १२१ | १४६ | १५७.४ | १२९.१ | |
| क्षयरोगको उपचार सफलता दर | १०० | ९३ | ८९.५ | ९१ | ९१.५ | |
| कुष्ठरोगको रोग प्रकोप दर (प्रति १०००० मा) | १.९ | ४.६ | १.४ | ०.९ | ० | |
| ए. आर. टी. उपचारमा रहेका जम्मा एच. आइ. भी. पोजेटिभको संख्या | ० | ० | ० | ४३२६ | २२१५२ | |
| उपचारात्मक सेवा |
ग्राफ
तालिका
|
|||||
| ओ पि डी मा आएका बिरामी मध्ये नयाँ बिरामीको दर | ९०.७ | ७६.४ | ७४.७ | ९४.५ | ९२ | |
शीर्ष १० स्वास्थ्य अवस्थाको सूची
स्वास्थ्य सूचना व्यवस्थापन प्रणाली २०८०-८१स्वास्थ्य क्षेत्रमा बजेट
- सशर्त स्वास्थ्यमा छुट्याएको बजेट
- समानीकरणबाट विनियोजित स्वास्थ्य बजेट
- अन्य श्रोतबाट बिनियोजित स्वास्थ्य बजेट
| बजेट | नरैनापुर गाउँपालिका | |||||
|---|---|---|---|---|---|---|
| २०७७/७८ | २०७८/७९ | २०७९/८० | ||||
| ग्राफ | ||||||
| पालिकाको कुल बजेट (रु ) | ५८२,५०८,३६० | ३२१,०००,००० | ५२८,०८०,००० | |||
| स्वास्थ्य बजेट (सबै स्रोत) | ६३,४०९,००० | ५४,०१६,००० | २३,७००,७०० | |||
| सशर्त स्वास्थ्यमा छुट्याएको बजेट | ३९,१००,००० | ४१,१००,००० | १८,७००,७०० | |||
| समानीकरणबाट विनियोजित स्वास्थ्य बजेट | २४,३०९,००० | १२,९१६,००० | ५,०००,००० | |||
| अन्य श्रोतबाट बिनियोजित स्वास्थ्य बजेट | ||||||
| बजेट खर्च (%) | ७२ | ८६ | - | |||
| तालिका | ||||||
महत्वपूर्ण सम्पर्क
Narainapur Rural Municipality
ठेगाना : नरेैनापुर गाउँपालिका
टेलिफोन : ९८५८०४०२०१
वेबसाइट : http://narainapurmun.gov.np/
स्वास्थ्य शाखा प्रमुख
नाम : नागेन्द्र कुमार साह
सम्पर्क : ९८४४४२३२३१
ईमेल : nagendrasah0031@gmail.com
सूचना अधिकारी
नाम : लक्ष्मी कान्त मिश्रा
सम्पर्क : ९८६८२५००३१

यो प्रोफाइल अमेरिकी अन्तर्राष्ट्रिय विकास नियोग (युएसएआइडी) मार्फत अमेरिकी जनताहरुको सहयोगका कारण सम्भव बनेको हो । यो प्रतिवेदन भित्रका विषयवस्तु र सामग्री स्वास्थ्यका लागि सक्षम प्रणालीका एकल जिम्मेवारी हुन् र तिनले युएसएआइडी वा अमेरिकी सरकारको विचारको प्रतिविम्बित गर्छन् भन्ने जरुरी छैन ।