संक्षिप्त परिचय पञ्चपुरी नगरपालिका
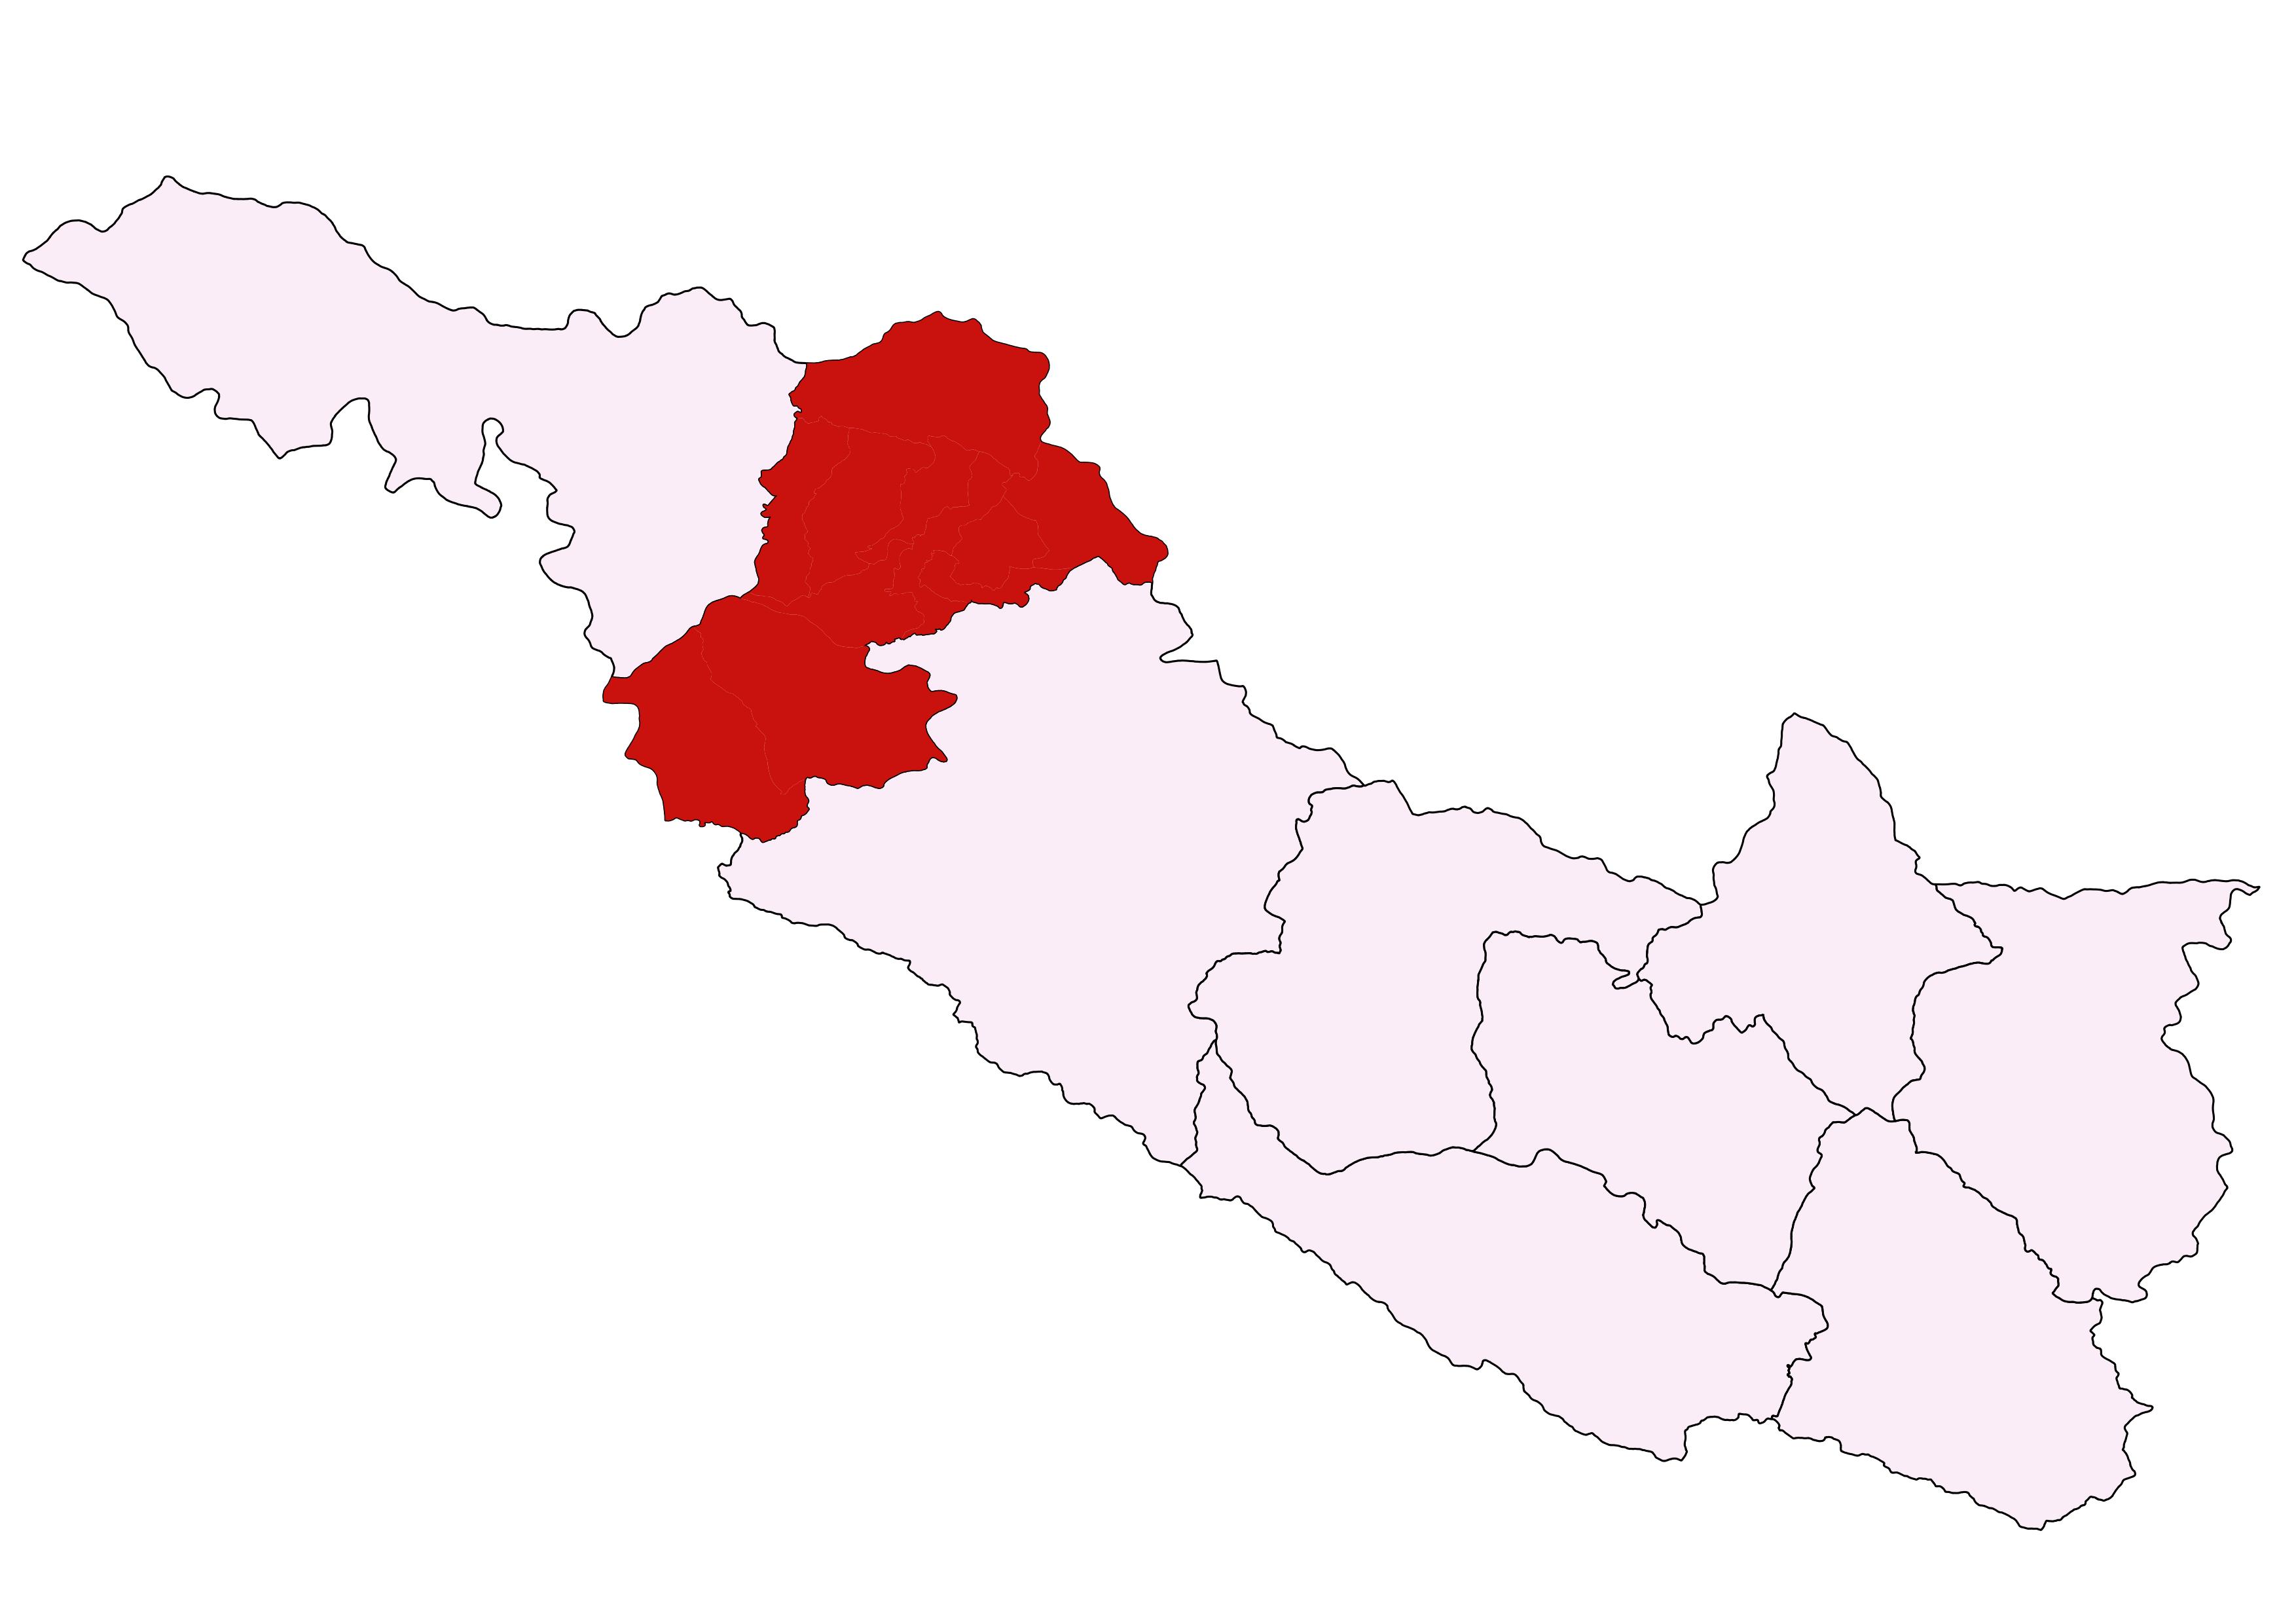
पञ्चपुरी नगरपालिका सुर्खेत जिल्लाको पश्चिम क्षेत्रमा अवस्थित छ। यो नगरपालिका साविकका वावियाचौर, विद्यापुर, छाप्रे, सालकोट र तातापानी गा.वि.स. हरु मिलेर बनेको छ । साबिकको सल्कोट गाबिसलाइ वडा १ ,२,३ मा, बाबियाचौर गाविसलाई ४,५,६ मा, छाप्रे गाविसलाई वडा ७ मा, बिध्यापुर गाबिसलाइ ८,९ मा र तातापानीलाइ १० र ११ मा बिभाजन गरिएको छ। यस नगरपालिकाको केन्द्रको रुपमा हाललाई साबिकको बाबियाचौरलाइ तोकिएको छ । यस नगरपालिकाको क्षेत्रफल करिब ३२९.९ वर्ग कि. मी रहेको छ । यो नगरपालिका सुर्खेत जिल्लाका ५ नगरपालिका मध्ये क्षेत्रफलमा सबैभन्दा ठुलो नगरपालिका हो । यस नगरपालिकामा जातिय रुपमा मिश्रित बसोबास रहेको र बिसेष गरि ब्राह्मण, छेत्री, मगर, दलितहरुको उच्च बसोबास रहेको देखिन्छ।
जनसाङ्खिक सूचक
-
कूल जनसंख्या १
३६,५७८
/ -
१ बर्ष भन्दा मुनिको जनसंख्या १
७९५
/ -
पाँच बर्ष भन्दा मुनिको जनसंख्या १
३,६१६
/ -
किशोरावस्था (१०-१९ बर्ष) को जनसंख्या १
८,८१७
/ -
प्रजनन उमेरका महिला (१५ -४९ बर्ष ) १
१०,७७०
/ -
अनुमानित गर्भवती महिलाहरु १
१,२७४
/ -
अनुमानित जिवित जन्मको संख्या १
८२०
/ -
परिवारमा अनुपस्थित (विदेशमा बस्ने) जनसंख्या २
३,९३९
-
मोबाइल फोन भएका घरधुरी (%) २
६,०८९
-
टेलिभिजन भएका घरधुरी (%) २
९०५
-
लैङ्गिक अनुपात २
९३
-
१४ बर्ष र सो भन्दा कम उमेरका जनसंख्या १
११,५१२
/ -
६५ बर्ष र सो भन्दा माथि उमेरका जनसंख्या २
२,०१९
उमेर र लिंगको आधारमा जनसंख्या वितरण
जनगणना २०७८जातिगत आधारमा जनसंख्या वितरण
जनगणना २०७८वार्ड अनुसार जनसंख्या वितरण
जनगणना २०७८स्वास्थ्य सेवा प्रवाह गर्ने संस्थाहरु

- अस्पताल -
- प्रास्वाके १
- स्वास्थ्य चौकी ४
- सामुदायिक स्वास्थ्य ईकाई ६
- शहरी स्वास्थ्य केन्द्र -
- गाउँघर क्लिनिक ७
- खोप क्लिनिक २४
- आधारभूत स्वस्थ सेवाकेन्द्र ५
- बर्थिंग सेन्टर ६
सरकारी संस्था
- अस्पताल तथा नर्सिंग होम १
- पोलिक्लिनिक -
- औषधि पसल १७
निजी (गैर-सरकारी संस्था समेत)
अन्य स्वास्थ्य केन्द्रहरु
- माइक्रोस्कोपी केन्द्र १
- एआरटि केन्द्र -
- एचाईभी परीक्षण केन्द्र -
- क्षयरोग उपचार केन्द्र ५
- आयुर्वेद अस्पताल/केन्द्र १
- आँखा अस्पताल/केन्द्र १
अस्पताल शैयाहरू
- सार्वजनिक -
- निजी ५
वडा अनुसार स्वास्थ्य संस्थाको जानकारी
| स्वास्थ्यसंस्थाको नाम | वार्ड न | बर्थिंग सेन्टर BEONC/CEONC | महिला स्वास्थ्य स्वयं सेवक संख्या | दक्ष प्रसुतिकर्मी संख्या | परिवार नियोजन *सेवा | स्वीकृत दरबन्दी | दरबन्दी अनुसार पदपूर्ति | करारका कर्मचारी |
|---|---|---|---|---|---|---|---|---|
| साल्कोट प्रा.स्वा.के | २ | बर्थिङ्ग सेन्टर | ७ | ३ | ५ साधनहरू | ११ | १० | ८ |
| बाब्याचौर स्वास्थ्य चौकी | ५ | बर्थिङ्ग सेन्टर | ७ | २ | ५ साधनहरू | ५ | ५ | ५ |
| छाप्रे स्वास्थ्य चौकी | ७ | बर्थिङ्ग सेन्टर | १३ | २ | ५ साधनहरू | ५ | ४ | १ |
| बिद्यापुर स्वास्थ्य चौकी | ९ | बर्थिङ्ग सेन्टर | ८ | २ | ४ साधनहरू | ५ | ५ | १ |
| तातापानी स्वास्थ्य चौकी | ११ | बर्थिङ्ग सेन्टर | १० | २ | ५ साधनहरू | ५ | ५ | १ |
| हाशेगाउँ सामुदायिक स्वास्थ्य इकाइ | १ | बर्थिङ्ग | ५ | १ | ३ साधनहरू | ० | ० | ३ |
| लाटीकाढा सामुदायिक स्वास्थ्य इकाइ | ६ | छैन | ० | ० | ३ साधनहरू | ० | ० | ३ |
| पैसारा सामुदायिक स्वास्थ्य इकाइ | ७ | छैन | ० | ० | ३ साधनहरू | ० | ० | ३ |
| बच्ची सामुदायिक स्वास्थ्य इकाइ | १० | छैन | ० | ० | ३ साधनहरू | ० | ० | ३ |
| सिम्ताचौर | ७ | छैन | ० | ० | ३ साधनहरू | ० | ० | ३ |
| तोक्मा आधारभुत स्वास्थ्य सेवा केन्द्र | ३ | छैन | ११ | ० | ३ साधनहरू | ० | ० | ३ |
| बरैचे आधारभुत स्वास्थ्य सेवा केन्द्र | ४ | छैन | ७ | ० | ३ साधनहरू | ० | ० | ३ |
| चतुरे आधारभुत स्वास्थ्य सेवा केन्द्र चतुरे | ६ | छैन | ९ | ० | ३ साधनहरू | ० | ० | ३ |
| दुलालथाई आधारभुत स्वास्थ्य सेवा कार्यालय | ८ | छैन | १० | ० | ३ साधनहरू | ० | ० | ३ |
| नार्सि आधारभुत स्वास्थ्य सेवा केन्द्र | १० | छैन | ८ | ० | ३ साधनहरू | ० | ० | ३ |
| सान्नेदह सामुदाईक स्वास्थ्य सेवा केन्द्र | ८ | छैन | ० | ० | ३ साधनहरू | ० | ० | ३ |
| कुल कर्मचारी संख्या | ९५ | १२ | ३१ | २९ | ४९ | |||
स्वास्थ्य सेवाको लागि मानव संसाधन
- CEONC साइटहरू-
- BEONC साइटहरू१
- आइयुसीडी तथा इम्पलान्ट सेवा प्रदायक९
- एकीकृत बालरोग व्यवस्थापन (IMCI) प्रशिक्षित कर्मचारी२६
- जनसंख्या (प्रति मस्वास्वका) ३८५
- जनसंख्या (प्रति स्वास्थ्यकर्मी) १२६१
- अनुमानित गर्भवति (प्रति दक्ष प्रसुतिकर्मी) १०६
- अनुमानित गर्भवति (प्रति बर्थिङ्ग सेन्टर) २१२
- जनसंख्या (प्रति स्वास्थ्य संस्था) (अस्पताल,प्रस्वाके र स्वाचौ सहित) ७३१६
- जनसंख्या (प्रति सरकारी अस्पताल) -
- जनसंख्या (प्रति अस्पताल र नर्सिंग होम (सबै) ३६५७८
मातृशिशु बालस्वास्थ्य र परिवार नियोजन सेवा उपयोगको अवस्था
स्वास्थ्य सूचना व्यवस्थापन प्रणाली २०७९०८०प्रमूख स्वास्थ्य सेवाहरूको उपयोगको तुलनात्मक अवस्था
| सूचक | पञ्चपुरी नगरपालिका | कर्णाली प्रदेश २०७८/७९ | राष्ट्रीय २०७८/७९ | |||
|---|---|---|---|---|---|---|
| २०७९/८० | २०७७/७८ | २०७८/७९ | ||||
| खाेप |
ग्राफ
तालिका
|
|||||
| बि.सि.जि. कभरेज | ७१.१ | ९१.१ | ८३.६ | ९२ | १०३.५ | |
| २३ महिनाभित्र पूर्ण खोप प्राप्त गरेका बालबालिका (%) | ७९.८ | ९३.६ | ९६.३ | ० | ० | |
| डि.पि.टि. - हेप बि - हिव ३ कभरेज | ८६.४ | ९३.६ | ९६.३ | ९४ | ९५.२ | |
| दादुरा रूबेला १ (९-११ महिना) कभरेज | ७७.३ | ८५.१ | ९४.४ | ९५ | ९४.७ | |
| जे.इ कभरेज | ७९ | ७०.४ | ९५.७ | ९६ | ९५.९ | |
| टि.डी. २ र टि. डी. २+ कभरेज | ५२.९ | ६३ | ६२ | ६६ | ७१.७ | |
| पोषण |
ग्राफ
तालिका
|
|||||
| कम जन्म तौल भएका नवजात शिशुको प्रतिशत | ६ | ७.१ | ८.८ | ६.८ | ९.४ | |
| नयाँ तौल लिएका १ वर्ष मुनिका शिशुहरुको प्रतिशत | ८८.७ | ११४.९ | १५६.८ | १२० | १०४.१ | |
| नयाँ तौल लिएका २ वर्ष मुनिका शिशुहरु मध्ये अति जोखिम अवस्थाका बालबालिकाहरुको प्रतिशत | १.४ | २.४ | १.१ | ४.१ | ३.६ | |
| गर्भवती अवस्थामा १८० दिन आइरन चक्की प्राप्त गरेका गर्भवती महिलाहरुको प्रतिशत | ७६.७ | ७६ | ७१.८ | ७३ | ६० | |
| सुत्केरी अवस्थामा भिटामिन ए प्राप्त गरेका महिलाहरुको प्रतिशत | ६९.२ | ८५.१ | ७१.८ | ८८ | ७६.३ | |
| नवजात शिशु तथा बाल रोगको एकीकृत व्यस्थापन |
ग्राफ
तालिका
|
|||||
| नाभी मलम लगाएका नवजात शिशुको प्रतिशत | ९८ | ९५.९ | ९७.४ | ९६ | ८२.९ | |
| ब्याक्टेरियाको गम्भीर संक्रमण भएकामध्ये जेन्टामाईसिन सुईद्वारा पूर्ण उपचार पाएको प्रतिशत | १०० | ८६ | १०० | ७५ | ४७.४ | |
| नयाँ निमोनिया बिरामीको दर (प्रति हजार पाँच वर्षमुनिका बालबालिकाहरुमा) | ८९ | ९३ | १२० | ११३ | ३६.८ | |
| नयाँ एआरआई (स्वाशप्रश्वाका) बिरामी मध्ये कडा निमोनिया भएका बिरामीको प्रतिशत | २.६ | २.१ | ३.१ | ०.४१ | ०.१८ | |
| नयाँ झाडापखालाका बिरामीको दर (प्रति हजार पाँच वर्ष मुनिका बालबालिकाहरुमा) | २०४ | १२३ | १५५ | ५७९ | ३५२.४ | |
| ५ वर्ष मुनिका झाडापखालाका बिरामी मध्ये जिंक र पुनर्जलीय झोलबाट उपचार गरेको प्रतिशत | १०१.६ | ९९.८ | ९९.९ | ९५ | ९४.५ | |
| जम्मा नवजात शिशु मृत्यु संख्या | ० | ० | ० | १९९ | १९१४ | |
| सुरक्षित मातृत्व तथा परिवार नियोजन |
ग्राफ
तालिका
|
|||||
| प्परोटोकल अनुसार पहिलो पटक गर्भवती जाँच गराएका गर्भवती महिलाहरुको प्रतिशत | ४७.१ | ८६.९ | ८२.१ | १२२ | ९१.४ | |
| प्रजनन् उमेरका महिलाहरुमा परिवार नियोजनको प्रयोगकर्ता दर (आधुनिक साधन) | २४.६ | २३.६ | २३.२ | ० | ० | |
| ४ पटक गर्भवती जाँच (महिना: ४,६,८,९/हप्ता: १६, २०-२४,३२ र ३६) महिलाहरुको प्रतिशत | ७६.७ | ७५.९ | ६६.६ | ७३ | ७९.४ | |
| स्वास्थ्य संस्था प्रसुति दर | ६४.९ | ८२.८ | ६३.३ | ८३ | ७९ | |
| दक्ष प्रसुतिकर्मी/स्वास्थ्यकर्मीद्वारा प्रसुति गराएको प्रतिशत | ६४.३ | ० | ० | ७० | ७५ | |
| प्रोटोकल अनुसार ४ पटक (आ.व २०७८/७९ सम्म ३ पटक) सुत्केरी जाँच गराउने आमाहरुको प्रतिशत | ६७.४ | २२ | ४१.८ | ५३ | ४०.८ | |
| जम्मा मातृ मृत्यु संख्या | ० | ० | ० | १७ | २३१ | |
| परिवार नियोजन सेवाका नयाँ सेवाग्राही दर (प्रजनन उमेरका महिलाहरु मध्ये) | १६.६ | १८.१ | १७.७ | १९ | ११.५ | |
| औलो रोग, क्षय रोग, कुष्ठरोग र एचआईभी |
ग्राफ
तालिका
|
|||||
| औलोको स्लाइड नमुना पोजेटिभ दर | ०.३७ | ०.७२ | ० | ०.२५ | ०.१७ | |
| डेंगुको जम्मा विरामी संख्या | ० | ० | ० | ० | ० | |
| आयातित औलोरोगको प्रतिशत (नयाँ औलो रोग मध्ये | १०० | १०० | ० | ६३ | ८९.५ | |
| जम्मा औलो रोग मध्ये प्लाज्मोडियम फाल्सिपारमको अनुपात | ० | ० | ० | २.१ | २२.८ | |
| नयाँ क्षयरोगी बिरामी पत्ता लागेको दर | १०६.२ | ८१.३ | ८७.१ | ९७ | १२९.१ | |
| क्षयरोगको उपचार सफलता दर | ९३.५ | ९१.३ | ८७.१ | ९१ | ९१.५ | |
| कुष्ठरोगको रोग प्रकोप दर (प्रति १०००० मा) | ०.२७ | ०.७९ | ०.८३ | ०.५ | ० | |
| ए. आर. टी. उपचारमा रहेका जम्मा एच. आइ. भी. पोजेटिभको संख्या | ० | ० | ० | ६९१ | २२१५२ | |
| उपचारात्मक सेवा |
ग्राफ
तालिका
|
|||||
| ओ पि डी मा आएका बिरामी मध्ये नयाँ बिरामीको दर | ८२.० | ६९ | ६१ | १०५ | ९२ | |
शीर्ष १० स्वास्थ्य अवस्थाको सूची
स्वास्थ्य सूचना व्यवस्थापन प्रणाली २०७९०८०स्वास्थ्य क्षेत्रमा बजेट
- सशर्त स्वास्थ्यमा छुट्याएको बजेट
- समानीकरणबाट विनियोजित स्वास्थ्य बजेट
- अन्य श्रोतबाट बिनियोजित स्वास्थ्य बजेट
| बजेट | पञ्चपुरी नगरपालिका | |||||
|---|---|---|---|---|---|---|
| २०७८/७९ | २०७९/८० | २०८०/८१ | ||||
| ग्राफ | ||||||
| पालिकाको कुल बजेट (रु ) | ४०८,३००,००० | ८६२,०४८,६५१ | ६६९,८३४,६२९ | |||
| स्वास्थ्य बजेट (सबै स्रोत) | ५१,५१२,००० | ६३,६७५,००० | ५४,६७५,००० | |||
| सशर्त स्वास्थ्यमा छुट्याएको बजेट | ३७,३००,००० | ३९,९००,००० | ४५,२००,००० | |||
| समानीकरणबाट विनियोजित स्वास्थ्य बजेट | १३,६१२,००० | २३,४७५,००० | ८,९२५,००० | |||
| अन्य श्रोतबाट बिनियोजित स्वास्थ्य बजेट | ६००,००० | ३००,००० | ५५०,००० | |||
| बजेट खर्च (%) | ९५ | ८५ | - | |||
| तालिका | ||||||
महत्वपूर्ण सम्पर्क
Panchapuri Municipality
ठेगाना : पञ्चपुरी नगरपालिका
टेलिफोन : ०८३-४१६०६३
वेबसाइट : http://panchapurimun.gov.np
अस्पताल नर्शिङ निरिक्षक
नाम : कृस्टिना सापकोटा
सम्पर्क : ९८४८०५००२७
ईमेल : kristinasapkota123@gmail.com
जन स्वास्थ्य निरिक्षक
नाम : मनोहर उपाध्याय
सम्पर्क : ९८४८०४११६८

यो प्रोफाइल अमेरिकी अन्तर्राष्ट्रिय विकास नियोग (युएसएआइडी) मार्फत अमेरिकी जनताहरुको सहयोगका कारण सम्भव बनेको हो । यो प्रतिवेदन भित्रका विषयवस्तु र सामग्री स्वास्थ्यका लागि सक्षम प्रणालीका एकल जिम्मेवारी हुन् र तिनले युएसएआइडी वा अमेरिकी सरकारको विचारको प्रतिविम्बित गर्छन् भन्ने जरुरी छैन ।