संक्षिप्त परिचय राजापुर नगरपालिका
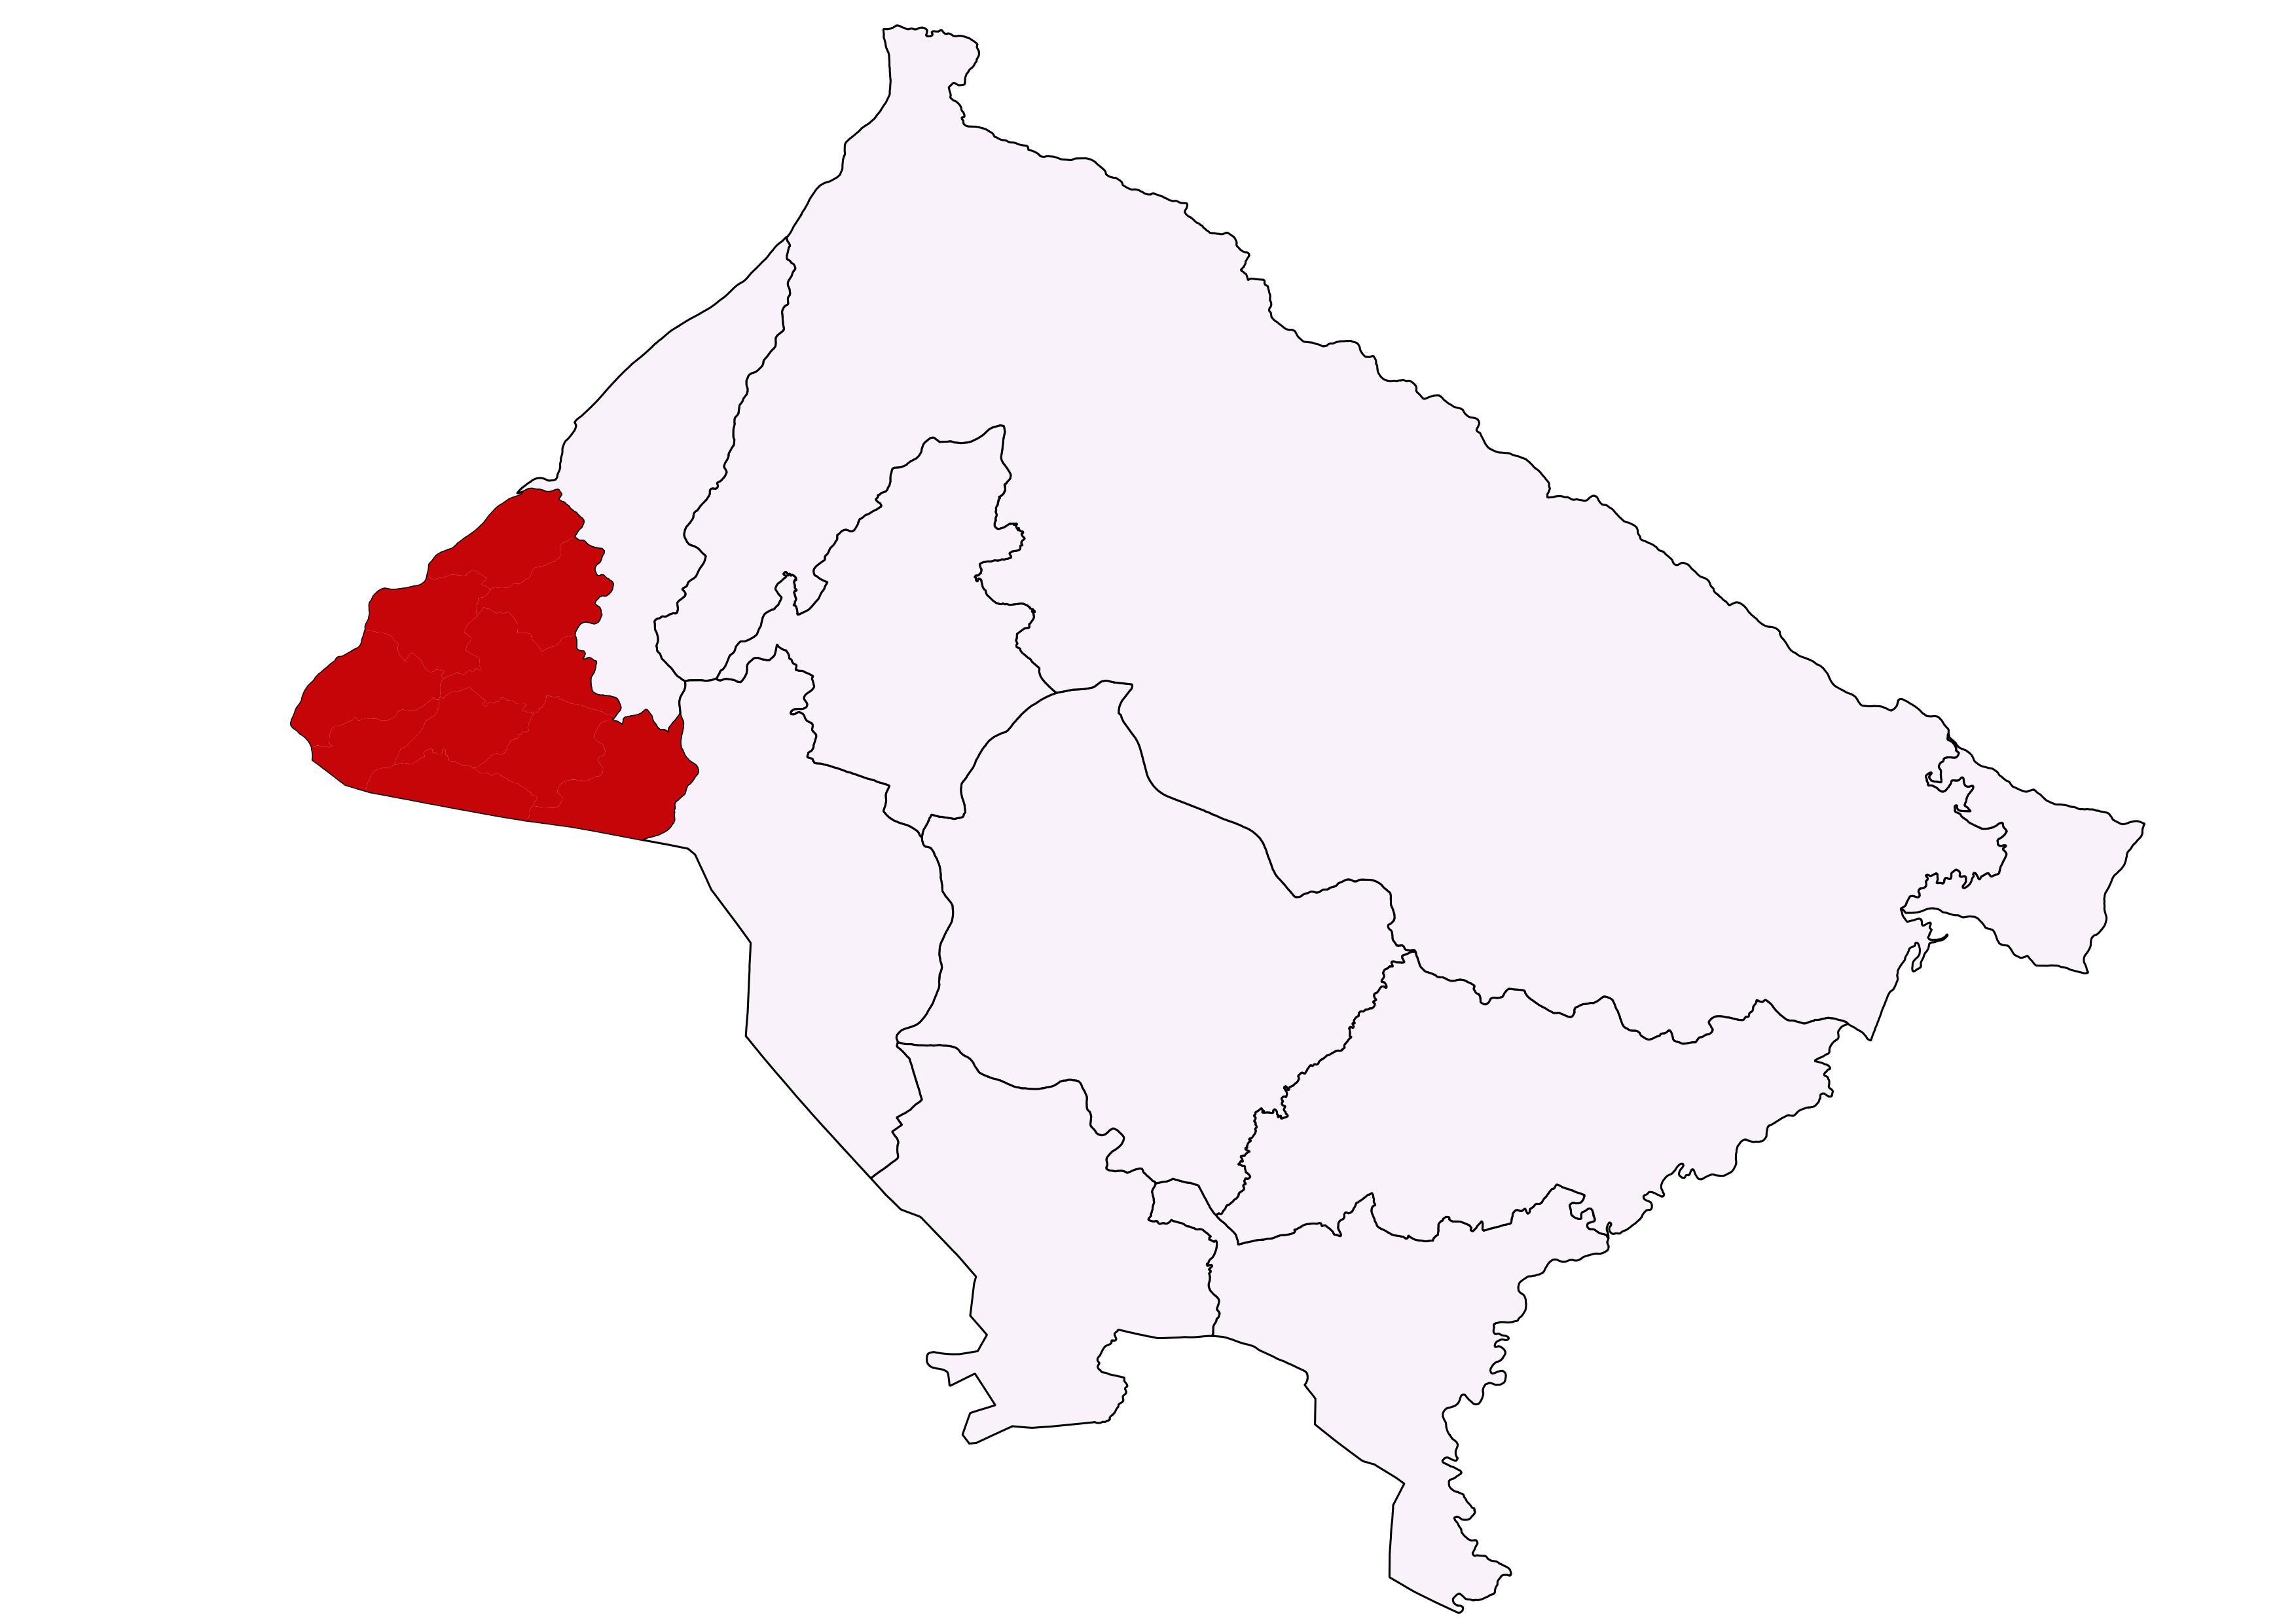
लुम्बिनी प्रदेश अन्तरगत बर्दिया जिल्लाकाे ८ वटा स्थानीय तह मध्ये जिल्ला सरदरमुकामबाट करिब ५० कि.मी काे दूरीमा राजापुर नगरपालीका अवस्थित रहेकाे छ । याे नगरपालीकाको स्थापना वि. स. २०७१।०१। २५ गते भएको हो । साबिकका दौलतपुर, बदालपुर, नयाँगाउँ, राजापुर, भिम्मापुर र मानपुर टपरा गाविसलाई समायोजन गरी राजापुर नगरपालिका घोषाणा गरिएको थियो । त्यस पछि २०७३।११।२४ सालमा पुन : यस नगरपालिकामा खैरी चन्दनपुर गाविसलाई समेत समायोजन गरि यस नगरपालिकाको क्षेत्र बिस्तfर भएको हो। साबिक राजापुर नगरपालिकालाई १९ वटा वडामा विभाजन गरिएको थियो । भने २०७४ साल अाएर यस लाई १० वटा वडामा मात्र विभाजन गरिएको छ । यस नगरपालिकाको पुर्वि सिमामा मधुवन नगरपालिका, सुदुरपश्चिममा प्रदेश को सिमाना, उत्तरमा गेरुवा गाउँपालिकाको सिमाना र दक्षीणमा भारतको सिमाना छ ।
जनसाङ्खिक सूचक
-
कूल जनसंख्या १
६२,५३३
-
१ बर्ष भन्दा मुनिको जनसंख्या १
९४७
-
पाँच बर्ष भन्दा मुनिको जनसंख्या १
४,८०३
-
किशोरावस्था (१०-१९ बर्ष) को जनसंख्या १
९,७०१
-
प्रजनन उमेरका महिला (१५ -४९ बर्ष ) १
१८,९८४
-
अनुमानित गर्भवती महिलाहरु १
१,२२०
-
अनुमानित जिवित जन्मको संख्या १
९५३
-
परिवारमा अनुपस्थित (विदेशमा बस्ने) जनसंख्या २
२,५३०
-
मोबाइल फोन भएका घरधुरी (%) २
६२
-
टेलिभिजन भएका घरधुरी (%) २
२८
-
लैङ्गिक अनुपात २
९४
-
१४ बर्ष र सो भन्दा कम उमेरका जनसंख्या १
१४,६६९
-
६५ बर्ष र सो भन्दा माथि उमेरका जनसंख्या २
२,५३८
उमेर र लिंगको आधारमा जनसंख्या वितरण
जनगणना २०६८जातिगत आधारमा जनसंख्या वितरण
जनगणना २०६८वार्ड अनुसार जनसंख्या वितरण
जनगणना २०६८स्वास्थ्य सेवा प्रवाह गर्ने संस्थाहरु

- अस्पताल -
- प्रास्वाके १
- स्वास्थ्य चौकी ६
- सामुदायिक स्वास्थ्य ईकाई -
- शहरी स्वास्थ्य केन्द्र १
- गाउँघर क्लिनिक ४३
- खोप क्लिनिक ४३
- आधारभूत स्वस्थ सेवाकेन्द्र ३
- बर्थिंग सेन्टर ७
सरकारी संस्था
- अस्पताल तथा नर्सिंग होम -
- पोलिक्लिनिक ३
- औषधि पसल २२
निजी (गैर-सरकारी संस्था समेत)
अन्य स्वास्थ्य केन्द्रहरु
- माइक्रोस्कोपी केन्द्र ४
- एआरटि केन्द्र १
- एचाईभी परीक्षण केन्द्र १
- क्षयरोग उपचार केन्द्र ७
- आयुर्वेद अस्पताल/केन्द्र १
- आँखा अस्पताल/केन्द्र १
अस्पताल शैयाहरू
- सार्वजनिक -
- निजी -
वडा अनुसार स्वास्थ्य संस्थाको जानकारी
| स्वास्थ्यसंस्थाको नाम | वार्ड न | बर्थिंग सेन्टर BEONC/CEONC | महिला स्वास्थ्य स्वयं सेवक संख्या | दक्ष प्रसुतिकर्मी संख्या | परिवार नियोजन *सेवा | स्वीकृत दरबन्दी | दरबन्दी अनुसार पदपूर्ति | करारका कर्मचारी |
|---|---|---|---|---|---|---|---|---|
| राजापुर प्रा.स्वा.के | ४ | प्रसुती केन्द्र | १६ | ३ | ५ साधनहरू | १० | १० | ८ |
| दैालतपुर स्वा चैा | १ | प्रसुती केन्द्र | १३ | २ | ४ साधनहरू | ६ | ६ | ३ |
| बदालपुर स्वा चैा | ५ | प्रसुती केन्द्र | १५ | २ | ३ साधनहरू | ६ | ६ | ३ |
| नयाँगाँउ स्वा चैा | २ | प्रसुती केन्द्र | १४ | ३ | ५ साधनहरू | ६ | ६ | ४ |
| मानपुर टपारा स्वा चैा | ६ | प्रसुती केन्द्र | १२ | १ | ५ साधनहरू | ६ | ६ | ३ |
| खैरीचन्दनपुर स्वा चैा | १० | प्रसुती केन्द्र | १५ | २ | ५ साधनहरू | ६ | ५ | ४ |
| भिम्मापुर स्वा चैा | ९ | प्रसुती केन्द्र | ११ | २ | ५ साधनहरू | ६ | ५ | ३ |
| अाधारभूत स्वा. सेवा केन्द्र | ७ | - | १० | ० | ३ साधनहरू | ० | ० | २ |
| अाधारभूत स्वा. सेवा केन्द्र | ८ | - | १४ | ० | ३ साधनहरू | ० | ० | २ |
| अाधारभूत स्वा. सेवा केन्द्र | ३ | - | १३ | ० | ३ साधनहरू | ० | ० | २ |
| शहरी स्वास्थ्य केन्द्र | ५ | - | ० | ० | ३ साधनहरू | ० | ० | २ |
| कुल कर्मचारी संख्या | १३३ | १५ | ४६ | ४४ | ३६ | |||
स्वास्थ्य सेवाको लागि मानव संसाधन
- CEONC साइटहरू-
- BEONC साइटहरू१
- आइयुसीडी तथा इम्पलान्ट सेवा प्रदायक५
- एकीकृत बालरोग व्यवस्थापन (IMCI) प्रशिक्षित कर्मचारी२९
- जनसंख्या (प्रति मस्वास्वका) ४७०
- जनसंख्या (प्रति स्वास्थ्यकर्मी) १४२१
- अनुमानित गर्भवति (प्रति दक्ष प्रसुतिकर्मी) ८१
- अनुमानित गर्भवति (प्रति बर्थिङ्ग सेन्टर) १७४
- जनसंख्या (प्रति स्वास्थ्य संस्था) (अस्पताल,प्रस्वाके र स्वाचौ सहित) ८९३३
- जनसंख्या (प्रति सरकारी अस्पताल) -
- जनसंख्या (प्रति अस्पताल र नर्सिंग होम (सबै) -
मातृशिशु बालस्वास्थ्य र परिवार नियोजन सेवा उपयोगको अवस्था
स्वास्थ्य सूचना व्यवस्थापन प्रणाली २०७८७९प्रमूख स्वास्थ्य सेवाहरूको उपयोगको तुलनात्मक अवस्था
| सूचक | राजापुर नगरपालिका | लुम्बिनी प्रदेश २०७८/७९ | राष्ट्रीय २०७८/७९ | |||
|---|---|---|---|---|---|---|
| २०७६/७७ | २०७७/७८ | २०७८/७९ | ||||
| खाेप |
ग्राफ
तालिका
|
|||||
| बि.सि.जि. कभरेज | ६२.२ | ६५.२ | ७२.५ | १०३.१ | १०३.५ | |
| २३ महिनाभित्र पूर्ण खोप प्राप्त गरेका बालबालिका (%) | ० | ० | ० | ० | ० | |
| डि.पि.टि. - हेप बि - हिव ३ कभरेज | ६०.८ | ७६.२ | ८८.६ | ९६.६ | ९५.२ | |
| दादुरा रूबेला १ (९-११ महिना) कभरेज | ६९.९ | ६८.४ | ९७.२ | ९६.७ | ९४.७ | |
| जे.इ कभरेज | ८० | ८५.४ | १०४.२ | ९८.९ | ९५.९ | |
| टि.डी. २ र टि. डी. २+ कभरेज | ५५.४ | ५२.५ | ६६.८ | ७३.९ | ७१.७ | |
| पोषण |
ग्राफ
तालिका
|
|||||
| कम जन्म तौल भएका नवजात शिशुको प्रतिशत | ४.७ | ५.६ | ६.४ | १२ | ९.४ | |
| नयाँ तौल लिएका १ वर्ष मुनिका शिशुहरुको प्रतिशत | ४९.४ | ८७.७ | ८१.२ | १०९ | १०४.१ | |
| नयाँ तौल लिएका २ वर्ष मुनिका शिशुहरु मध्ये अति जोखिम अवस्थाका बालबालिकाहरुको प्रतिशत | ६.८ | ४.६ | ४.३ | ३.५ | ३.६ | |
| गर्भवती अवस्थामा १८० दिन आइरन चक्की प्राप्त गरेका गर्भवती महिलाहरुको प्रतिशत | ५२ | ५२.७ | ६६.५ | ७५.८ | ६० | |
| सुत्केरी अवस्थामा भिटामिन ए प्राप्त गरेका महिलाहरुको प्रतिशत | ४६.५ | ४५.२ | १०० | ९८.२ | ७६.३ | |
| नवजात शिशु तथा बाल रोगको एकीकृत व्यस्थापन |
ग्राफ
तालिका
|
|||||
| नाभी मलम लगाएका नवजात शिशुको प्रतिशत | ९७.२ | ९८.१ | १०० | ९४.२ | ८२.९ | |
| ब्याक्टेरियाको गम्भीर संक्रमण भएकामध्ये जेन्टामाईसिन सुईद्वारा पूर्ण उपचार पाएको प्रतिशत | ९०.९ | १०० | १०० | ३९.५ | ४७.४ | |
| नयाँ निमोनिया बिरामीको दर (प्रति हजार पाँच वर्षमुनिका बालबालिकाहरुमा) | ४९ | ४०.४ | ६१.७ | २९.३ | ३६.८ | |
| नयाँ एआरआई (स्वाशप्रश्वाका) बिरामी मध्ये कडा निमोनिया भएका बिरामीको प्रतिशत | ० | ० | ० | ०.०५ | ०.१८ | |
| नयाँ झाडापखालाका बिरामीको दर (प्रति हजार पाँच वर्ष मुनिका बालबालिकाहरुमा) | २९५ | २९४.६ | २१५.५ | ३३९ | ३५२.४ | |
| ५ वर्ष मुनिका झाडापखालाका बिरामी मध्ये जिंक र पुनर्जलीय झोलबाट उपचार गरेको प्रतिशत | ९७.३ | ९५.८ | ९२.५ | ९८.७ | ९४.५ | |
| जम्मा नवजात शिशु मृत्यु संख्या | ५ | ९ | ० | ५७३ | १९१४ | |
| सुरक्षित मातृत्व तथा परिवार नियोजन |
ग्राफ
तालिका
|
|||||
| प्परोटोकल अनुसार पहिलो पटक गर्भवती जाँच गराएका गर्भवती महिलाहरुको प्रतिशत | ६७.७ | ५६.४ | ८४.२ | ९३.५ | ९१.४ | |
| प्रजनन् उमेरका महिलाहरुमा परिवार नियोजनको प्रयोगकर्ता दर (आधुनिक साधन) | ० | ० | ० | ० | ० | |
| ४ पटक गर्भवती जाँच (महिना: ४,६,८,९/हप्ता: १६, २०-२४,३२ र ३६) महिलाहरुको प्रतिशत | ५२.६ | ५२.७ | ६६.३ | ७९.७ | ७९.४ | |
| स्वास्थ्य संस्था प्रसुति दर | ४६.३ | ४५.१ | ४४.५ | ९४.२ | ७९ | |
| दक्ष प्रसुतिकर्मी/स्वास्थ्यकर्मीद्वारा प्रसुति गराएको प्रतिशत | ४०.३ | ३६.२ | ३६.९ | ८९.८ | ७५ | |
| प्रोटोकल अनुसार ४ पटक (आ.व २०७८/७९ सम्म ३ पटक) सुत्केरी जाँच गराउने आमाहरुको प्रतिशत | ३९ | ३९.२ | ४२.६ | ५३.७ | ४०.८ | |
| जम्मा मातृ मृत्यु संख्या | १ | २ | १ | ७४ | २३१ | |
| परिवार नियोजन सेवाका नयाँ सेवाग्राही दर (प्रजनन उमेरका महिलाहरु मध्ये) | १८.१ | १२.५ | १४.४ | १२.४ | ११.५ | |
| औलो रोग, क्षय रोग, कुष्ठरोग र एचआईभी |
ग्राफ
तालिका
|
|||||
| औलोको स्लाइड नमुना पोजेटिभ दर | ० | ०.१६ | ० | ०.२७ | ०.१७ | |
| डेंगुको जम्मा विरामी संख्या | ० | ० | ० | ० | ० | |
| आयातित औलोरोगको प्रतिशत (नयाँ औलो रोग मध्ये | ० | १०० | ० | ९५.५ | ८९.५ | |
| जम्मा औलो रोग मध्ये प्लाज्मोडियम फाल्सिपारमको अनुपात | ० | १०० | ० | ३८.७ | २२.८ | |
| नयाँ क्षयरोगी बिरामी पत्ता लागेको दर | ९०.५ | ८०.६ | १४२.८ | १५७.४ | १२९.१ | |
| क्षयरोगको उपचार सफलता दर | ८७ | ८५ | ८८.५ | ९१ | ९१.५ | |
| कुष्ठरोगको रोग प्रकोप दर (प्रति १०००० मा) | ०.७४ | ०.३ | १.३ | ०.९ | ० | |
| ए. आर. टी. उपचारमा रहेका जम्मा एच. आइ. भी. पोजेटिभको संख्या | २२ | ० | ० | ४३२६ | २२१५२ | |
| उपचारात्मक सेवा |
ग्राफ
तालिका
|
|||||
| ओ पि डी मा आएका बिरामी मध्ये नयाँ बिरामीको दर | ९१.७ | ८५.१ | ९७.५ | ९४.५ | ९२ | |
शीर्ष १० स्वास्थ्य अवस्थाको सूची
स्वास्थ्य सूचना व्यवस्थापन प्रणाली २०७८७९स्वास्थ्य क्षेत्रमा बजेट
- सशर्त स्वास्थ्यमा छुट्याएको बजेट
- समानीकरणबाट विनियोजित स्वास्थ्य बजेट
- अन्य श्रोतबाट बिनियोजित स्वास्थ्य बजेट
| बजेट | राजापुर नगरपालिका | |||||
|---|---|---|---|---|---|---|
| २०७७/७८ | २०७८/७९ | २०७९/८० | ||||
| ग्राफ | ||||||
| पालिकाको कुल बजेट (रु ) | ८०४,६९९,४२० | ९०२,९०८,००० | १,०३७,४५३,००० | |||
| स्वास्थ्य बजेट (सबै स्रोत) | ४६,८००,००० | ५१,६८०,००० | ६५,२५०,००० | |||
| सशर्त स्वास्थ्यमा छुट्याएको बजेट | ४२,८००,००० | ४३,३८०,००० | ४८,५००,००० | |||
| समानीकरणबाट विनियोजित स्वास्थ्य बजेट | ४,०००,००० | ८,३००,००० | १६,७५०,००० | |||
| अन्य श्रोतबाट बिनियोजित स्वास्थ्य बजेट | - | - | ||||
| बजेट खर्च (%) | ९५ | ९२ | - | |||
| तालिका | ||||||
महत्वपूर्ण सम्पर्क
Rajapur Municipality
ठेगाना : राजापुर नगरपालीका : नगरपालिका राेड राजापुर बजार
टेलिफोन : -,-,
वेबसाइट : http://www.rajapurmun.gov.np

यो प्रोफाइल अमेरिकी अन्तर्राष्ट्रिय विकास नियोग (युएसएआइडी) मार्फत अमेरिकी जनताहरुको सहयोगका कारण सम्भव बनेको हो । यो प्रतिवेदन भित्रका विषयवस्तु र सामग्री स्वास्थ्यका लागि सक्षम प्रणालीका एकल जिम्मेवारी हुन् र तिनले युएसएआइडी वा अमेरिकी सरकारको विचारको प्रतिविम्बित गर्छन् भन्ने जरुरी छैन ।