संक्षिप्त परिचय राप्ती गाउँपालिका
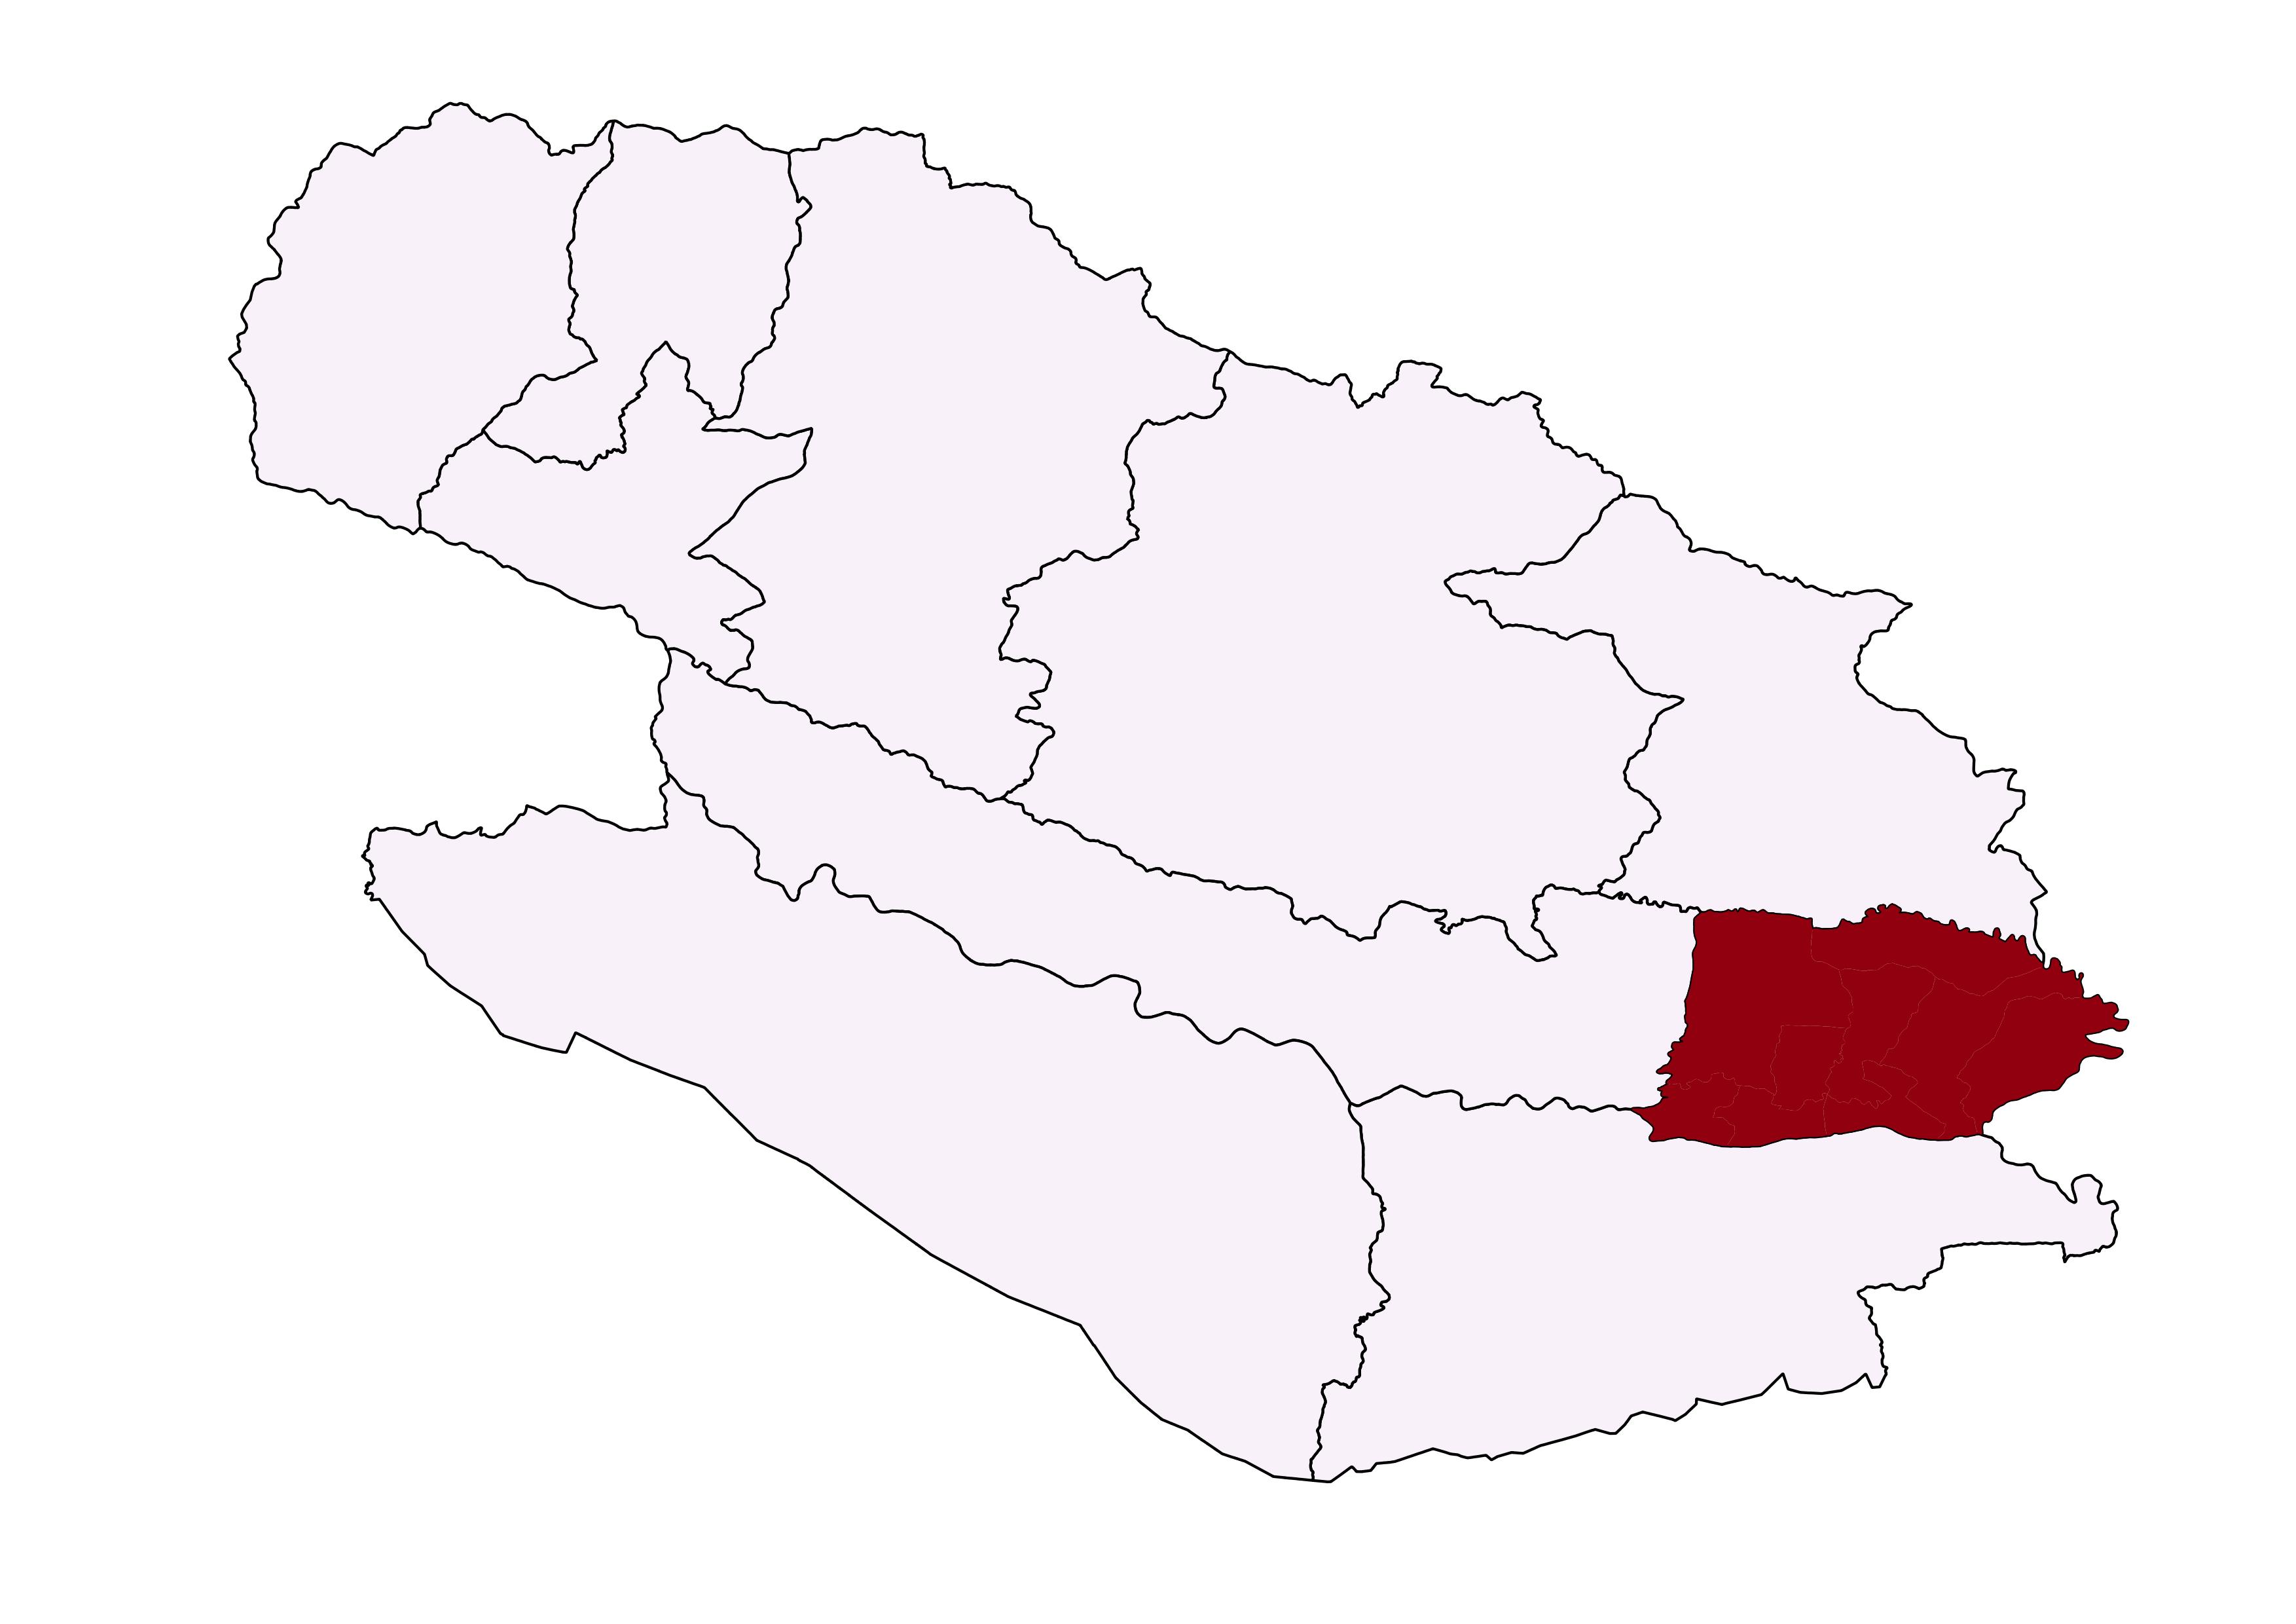
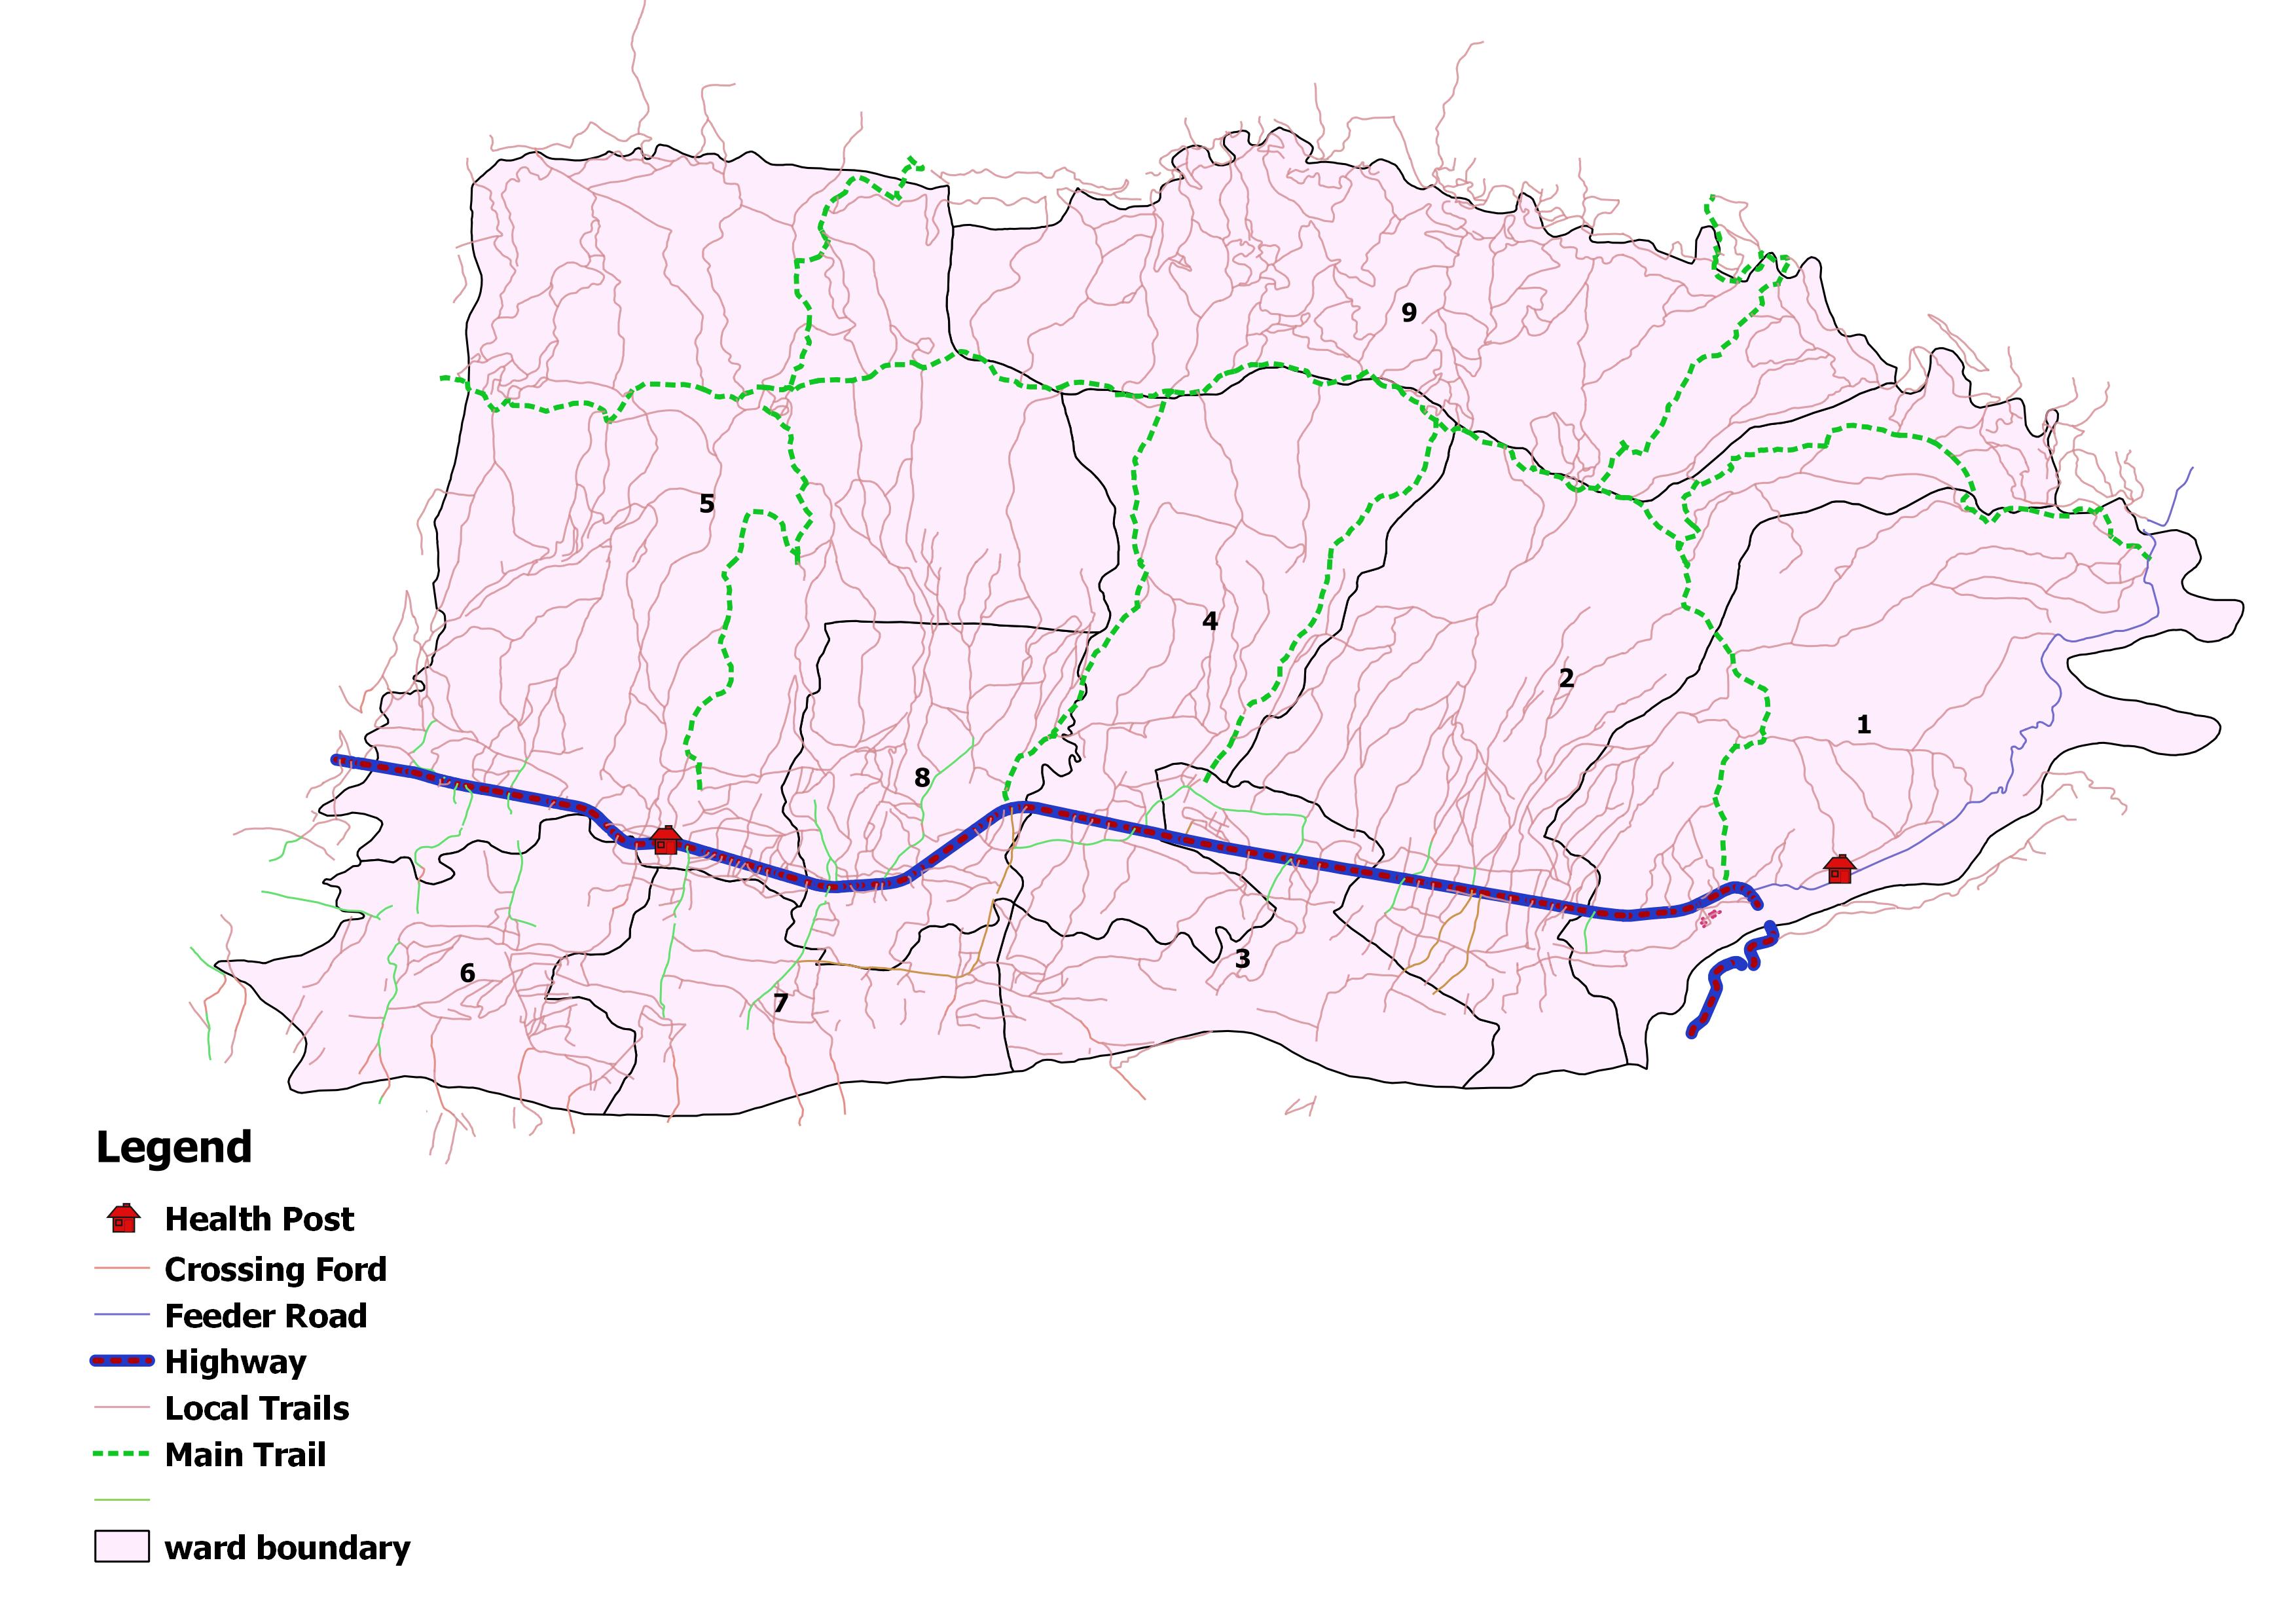
लुम्विनी प्रदेश, राप्ती गाउँपालिका अन्तरगत साविकको सिसहनिया गा.वि.स.,लालमटिया गा.वि.स.र हाँसिपुर गा.वि.स.को वडा नं. १ र २ पर्दछ । यस राप्ती गाउँपालिकाको उत्तर तर्फ घोसखोला, पुर्व र दक्षिण तर्फ राप्ती नदी र पश्चिम तर्फ लमही न.पा.पर्दछ । यस गाउँपालिकाको कुल जनसंख्या जनगणना २०७८ अनुसार ५२,१५८ छ । जम्मा ९ वटा वडाहरु रहेको यस गाउँपालिकाको वडा नं. १,२ र ५ को केही भाग र वडा नं. ९ को पुरै पहाडी क्षेत्र पर्दछ । देविकोट मन्दिर,खड्गेश्वरी मन्दिर,खौरा बाबा जस्ता धार्मिक तथा पर्यटकीय क्षेत्रहरु रहेको यस गाउँपालिकाको बिचबाट करिव १६ किलोमिटर पुर्व पश्चिम राजमार्ग पर्दछ । यस गाउँपालिकामा पर्ने समथर भु–भाग अत्यन्तै उर्वर र सिंचाईको सुविधा समेत भएकोले कृषि खेती तथा तरकारी वालीको लागि राम्रो संभावना देखिन्छ । थारु जातिको बाहुल्य रहेको यस गाउँपालिकामा ब्रामण,क्षेत्री,ठकुरी,गिरी ,गुरुङ,मगर र दलितहरु पनि रहेका छन ।
जनसाङ्खिक सूचक
-
कूल जनसंख्या १
५४,०२७
-
१ बर्ष भन्दा मुनिको जनसंख्या १
८६५
-
पाँच बर्ष भन्दा मुनिको जनसंख्या १
४,१२८
-
किशोरावस्था (१०-१९ बर्ष) को जनसंख्या १
१०,५९५
-
प्रजनन उमेरका महिला (१५ -४९ बर्ष ) १
१६,५१३
-
अनुमानित गर्भवती महिलाहरु १
१,०४०
-
अनुमानित जिवित जन्मको संख्या १
८७४
-
मोबाइल फोन भएका घरधुरी (%) २
७२
-
टेलिभिजन भएका घरधुरी (%) २
२२
-
लैङ्गिक अनुपात २
९१
२०७८ -
१४ बर्ष र सो भन्दा कम उमेरका जनसंख्या १
१३,९२२
-
६५ बर्ष र सो भन्दा माथि उमेरका जनसंख्या २
३,२००
२०७८
उमेर र लिंगको आधारमा जनसंख्या वितरण
जनगणना २०७८जातिगत आधारमा जनसंख्या वितरण
जनगणना २०७८वार्ड अनुसार जनसंख्या वितरण
जनगणना २०७८स्वास्थ्य सेवा प्रवाह गर्ने संस्थाहरु
- अस्पताल १
- प्रास्वाके -
- स्वास्थ्य चौकी १
- सामुदायिक स्वास्थ्य ईकाई ७
- शहरी स्वास्थ्य केन्द्र -
- गाउँघर क्लिनिक १९
- खोप क्लिनिक २०
- आधारभूत स्वस्थ सेवाकेन्द्र ४
- बर्थिंग सेन्टर २
सरकारी संस्था
- अस्पताल तथा नर्सिंग होम -
- पोलिक्लिनिक ४
- औषधि पसल ३४
निजी (गैर-सरकारी संस्था समेत)
अन्य स्वास्थ्य केन्द्रहरु
- माइक्रोस्कोपी केन्द्र २
- एआरटि केन्द्र -
- एचाईभी परीक्षण केन्द्र -
- क्षयरोग उपचार केन्द्र २
- आयुर्वेद अस्पताल/केन्द्र १
- आँखा अस्पताल/केन्द्र १
अस्पताल शैयाहरू
- सार्वजनिक १५
- निजी -
वडा अनुसार स्वास्थ्य संस्थाको जानकारी
| स्वास्थ्यसंस्थाको नाम | वार्ड न | बर्थिंग सेन्टर BEONC/CEONC | महिला स्वास्थ्य स्वयं सेवक संख्या | दक्ष प्रसुतिकर्मी संख्या | परिवार नियोजन *सेवा | स्वीकृत दरबन्दी | दरबन्दी अनुसार पदपूर्ति | करारका कर्मचारी |
|---|---|---|---|---|---|---|---|---|
| राप्ती आधारभुत अस्पताल | ५ | प्रसुती केन्द्र | १० | ३ | ५ साधनहरू | ६ | ६ | - |
| लालमटिया | १ | प्रसुती केन्द्र | ४ | ३ | ५ साधनहरू | ७ | ७ | - |
| मौरिघाट सामुदायिक स्वास्थ्य ईकाई | ४ | - | ९ | १ | ५ साधनहरू | ० | ० | २ |
| पथरगढवा सामुदायिक स्वास्थ्य ईकाई | ६ | - | ८ | ० | ३ साधनहरू | ० | ० | ३ |
| देविकोट सामुदायिक स्वास्थ्य ईकाई | ९ | - | २ | ० | ३ साधनहरू | ० | ० | ३ |
| लालमटिया आधारभुत स्वास्थ्य सेवा केन्द्र | २ | - | ८ | ० | ३ साधनहरू | ० | २ | १ |
| खुरुरिया आधारभुत स्वास्थ्य सेवा केन्द्र | ३ | - | ९ | ० | ३ साधनहरू | ० | ० | ३ |
| ८ | - | ७ | ० | ३ साधनहरू | ० | ० | ३ | |
| ७ | - | ७ | ० | ३ साधनहरू | ० | ० | ३ | |
| २ | - | - | - | ३ साधनहरू | - | - | २ | |
| ३ | - | - | - | ४ साधनहरू | - | - | २ | |
| ५ | - | - | - | ३ साधनहरू | - | - | २ | |
| ९ | - | - | - | ३ साधनहरू | - | - | २ | |
| कुल कर्मचारी संख्या | ६४ | ७ | १३ | १५ | २६ | |||
स्वास्थ्य सेवाको लागि मानव संसाधन
- CEONC साइटहरू-
- BEONC साइटहरू-
- आइयुसीडी तथा इम्पलान्ट सेवा प्रदायक१०
- एकीकृत बालरोग व्यवस्थापन (IMCI) प्रशिक्षित कर्मचारी१५
- जनसंख्या (प्रति मस्वास्वका) ८४४
- जनसंख्या (प्रति स्वास्थ्यकर्मी) ३६०२
- अनुमानित गर्भवति (प्रति दक्ष प्रसुतिकर्मी) १४९
- अनुमानित गर्भवति (प्रति बर्थिङ्ग सेन्टर) ५२०
- जनसंख्या (प्रति स्वास्थ्य संस्था) (अस्पताल,प्रस्वाके र स्वाचौ सहित) -
- जनसंख्या (प्रति सरकारी अस्पताल) ५४०२७
- जनसंख्या (प्रति अस्पताल र नर्सिंग होम (सबै) ५४०२७
मातृशिशु बालस्वास्थ्य र परिवार नियोजन सेवा उपयोगको अवस्था
स्वास्थ्य सूचना व्यवस्थापन प्रणाली २०७९प्रमूख स्वास्थ्य सेवाहरूको उपयोगको तुलनात्मक अवस्था
| सूचक | राप्ती गाउँपालिका | लुम्बिनी प्रदेश २०७८/७९ | राष्ट्रीय २०७८/७९ | |||
|---|---|---|---|---|---|---|
| २०७६/७७ | २०७७/७८ | २०७८/७९ | ||||
| खाेप |
ग्राफ
तालिका
|
|||||
| बि.सि.जि. कभरेज | ८६.७ | ८२.६ | ९१.६ | १०३.१ | १०३.५ | |
| २३ महिनाभित्र पूर्ण खोप प्राप्त गरेका बालबालिका (%) | ० | ० | ० | ० | ० | |
| डि.पि.टि. - हेप बि - हिव ३ कभरेज | ८२,८ | ८७.७ | १०२.८ | ९६.६ | ९५.२ | |
| दादुरा रूबेला १ (९-११ महिना) कभरेज | ८४.२ | ८४.६ | १०१.५ | ९६.७ | ९४.७ | |
| जे.इ कभरेज | १००.५ | १०७.१ | १११.९ | ९८.९ | ९५.९ | |
| टि.डी. २ र टि. डी. २+ कभरेज | ६४.५ | ५५.९ | ६८.८ | ७३.९ | ७१.७ | |
| पोषण |
ग्राफ
तालिका
|
|||||
| कम जन्म तौल भएका नवजात शिशुको प्रतिशत | ३.८ | ४.३ | ६.७ | १२ | ९.४ | |
| नयाँ तौल लिएका १ वर्ष मुनिका शिशुहरुको प्रतिशत | ७७.२ | ८७.८ | २१०.८ | १०९ | १०४.१ | |
| नयाँ तौल लिएका २ वर्ष मुनिका शिशुहरु मध्ये अति जोखिम अवस्थाका बालबालिकाहरुको प्रतिशत | २.६ | १.९ | १.४ | ३.५ | ३.६ | |
| गर्भवती अवस्थामा १८० दिन आइरन चक्की प्राप्त गरेका गर्भवती महिलाहरुको प्रतिशत | ६५.१ | ६८.८ | ८६.७ | ७५.८ | ६० | |
| सुत्केरी अवस्थामा भिटामिन ए प्राप्त गरेका महिलाहरुको प्रतिशत | ६३.८ | ६१.४ | ७१.७ | ९८.२ | ७६.३ | |
| नवजात शिशु तथा बाल रोगको एकीकृत व्यस्थापन |
ग्राफ
तालिका
|
|||||
| नाभी मलम लगाएका नवजात शिशुको प्रतिशत | ९४.७ | ९४.९ | ९७.८ | ९४.२ | ८२.९ | |
| ब्याक्टेरियाको गम्भीर संक्रमण भएकामध्ये जेन्टामाईसिन सुईद्वारा पूर्ण उपचार पाएको प्रतिशत | २५ | १८.२ | २४.९३ | ३९.५ | ४७.४ | |
| नयाँ निमोनिया बिरामीको दर (प्रति हजार पाँच वर्षमुनिका बालबालिकाहरुमा) | ६७.४ | १६.२ | ३०.६ | २९.३ | ३६.८ | |
| नयाँ एआरआई (स्वाशप्रश्वाका) बिरामी मध्ये कडा निमोनिया भएका बिरामीको प्रतिशत | ० | ० | ० | ०.०५ | ०.१८ | |
| नयाँ झाडापखालाका बिरामीको दर (प्रति हजार पाँच वर्ष मुनिका बालबालिकाहरुमा) | ४२४.९ | ४५२.९ | ४७९ | ३३९ | ३५२.४ | |
| ५ वर्ष मुनिका झाडापखालाका बिरामी मध्ये जिंक र पुनर्जलीय झोलबाट उपचार गरेको प्रतिशत | १०१ | १०२.६ | १०१.७ | ९८.७ | ९४.५ | |
| जम्मा नवजात शिशु मृत्यु संख्या | ० | ० | ० | ५७३ | १९१४ | |
| सुरक्षित मातृत्व तथा परिवार नियोजन |
ग्राफ
तालिका
|
|||||
| प्परोटोकल अनुसार पहिलो पटक गर्भवती जाँच गराएका गर्भवती महिलाहरुको प्रतिशत | ९९ | ९९.२ | १२० | ९३.५ | ९१.४ | |
| प्रजनन् उमेरका महिलाहरुमा परिवार नियोजनको प्रयोगकर्ता दर (आधुनिक साधन) | ० | ० | ० | ० | ० | |
| ४ पटक गर्भवती जाँच (महिना: ४,६,८,९/हप्ता: १६, २०-२४,३२ र ३६) महिलाहरुको प्रतिशत | ६५.५ | ६८.८ | ८६.५ | ७९.७ | ७९.४ | |
| स्वास्थ्य संस्था प्रसुति दर | ५९.३ | ६० | ७०.१ | ९४.२ | ७९ | |
| दक्ष प्रसुतिकर्मी/स्वास्थ्यकर्मीद्वारा प्रसुति गराएको प्रतिशत | ५९.३ | ६० | ७०.१ | ८९.८ | ७५ | |
| प्रोटोकल अनुसार ४ पटक (आ.व २०७८/७९ सम्म ३ पटक) सुत्केरी जाँच गराउने आमाहरुको प्रतिशत | ३६.३ | ५३ | ७५.४ | ५३.७ | ४०.८ | |
| जम्मा मातृ मृत्यु संख्या | ० | ० | ० | ७४ | २३१ | |
| परिवार नियोजन सेवाका नयाँ सेवाग्राही दर (प्रजनन उमेरका महिलाहरु मध्ये) | १९.३ | २२.४ | ३१ | १२.४ | ११.५ | |
| औलो रोग, क्षय रोग, कुष्ठरोग र एचआईभी |
ग्राफ
तालिका
|
|||||
| औलोको स्लाइड नमुना पोजेटिभ दर | ० | ० | ० | ०.२७ | ०.१७ | |
| डेंगुको जम्मा विरामी संख्या | ० | ० | ० | ० | ० | |
| आयातित औलोरोगको प्रतिशत (नयाँ औलो रोग मध्ये | ० | ० | ० | ९५.५ | ८९.५ | |
| जम्मा औलो रोग मध्ये प्लाज्मोडियम फाल्सिपारमको अनुपात | ० | ० | ० | ३८.७ | २२.८ | |
| नयाँ क्षयरोगी बिरामी पत्ता लागेको दर | १२३.३ | १७२.५ | १९५ | १५७.४ | १२९.१ | |
| क्षयरोगको उपचार सफलता दर | ८७.५ | ९३.२ | ९५.२ | ९१ | ९१.५ | |
| कुष्ठरोगको रोग प्रकोप दर (प्रति १०००० मा) | ०.४२ | ०.४१ | ०.७६ | ०.९ | ० | |
| ए. आर. टी. उपचारमा रहेका जम्मा एच. आइ. भी. पोजेटिभको संख्या | ० | ० | ० | ४३२६ | २२१५२ | |
| उपचारात्मक सेवा |
ग्राफ
तालिका
|
|||||
| ओ पि डी मा आएका बिरामी मध्ये नयाँ बिरामीको दर | ५३.१ | ६४.९ | ७८ | ९४.५ | ९२ | |
शीर्ष १० स्वास्थ्य अवस्थाको सूची
स्वास्थ्य सूचना व्यवस्थापन प्रणाली २०७८०७९स्वास्थ्य क्षेत्रमा बजेट
- सशर्त स्वास्थ्यमा छुट्याएको बजेट
- समानीकरणबाट विनियोजित स्वास्थ्य बजेट
- अन्य श्रोतबाट बिनियोजित स्वास्थ्य बजेट
| बजेट | राप्ती गाउँपालिका | |||||
|---|---|---|---|---|---|---|
| २०७७/७८ | २०७८/७९ | २०७९/८० | ||||
| ग्राफ | ||||||
| पालिकाको कुल बजेट (रु ) | ५५२,३१६,४९८ | ६०३,४१३,४८८ | ||||
| स्वास्थ्य बजेट (सबै स्रोत) | ३६,८००,००० | ४६,२००,००० | ||||
| सशर्त स्वास्थ्यमा छुट्याएको बजेट | २१,८००,००० | २०,२००,००० | ||||
| समानीकरणबाट विनियोजित स्वास्थ्य बजेट | १५,०००,००० | २६,०००,००० | ||||
| अन्य श्रोतबाट बिनियोजित स्वास्थ्य बजेट | ||||||
| बजेट खर्च (%) | ७७ | ७९ | ||||
| तालिका | ||||||
महत्वपूर्ण सम्पर्क
Rapti Rural Municipality
ठेगाना : राप्ती गाउँपालिका, लुम्बिनी प्रदेश, मसुरिया, दाङ
टेलिफोन : ०८२-४१३०७७
वेबसाइट : https://raptimundang.gov.np/

यो प्रोफाइल अमेरिकी अन्तर्राष्ट्रिय विकास नियोग (युएसएआइडी) मार्फत अमेरिकी जनताहरुको सहयोगका कारण सम्भव बनेको हो । यो प्रतिवेदन भित्रका विषयवस्तु र सामग्री स्वास्थ्यका लागि सक्षम प्रणालीका एकल जिम्मेवारी हुन् र तिनले युएसएआइडी वा अमेरिकी सरकारको विचारको प्रतिविम्बित गर्छन् भन्ने जरुरी छैन ।