संक्षिप्त परिचय राप्ती सोनारी गाउँपालिका
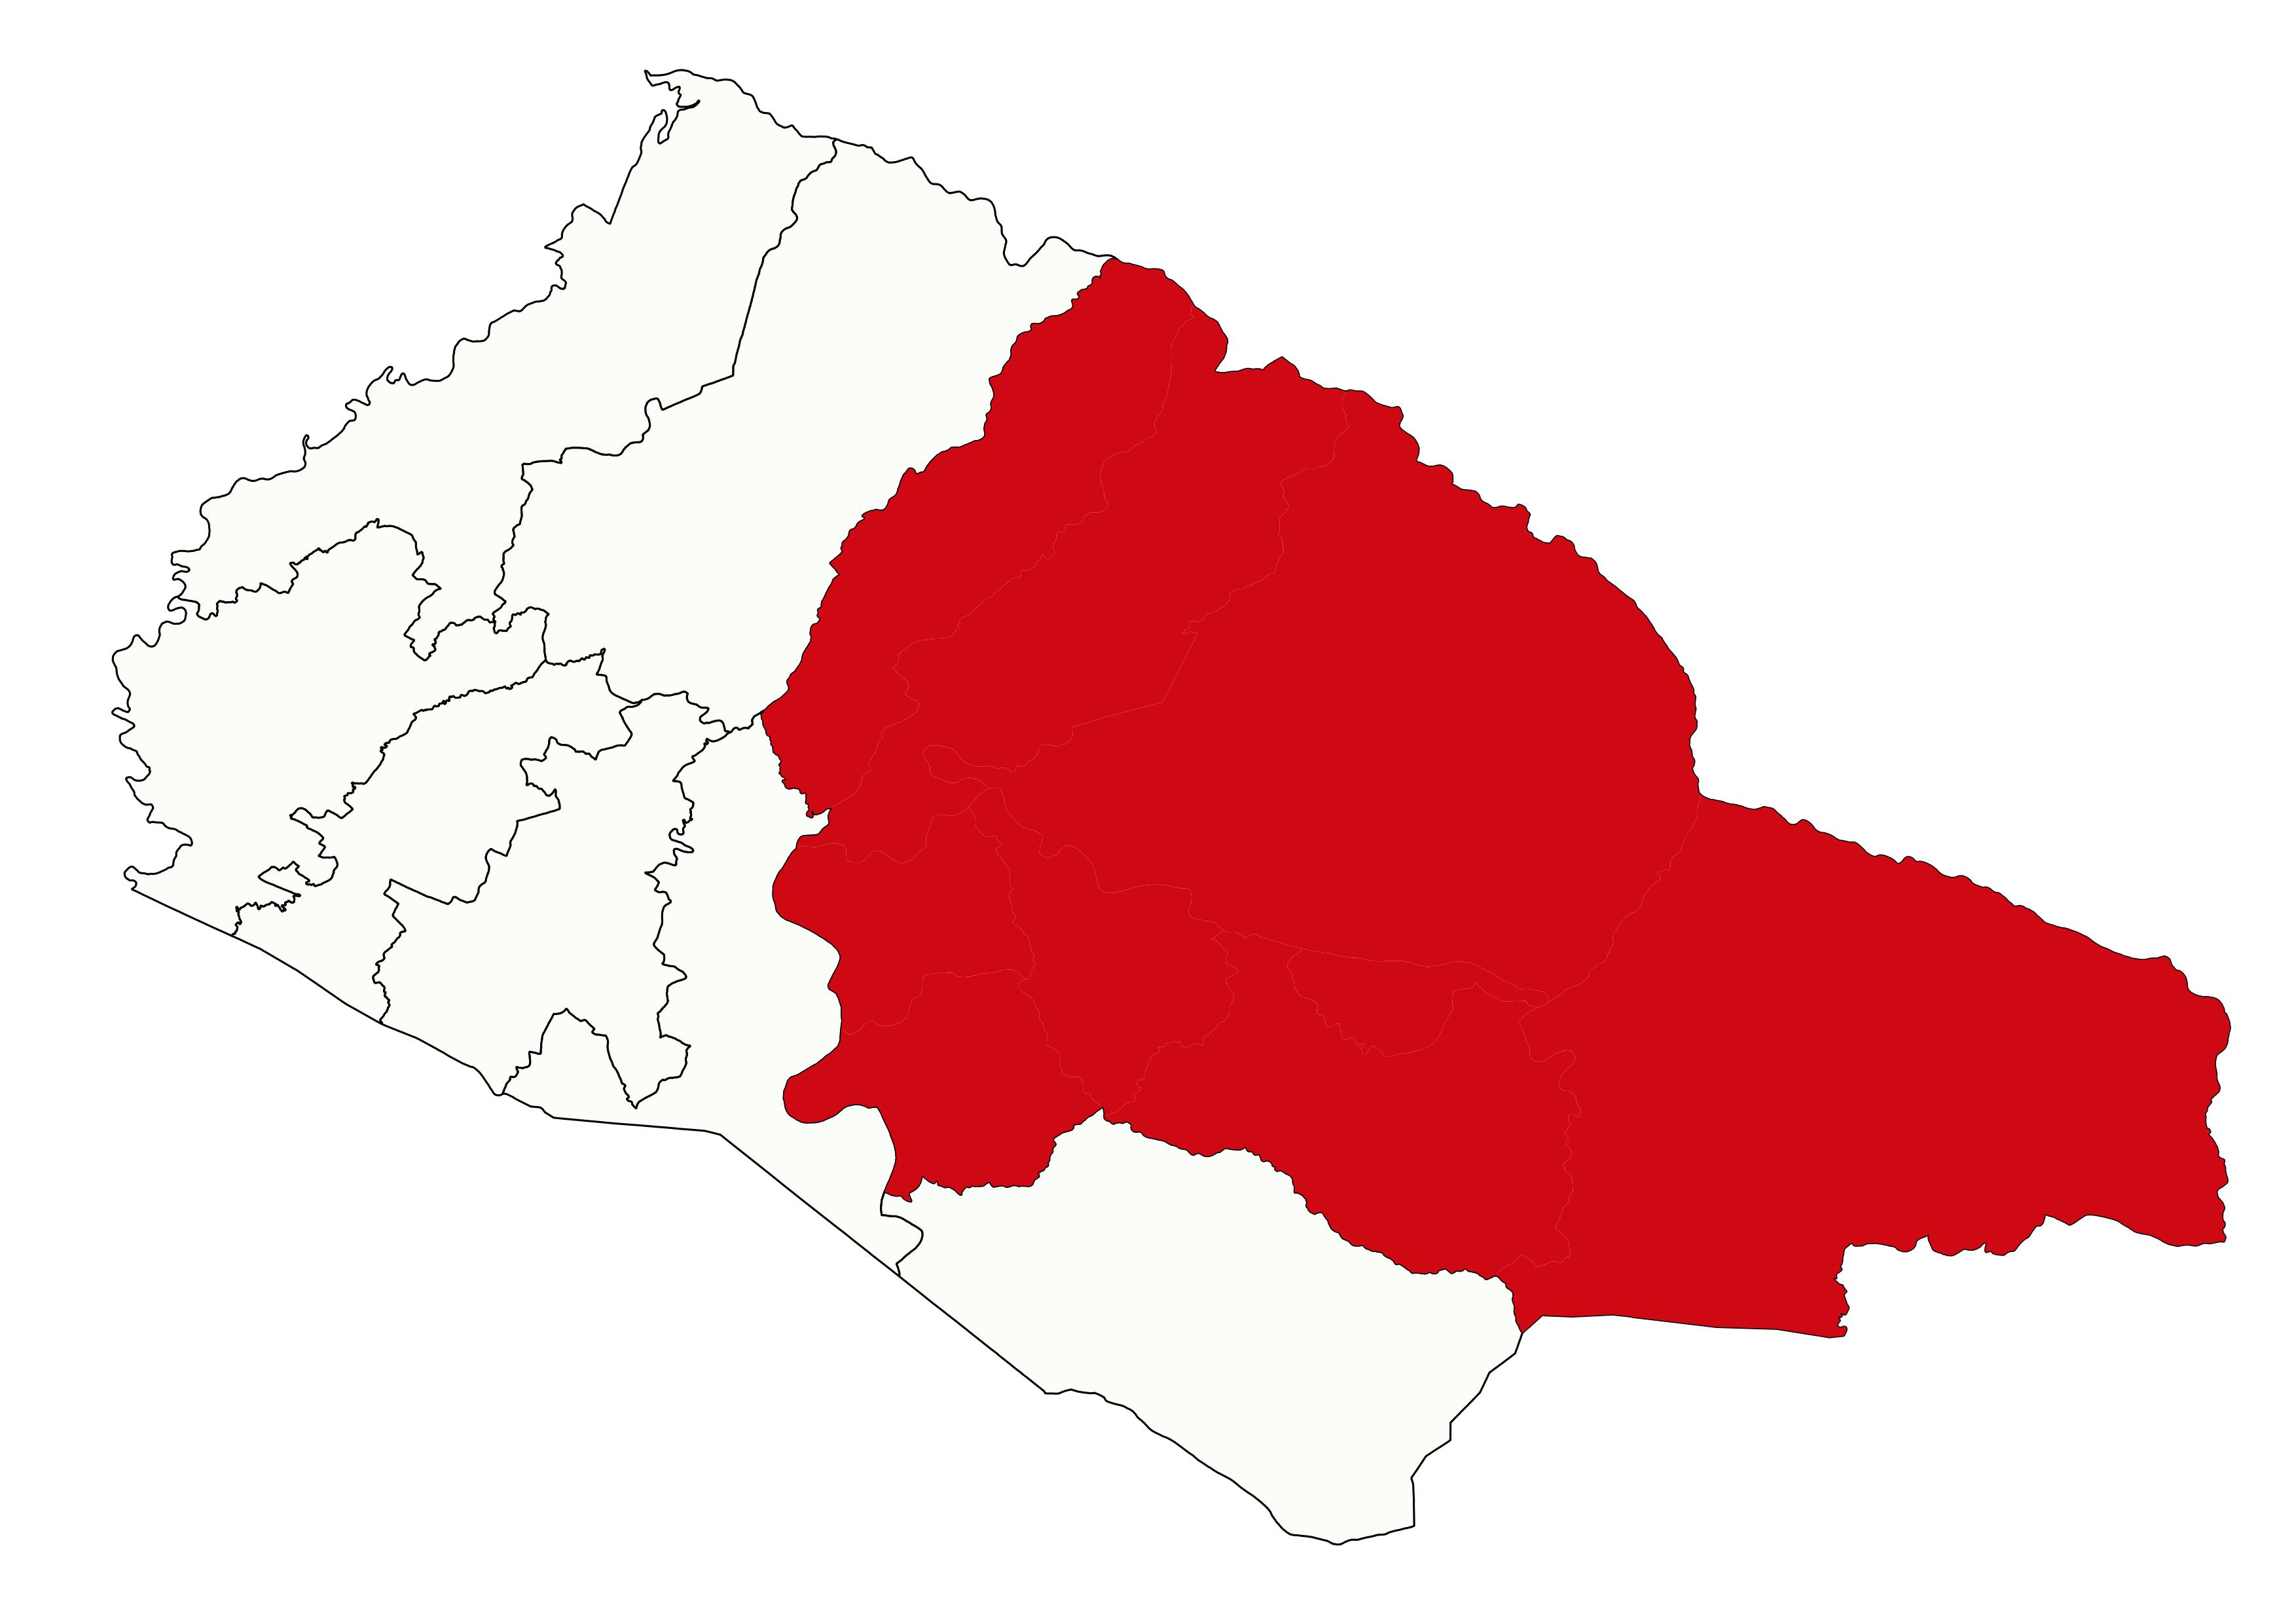
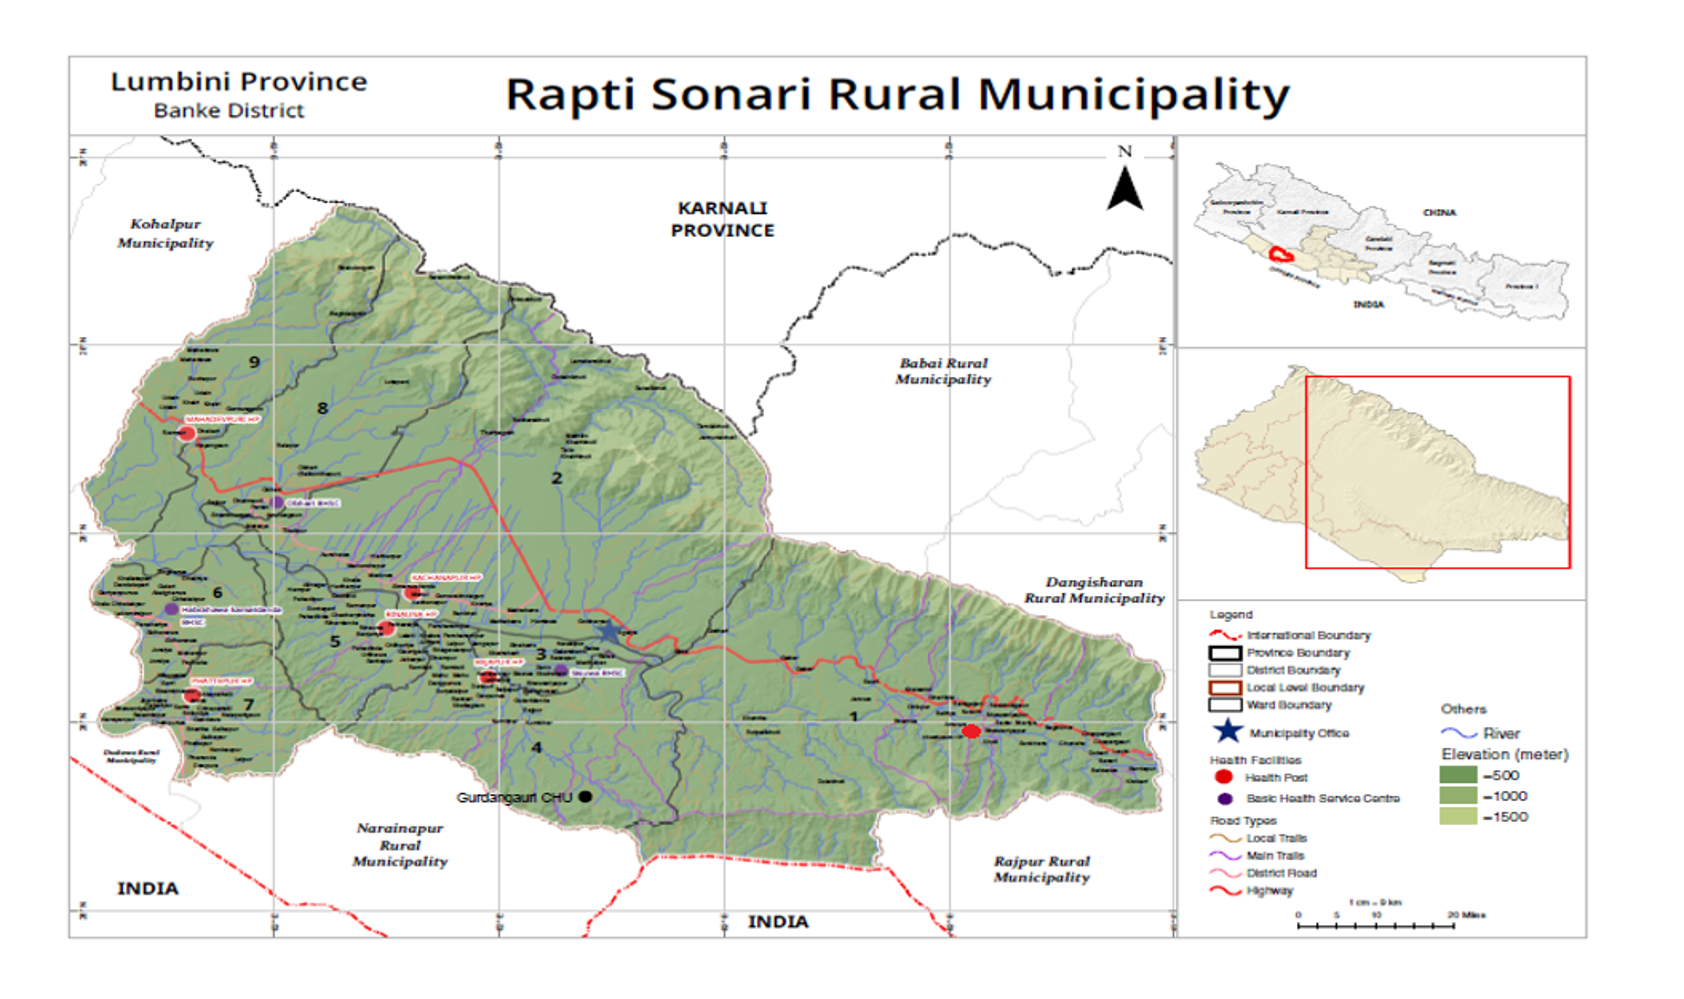
राप्तिसोनारी लुम्बिनि प्रदेश अनतर्गत वाँके जिल्लामा अवस्थित एक गाँउपालिका हो। यस् गाँउपालिकाको कुल क्षेत्रफल १०४१.७३ वर्ग कि.मि रहेको र यो गाउँपालिकाकोे अधिकांश क्षेत्र बाँके जिल्लाको उत्तर भावर क्षेत्रलाई समेटेको छ । पूर्वमा दाङ जिल्ला, पश्चिममा कोहलपुर न.पा र डुडुवा गा.पा.,उत्तरमा दाङ र सल्यान जिल्ला र दक्षिणमा नरैनापुर गा.पा र भारतीय सीमानाको चौघेरामा यो गाउँपालिका रहेको छ । साविकका ६वटा गाविसहरु खासकुश्मा,कचनापुर,बैजापुर,बिनौना,फत्तेपुर र महादेवपुरी मिलेर निर्माण भएको यो गाउँपालिकामा ९ वडामा विभाजित छ ।
जनसाङ्खिक सूचक
-
कूल जनसंख्या २
६६,४४५
२०७८ -
१ बर्ष भन्दा मुनिको जनसंख्या १
१,१६०
२०७८/७९ -
पाँच बर्ष भन्दा मुनिको जनसंख्या १
५,४६७
२०७८/७९ -
किशोरावस्था (१०-१९ बर्ष) को जनसंख्या १
१३,१२५
२०७८/७९ -
प्रजनन उमेरका महिला (१५ -४९ बर्ष ) १
२०,०४७
२०७८/७९ -
अनुमानित गर्भवती महिलाहरु १
१,४३३
२०७८/७९ -
अनुमानित जिवित जन्मको संख्या १
१,२११
२०७८/७९ -
परिवारमा अनुपस्थित (विदेशमा बस्ने) जनसंख्या २
९,४८१
२०७८ -
मोबाइल फोन भएका घरधुरी (%) २
५४
२०७८ -
टेलिभिजन भएका घरधुरी (%) २
१६
२०७८ -
लैङ्गिक अनुपात २
८९
२०७८ -
१४ बर्ष र सो भन्दा कम उमेरका जनसंख्या १
१७,८६७
२०८१/८२ -
६५ बर्ष र सो भन्दा माथि उमेरका जनसंख्या २
४,९८६
२०८१/८२
उमेर र लिंगको आधारमा जनसंख्या वितरण
जनगणना २०७८जातिगत आधारमा जनसंख्या वितरण
जनगणना २०७८वार्ड अनुसार जनसंख्या वितरण
जनगणना २०७८स्वास्थ्य सेवा प्रवाह गर्ने संस्थाहरु
- अस्पताल १
- प्रास्वाके -
- स्वास्थ्य चौकी ५
- शहरी स्वास्थ्य केन्द्र -
- बर्थिंग सेन्टर ८
सरकारी संस्था
- अस्पताल तथा नर्सिंग होम -
- पोलिक्लिनिक १
- औषधि पसल २५
निजी (गैर-सरकारी संस्था समेत)
अन्य स्वास्थ्य केन्द्रहरु
- माइक्रोस्कोपी केन्द्र ६
- एआरटि केन्द्र -
- एचाईभी परीक्षण केन्द्र -
- क्षयरोग उपचार केन्द्र १०
- आयुर्वेद अस्पताल/केन्द्र १
- आँखा अस्पताल/केन्द्र १
अस्पताल शैयाहरू
- सार्वजनिक १५
- निजी -
थप सेवाहरू
- आधारभुत स्वास्थ्य सेवा केन्द्र ३
- सामुदायक स्वास्थ्य इकाइ १
- गाउँघर क्लिनिक संख्या २१
- खोप केन्द्र संख्या ३४
वडा अनुसार स्वास्थ्य संस्थाको जानकारी
| स्वास्थ्यसंस्थाको नाम | वार्ड न | बर्थिंग सेन्टर BEONC/CEONC | महिला स्वास्थ्य स्वयं सेवक संख्या | दक्ष प्रसुतिकर्मी संख्या | परिवार नियोजन *सेवा | स्वीकृत दरबन्दी | दरबन्दी अनुसार पदपूर्ति | करारका कर्मचारी |
|---|---|---|---|---|---|---|---|---|
| खासकुसुम स्वास्थ्य चाैकी | १ | बर्थिंग केन्द्र | १३ | ३ | ५ साधनहरू | ६ | ५ | २ |
| कचनापुर स्वास्थ्य चाैकी | २ | बर्थिंग केन्द्र | १६ | २ | ५ साधनहरू | ६ | ५ | २ |
| शिसुवा अाधारभुत स्वास्थ्य केन्द्र | ३ | - | ११ | ० | ५ साधनहरू | ३ | ३ | २ |
| राप्ती सोनारी आधारभुत अस्पताल | ४ | बर्थिंग केन्द्र | १० | २ | ५ साधनहरू | ३० | ५ | २५ |
| विनाैना स्वास्थ्य चाैकी | ५ | बर्थिंग केन्द्र | १५ | २ | ५ साधनहरू | ६ | ५ | २ |
| फतेपुर स्वास्थ्य चाैकी | ७ | बर्थिंग केन्द्र | १७ | ३ | ५ साधनहरू | ६ | ६ | ३ |
| शमशेरगँज अाधारभुत स्वास्थ्य चाैकी | ८ | बर्थिंग केन्द्र | ७ | १ | ५ साधनहरू | ३ | ३ | ३ |
| माहादेवपुरी स्वास्थ्य चाैकी | ९ | बर्थिंग केन्द्र | ९ | २ | ५ साधनहरू | ६ | ७ | ४ |
| अाधारभुत स्वास्थ्य केन्केद्न्द्रर कमैयाडाँडा | ६ | बर्थिंग केन्द्र | १२ | २ | ५ साधनहरू | २ | ३ | २ |
| गुरदनगाैरी सामुदायक इकाइ | ४ | - | - | ० | ३ साधनहरू | ० | ० | १ |
| नागरिक आरोग्य केन्द्र महादेवपुरी | ९ | - | ० | ० | ० साधनहरू | ० | ० | १ |
| कुल कर्मचारी संख्या | ११० | १७ | ६८ | ४२ | ४७ | |||
स्वास्थ्य सेवाको लागि मानव संसाधन
- CEONC साइटहरू-
- BEONC साइटहरू-
- आइयुसीडी तथा इम्पलान्ट सेवा प्रदायक१३
- एकीकृत बालरोग व्यवस्थापन (IMCI) प्रशिक्षित कर्मचारी३६
- जनसंख्या (प्रति मस्वास्वका) ६०४
- जनसंख्या (प्रति स्वास्थ्यकर्मी) १५८२
- अनुमानित गर्भवति (प्रति दक्ष प्रसुतिकर्मी) ८४
- अनुमानित गर्भवति (प्रति बर्थिङ्ग सेन्टर) -
- जनसंख्या (प्रति स्वास्थ्य संस्था) (अस्पताल,प्रस्वाके र स्वाचौ सहित) -
- जनसंख्या (प्रति सरकारी अस्पताल) ६६४४५
- जनसंख्या (प्रति अस्पताल र नर्सिंग होम (सबै) ६६४४५
मातृशिशु बालस्वास्थ्य र परिवार नियोजन सेवा उपयोगको अवस्था
स्वास्थ्य सूचना व्यवस्थापन प्रणाली २०८१प्रमूख स्वास्थ्य सेवाहरूको उपयोगको तुलनात्मक अवस्था
| सूचक | राप्ती सोनारी गाउँपालिका | लुम्बिनी प्रदेश २०७८/७९ | राष्ट्रीय २०७८/७९ | |||
|---|---|---|---|---|---|---|
| २०८०/८१ | २०७९/८० | २०७८/७९ | ||||
| खाेप |
ग्राफ
तालिका
|
|||||
| बि.सि.जि. कभरेज | ७६.५३ | ९०.२९ | ८७.५ | १०३.१ | १०३.५ | |
| २३ महिनाभित्र पूर्ण खोप प्राप्त गरेका बालबालिका (%) | ९१.८८ | ७८.५९ | ० | ० | ० | |
| डि.पि.टि. - हेप बि - हिव ३ कभरेज | ७८.७३ | ८६.५७ | ८७.५ | ९६.६ | ९५.२ | |
| दादुरा रूबेला १ (९-११ महिना) कभरेज | ८४.६६ | ८७.७८ | ८९.४ | ९६.७ | ९४.७ | |
| जे.इ कभरेज | ९०.०७ | ८४.८९ | ९१.२ | ९८.९ | ९५.९ | |
| टि.डी. २ र टि. डी. २+ कभरेज | ६७.६४ | ७१.४१ | ७०.७ | ७३.९ | ७१.७ | |
| पोषण |
ग्राफ
तालिका
|
|||||
| कम जन्म तौल भएका नवजात शिशुको प्रतिशत | १०.२२ | ११.१ | ७.५ | १२ | ९.४ | |
| नयाँ तौल लिएका १ वर्ष मुनिका शिशुहरुको प्रतिशत | ८१.७८ | ९७.८ | ७५ | १०९ | १०४.१ | |
| नयाँ तौल लिएका २ वर्ष मुनिका शिशुहरु मध्ये अति जोखिम अवस्थाका बालबालिकाहरुको प्रतिशत | ३.३५ | ३.८७ | २.४ | ३.५ | ३.६ | |
| गर्भवती अवस्थामा १८० दिन आइरन चक्की प्राप्त गरेका गर्भवती महिलाहरुको प्रतिशत | ५२.३६ | ६६.४३ | ७०.३ | ७५.८ | ६० | |
| सुत्केरी अवस्थामा भिटामिन ए प्राप्त गरेका महिलाहरुको प्रतिशत | १०० | १०० | ६५ | ९८.२ | ७६.३ | |
| नवजात शिशु तथा बाल रोगको एकीकृत व्यस्थापन |
ग्राफ
तालिका
|
|||||
| नाभी मलम लगाएका नवजात शिशुको प्रतिशत | १०० | १०० | १०० | ९४.२ | ८२.९ | |
| ब्याक्टेरियाको गम्भीर संक्रमण भएकामध्ये जेन्टामाईसिन सुईद्वारा पूर्ण उपचार पाएको प्रतिशत | २५ | ४१.१८ | ३३.२ | ३९.५ | ४७.४ | |
| नयाँ निमोनिया बिरामीको दर (प्रति हजार पाँच वर्षमुनिका बालबालिकाहरुमा) | २१.९१ | ३२.८९ | ४१.२ | २९.३ | ३६.८ | |
| नयाँ एआरआई (स्वाशप्रश्वाका) बिरामी मध्ये कडा निमोनिया भएका बिरामीको प्रतिशत | ० | ०.०२ | ० | ०.०५ | ०.१८ | |
| नयाँ झाडापखालाका बिरामीको दर (प्रति हजार पाँच वर्ष मुनिका बालबालिकाहरुमा) | १३१.१९ | ११३.३८ | ७३.३४ | ३३९ | ३५२.४ | |
| ५ वर्ष मुनिका झाडापखालाका बिरामी मध्ये जिंक र पुनर्जलीय झोलबाट उपचार गरेको प्रतिशत | १०० | ९६.५० | ९८.३ | ९८.७ | ९४.५ | |
| जम्मा नवजात शिशु मृत्यु संख्या | ३ | २ | ९ | ५७३ | १९१४ | |
| सुरक्षित मातृत्व तथा परिवार नियोजन |
ग्राफ
तालिका
|
|||||
| प्परोटोकल अनुसार पहिलो पटक गर्भवती जाँच गराएका गर्भवती महिलाहरुको प्रतिशत | ६५.०७ | ५९.९२ | ८७.४ | ९३.५ | ९१.४ | |
| प्रजनन् उमेरका महिलाहरुमा परिवार नियोजनको प्रयोगकर्ता दर (आधुनिक साधन) | १५ | १९ | ० | ० | ० | |
| ४ पटक गर्भवती जाँच (महिना: ४,६,८,९/हप्ता: १६, २०-२४,३२ र ३६) महिलाहरुको प्रतिशत | ५७.२५ | ७१.५५ | ६९.२ | ७९.७ | ७९.४ | |
| स्वास्थ्य संस्था प्रसुति दर | ४९.१९ | ६३.०२ | ६४.८ | ९४.२ | ७९ | |
| दक्ष प्रसुतिकर्मी/स्वास्थ्यकर्मीद्वारा प्रसुति गराएको प्रतिशत | ४८.२९ | ६०.५५ | ६३.४ | ८९.८ | ७५ | |
| प्रोटोकल अनुसार ४ पटक (आ.व २०७८/७९ सम्म ३ पटक) सुत्केरी जाँच गराउने आमाहरुको प्रतिशत | ४३.३२ | ३२.७९ | ५८.२ | ५३.७ | ४०.८ | |
| जम्मा मातृ मृत्यु संख्या | ० | ० | ० | ७४ | २३१ | |
| परिवार नियोजन सेवाका नयाँ सेवाग्राही दर (प्रजनन उमेरका महिलाहरु मध्ये) | ८.१५ | ९.३८ | ११.२ | १२.४ | ११.५ | |
| औलो रोग, क्षय रोग, कुष्ठरोग र एचआईभी |
ग्राफ
तालिका
|
|||||
| औलोको स्लाइड नमुना पोजेटिभ दर | ०.४२ | ०.१ | ० | ०.२७ | ०.१७ | |
| डेंगुको जम्मा विरामी संख्या | ० | २ | ० | ० | ० | |
| आयातित औलोरोगको प्रतिशत (नयाँ औलो रोग मध्ये | ७५ | १०० | ० | ९५.५ | ८९.५ | |
| जम्मा औलो रोग मध्ये प्लाज्मोडियम फाल्सिपारमको अनुपात | ० | ० | ० | ३८.७ | २२.८ | |
| नयाँ क्षयरोगी बिरामी पत्ता लागेको दर | १५८.३३ | १५५.७५ | १३३.८ | १५७.४ | १२९.१ | |
| क्षयरोगको उपचार सफलता दर | ९२.०८ | ९२.७१ | ९२.१ | ९१ | ९१.५ | |
| कुष्ठरोगको रोग प्रकोप दर (प्रति १०००० मा) | ०.२९ | ०.८७ | ०.४४ | ०.९ | ० | |
| ए. आर. टी. उपचारमा रहेका जम्मा एच. आइ. भी. पोजेटिभको संख्या | ३५ | ३५ | ० | ४३२६ | २२१५२ | |
| उपचारात्मक सेवा |
ग्राफ
तालिका
|
|||||
| ओ पि डी मा आएका बिरामी मध्ये नयाँ बिरामीको दर | ५८.५४ | ५६.७५ | ५३.६६ | ९४.५ | ९२ | |
शीर्ष १० स्वास्थ्य अवस्थाको सूची
स्वास्थ्य सूचना व्यवस्थापन प्रणाली २०८१स्वास्थ्य क्षेत्रमा बजेट
- सशर्त स्वास्थ्यमा छुट्याएको बजेट
- समानीकरणबाट विनियोजित स्वास्थ्य बजेट
- अन्य श्रोतबाट बिनियोजित स्वास्थ्य बजेट
| बजेट | राप्ती सोनारी गाउँपालिका | |||||
|---|---|---|---|---|---|---|
| २०७८/७९ | २०७९/८० | २०८०/८१ | ||||
| ग्राफ | ||||||
| पालिकाको कुल बजेट (रु ) | ८७४,७३२,३५१ | ८८३,१४८,००० | ८५८,०८४,००० | |||
| स्वास्थ्य बजेट (सबै स्रोत) | ५४,०१२,००० | ५९,८००,००० | ७७,२२०,००० | |||
| सशर्त स्वास्थ्यमा छुट्याएको बजेट | ४०,४००,००० | ४६,१३८,००० | ४३,७२०,००० | |||
| समानीकरणबाट विनियोजित स्वास्थ्य बजेट | १३,६१२,००० | १३,६६२,००० | ३३,५००,००० | |||
| अन्य श्रोतबाट बिनियोजित स्वास्थ्य बजेट | - | - | - | |||
| बजेट खर्च (%) | ९१ | ८४ | ९२ | |||
| तालिका | ||||||
महत्वपूर्ण सम्पर्क
Rapti Sonari Rural Municipality
ठेगाना : राप्ती साेनारी गाउँपालिका
टेलिफोन : ९८५८०६०१४५
वेबसाइट : http://raptisonarimun.gov.np/
स्वास्थ्य शाखा प्रमुख
नाम : देवेन्द्र कुमार के.सी.
सम्पर्क : ९८५८०३६७९६
ईमेल : debendrakc37@gmail.com

यो प्रोफाइल अमेरिकी अन्तर्राष्ट्रिय विकास नियोग (युएसएआइडी) मार्फत अमेरिकी जनताहरुको सहयोगका कारण सम्भव बनेको हो । यो प्रतिवेदन भित्रका विषयवस्तु र सामग्री स्वास्थ्यका लागि सक्षम प्रणालीका एकल जिम्मेवारी हुन् र तिनले युएसएआइडी वा अमेरिकी सरकारको विचारको प्रतिविम्बित गर्छन् भन्ने जरुरी छैन ।