संक्षिप्त परिचय सानीभेरी गाउँपालिका
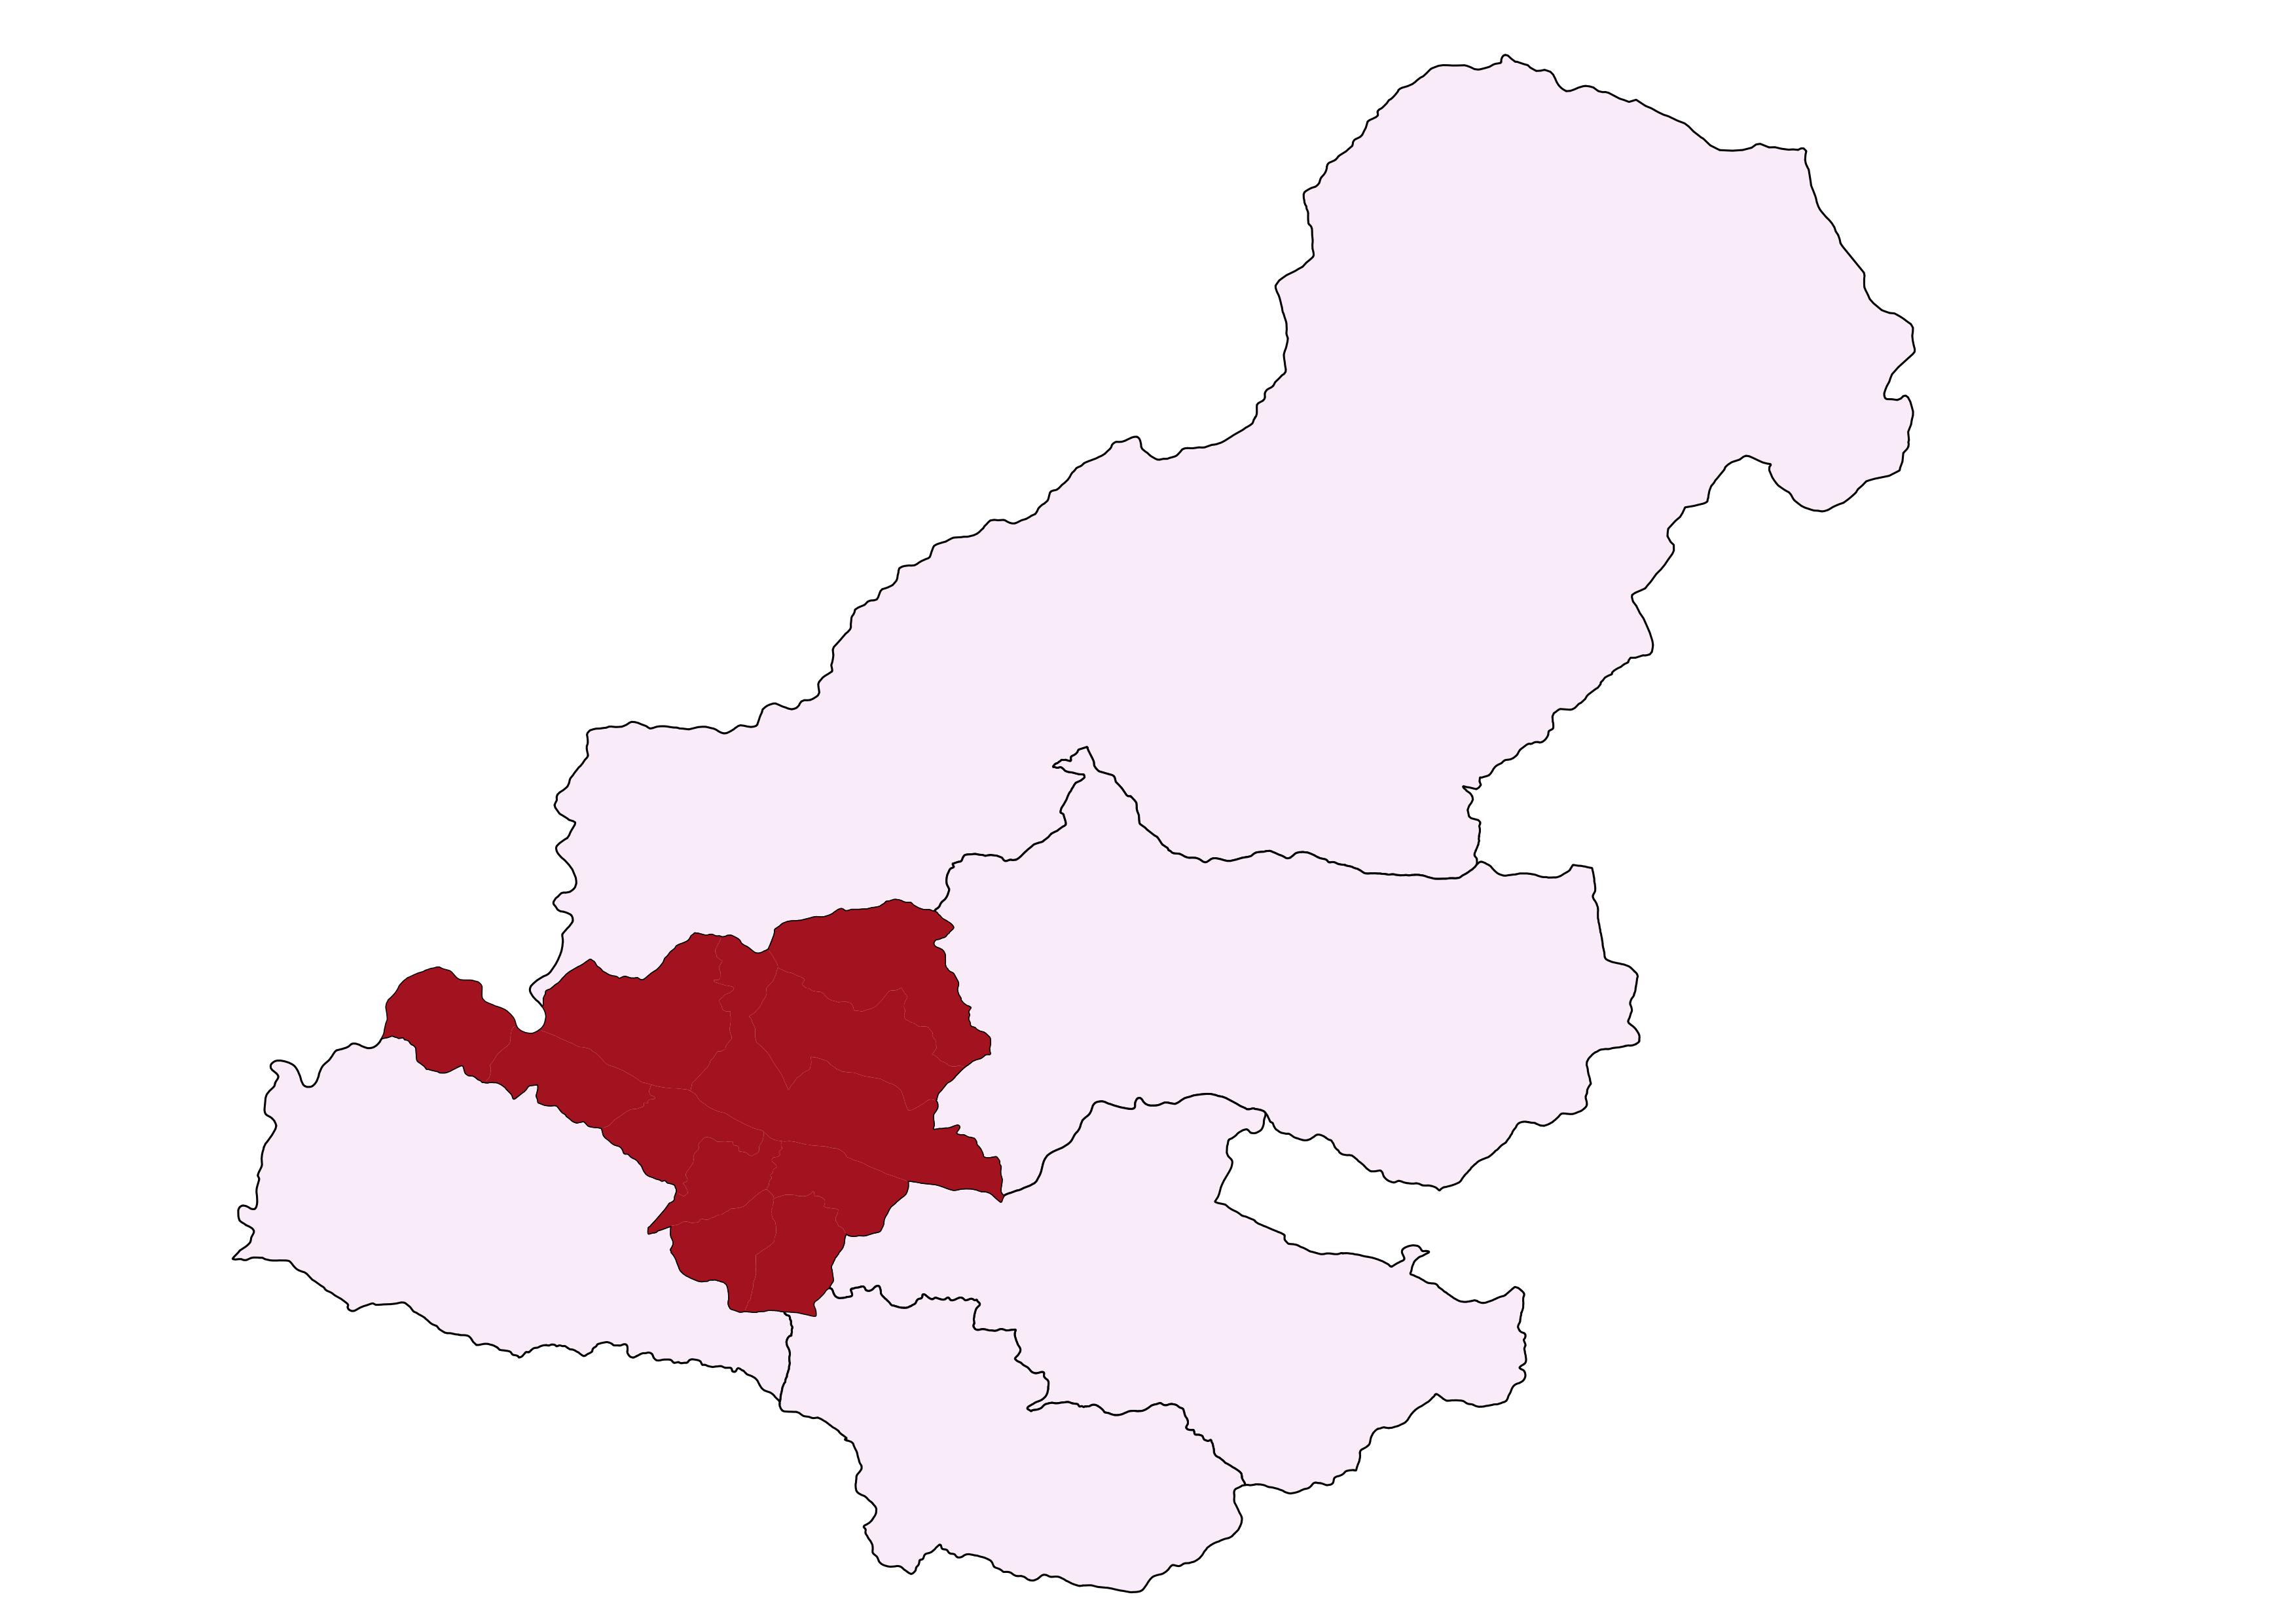
नेपालको कणार्ली प्रदेश अन्तर्गत पर्ने रुकुम (पश्चिम) जिल्लामा अवस्थित सानीभेरी गाँउपालिका नेपालको संविधानको धारा २९५ को उपधारा (३) बमोजिम कायम भएकाे गाउँपालिका हो । रुकुम जिल्लाको प्रसिद्ध सानीभेरी नदीबाट यस गाँउपालिकाको नाम रहन गएको हो।जैविक विविधता र पहाडहरुले घेरेको सानीभेरी गाँउपालिकामा साविक गा.वि.स. हरु सिम्ली, गरायला, अर्मा, दुली (१, २, ३, ७, ८ र ९) र पुर्तिमकाँडा (१, २, ३, ६, ७ र ८) भु-भाग ओगेटेर बनेको यस गाँउपालिकाको कुल क्षेत्रफल १३३.८ वर्ग किलोमिटर रहेको र यसको केन्द्र सिम्लीमा रहेको छ । जम्मा ११ वडाहरुमा विभाजन गरिएको यस गाँउपालिकाको सिमाना पूर्वमा मुसिकोट नगरपालिका र बाँफिकोट गाँउपालिका, पश्चिममा जाजरकोट जिल्ला,उत्तरमा आठविसकोट नगरपालिका र दक्षिणमा चौरजाहारी नगरपालिका र त्रिवेणा गाउँपालिका रहेको भौगोलिक र प्रशासनिक बनोट रहेको छ ।
जनसाङ्खिक सूचक
-
कूल जनसंख्या ७
२५,१४४
/ -
१ बर्ष भन्दा मुनिको जनसंख्या ७
५३६
/ -
पाँच बर्ष भन्दा मुनिको जनसंख्या ७
२,६५६
/ -
किशोरावस्था (१०-१९ बर्ष) को जनसंख्या ७
५,१९८
/ -
प्रजनन उमेरका महिला (१५ -४९ बर्ष ) ७
७,११७
/ -
अनुमानित गर्भवती महिलाहरु ७
६५८
/ -
अनुमानित जिवित जन्मको संख्या ७
५१९
/ -
परिवारमा अनुपस्थित (विदेशमा बस्ने) जनसंख्या २
१,०६७
-
मोबाइल फोन भएका घरधुरी (%) २
३७
-
लैङ्गिक अनुपात २
९०
-
१४ बर्ष र सो भन्दा कम उमेरका जनसंख्या ७
७,९०६
/ -
६५ बर्ष र सो भन्दा माथि उमेरका जनसंख्या २
१,८५८
उमेर र लिंगको आधारमा जनसंख्या वितरण
जनगणना २०६८जातिगत आधारमा जनसंख्या वितरण
जनगणना २०६८वार्ड अनुसार जनसंख्या वितरण
जनगणना २०६८स्वास्थ्य सेवा प्रवाह गर्ने संस्थाहरु

- अस्पताल १
- प्रास्वाके -
- स्वास्थ्य चौकी ४
- सामुदायिक स्वास्थ्य ईकाई -
- शहरी स्वास्थ्य केन्द्र -
- गाउँघर क्लिनिक ५
- खोप क्लिनिक १७
- आधारभूत स्वस्थ सेवाकेन्द्र ७
- बर्थिंग सेन्टर ४
सरकारी संस्था
- अस्पताल तथा नर्सिंग होम -
- पोलिक्लिनिक -
- औषधि पसल १०
निजी (गैर-सरकारी संस्था समेत)
अन्य स्वास्थ्य केन्द्रहरु
- माइक्रोस्कोपी केन्द्र १
- एआरटि केन्द्र -
- एचाईभी परीक्षण केन्द्र -
- क्षयरोग उपचार केन्द्र ५
- आयुर्वेद अस्पताल/केन्द्र -
- आँखा अस्पताल/केन्द्र -
अस्पताल शैयाहरू
- सार्वजनिक १५
- निजी -
वडा अनुसार स्वास्थ्य संस्थाको जानकारी
| स्वास्थ्यसंस्थाको नाम | वार्ड न | बर्थिंग सेन्टर BEONC/CEONC | महिला स्वास्थ्य स्वयं सेवक संख्या | दक्ष प्रसुतिकर्मी संख्या | परिवार नियोजन *सेवा | स्वीकृत दरबन्दी | दरबन्दी अनुसार पदपूर्ति | करारका कर्मचारी |
|---|---|---|---|---|---|---|---|---|
| सानीभेरी गाउँ पालिका अस्पताल | ७ | बर्थिङ सेन्टर | ९ | २ | ५ साधनहरू | ५ | ६ | ७ |
| गरायला स्वास्थ्य चाैकी | ४ | - | ५ | १ | ४ साधनहरू | ५ | ४ | १ |
| अरमा स्वास्थ्य चाैकी | ११ | ९ | १ | ५ साधनहरू | ५ | ५ | ० | |
| दुली स्वास्थ्य चाैकी | ५ | बर्थिङ सेन्टर | ६ | १ | ४ साधनहरू | ५ | ४ | २ |
| चाइनाबगर स्वास्थ्य चाकी | १ | बर्थिङ सेन्टर | ६ | १ | ४ साधनहरू | ० | ३ | २ |
| आधारभुत स्वास्थ्य सेवा केन्द्र | २ | - | ० | ० | ३ साधनहरू | ० | ० | २ |
| अfधारभुत स्वास्थ्य केन्द् | १० | - | ० | ० | ३ साधनहरू | ० | ० | २ |
| आधारभुत स्वास्थ्य सेवा केन्द्र | ६ | - | ० | ० | ३ साधनहरू | ० | १ | १ |
| आधारभुत स्वास्थ्य सेवा केन्द्र | ३ | - | ४ | १ | ३ साधनहरू | ५ | ० | २ |
| आधारभुत स्वास्थ्य सेवा केन्द्र | ९ | - | ० | ० | ३ साधनहरू | ० | २ | ० |
| आधारभुत स्वास्थ्य सेवा केन्द्र | ८ | - | ० | ० | ३ साधनहरू | ० | ० | २ |
| आधारभुत स्वास्थ्य सेवा केन्द्र | ७ | - | ० | ० | ३ साधनहरू | ० | ० | २ |
| कुल कर्मचारी संख्या | ३९ | ७ | २५ | २५ | २३ | |||
स्वास्थ्य सेवाको लागि मानव संसाधन
- CEONC साइटहरू-
- BEONC साइटहरू-
- आइयुसीडी तथा इम्पलान्ट सेवा प्रदायक-
- एकीकृत बालरोग व्यवस्थापन (IMCI) प्रशिक्षित कर्मचारी१२
- जनसंख्या (प्रति मस्वास्वका) ६४५
- जनसंख्या (प्रति स्वास्थ्यकर्मी) १००६
- अनुमानित गर्भवति (प्रति दक्ष प्रसुतिकर्मी) ९४
- अनुमानित गर्भवति (प्रति बर्थिङ्ग सेन्टर) १६५
- जनसंख्या (प्रति स्वास्थ्य संस्था) (अस्पताल,प्रस्वाके र स्वाचौ सहित) -
- जनसंख्या (प्रति सरकारी अस्पताल) २५१४४
- जनसंख्या (प्रति अस्पताल र नर्सिंग होम (सबै) २५१४४
मातृशिशु बालस्वास्थ्य र परिवार नियोजन सेवा उपयोगको अवस्था
स्वास्थ्य सूचना व्यवस्थापन प्रणाली २०७८०७९प्रमूख स्वास्थ्य सेवाहरूको उपयोगको तुलनात्मक अवस्था
| सूचक | सानीभेरी गाउँपालिका | कर्णाली प्रदेश २०७८/७९ | राष्ट्रीय २०७८/७९ | |||
|---|---|---|---|---|---|---|
| २०७६/७७ | २०७७/७८ | २०७८/७९ | ||||
| खाेप |
ग्राफ
तालिका
|
|||||
| बि.सि.जि. कभरेज | ८८.५ | १०८.९ | ९३ | ९२ | १०३.५ | |
| २३ महिनाभित्र पूर्ण खोप प्राप्त गरेका बालबालिका (%) | ० | ० | ० | ० | ० | |
| डि.पि.टि. - हेप बि - हिव ३ कभरेज | ९५.७ | १०८.९ | १०४ | ९४ | ९५.२ | |
| दादुरा रूबेला १ (९-११ महिना) कभरेज | ९३ | ९७.५ | ९६ | ९५ | ९४.७ | |
| जे.इ कभरेज | ८७.५ | ८९.५ | १०७ | ९६ | ९५.९ | |
| टि.डी. २ र टि. डी. २+ कभरेज | ५७.१ | ६६.७ | ६७ | ६६ | ७१.७ | |
| पोषण |
ग्राफ
तालिका
|
|||||
| कम जन्म तौल भएका नवजात शिशुको प्रतिशत | ० | ० | १.७ | ६.८ | ९.४ | |
| नयाँ तौल लिएका १ वर्ष मुनिका शिशुहरुको प्रतिशत | १०७ | ११९.२ | ११९ | १२० | १०४.१ | |
| नयाँ तौल लिएका २ वर्ष मुनिका शिशुहरु मध्ये अति जोखिम अवस्थाका बालबालिकाहरुको प्रतिशत | ३.८ | ९५.६ | ८२.४ | ४.१ | ३.६ | |
| गर्भवती अवस्थामा १८० दिन आइरन चक्की प्राप्त गरेका गर्भवती महिलाहरुको प्रतिशत | २४.६ | ४२.५ | ६८.१ | ७३ | ६० | |
| सुत्केरी अवस्थामा भिटामिन ए प्राप्त गरेका महिलाहरुको प्रतिशत | ४६.२ | ४९.५ | ५४.१ | ८८ | ७६.३ | |
| नवजात शिशु तथा बाल रोगको एकीकृत व्यस्थापन |
ग्राफ
तालिका
|
|||||
| नाभी मलम लगाएका नवजात शिशुको प्रतिशत | ६८.३ | ८०.२ | ७७ | ९६ | ८२.९ | |
| ब्याक्टेरियाको गम्भीर संक्रमण भएकामध्ये जेन्टामाईसिन सुईद्वारा पूर्ण उपचार पाएको प्रतिशत | ५० | ३३.३ | ० | ७५ | ४७.४ | |
| नयाँ निमोनिया बिरामीको दर (प्रति हजार पाँच वर्षमुनिका बालबालिकाहरुमा) | ९३ | ५२.४ | ६४ | ११३ | ३६.८ | |
| नयाँ एआरआई (स्वाशप्रश्वाका) बिरामी मध्ये कडा निमोनिया भएका बिरामीको प्रतिशत | ० | ० | ० | ०.४१ | ०.१८ | |
| नयाँ झाडापखालाका बिरामीको दर (प्रति हजार पाँच वर्ष मुनिका बालबालिकाहरुमा) | २८१.८ | ४१५.५ | ४०५.२ | ५७९ | ३५२.४ | |
| ५ वर्ष मुनिका झाडापखालाका बिरामी मध्ये जिंक र पुनर्जलीय झोलबाट उपचार गरेको प्रतिशत | १०० | १०० | १०० | ९५ | ९४.५ | |
| जम्मा नवजात शिशु मृत्यु संख्या | २ | ० | ० | १९९ | १९१४ | |
| सुरक्षित मातृत्व तथा परिवार नियोजन |
ग्राफ
तालिका
|
|||||
| प्परोटोकल अनुसार पहिलो पटक गर्भवती जाँच गराएका गर्भवती महिलाहरुको प्रतिशत | ६२ | ७४ | ८१.१ | १२२ | ९१.४ | |
| प्रजनन् उमेरका महिलाहरुमा परिवार नियोजनको प्रयोगकर्ता दर (आधुनिक साधन) | ० | ० | ० | ० | ० | |
| ४ पटक गर्भवती जाँच (महिना: ४,६,८,९/हप्ता: १६, २०-२४,३२ र ३६) महिलाहरुको प्रतिशत | २४.६ | ७४ | ६७.२ | ७३ | ७९.४ | |
| स्वास्थ्य संस्था प्रसुति दर | २९.१ | ३७.५ | ४४ | ८३ | ७९ | |
| दक्ष प्रसुतिकर्मी/स्वास्थ्यकर्मीद्वारा प्रसुति गराएको प्रतिशत | २७.६ | ३७.५ | ४४ | ७० | ७५ | |
| प्रोटोकल अनुसार ४ पटक (आ.व २०७८/७९ सम्म ३ पटक) सुत्केरी जाँच गराउने आमाहरुको प्रतिशत | १३.७ | २० | ४२.१ | ५३ | ४०.८ | |
| जम्मा मातृ मृत्यु संख्या | ० | ० | ० | १७ | २३१ | |
| परिवार नियोजन सेवाका नयाँ सेवाग्राही दर (प्रजनन उमेरका महिलाहरु मध्ये) | १७.३ | २१.२ | १९ | १९ | ११.५ | |
| औलो रोग, क्षय रोग, कुष्ठरोग र एचआईभी |
ग्राफ
तालिका
|
|||||
| औलोको स्लाइड नमुना पोजेटिभ दर | ० | ० | ० | ०.२५ | ०.१७ | |
| डेंगुको जम्मा विरामी संख्या | ० | ० | ० | ० | ० | |
| आयातित औलोरोगको प्रतिशत (नयाँ औलो रोग मध्ये | ० | ० | ० | ६३ | ८९.५ | |
| जम्मा औलो रोग मध्ये प्लाज्मोडियम फाल्सिपारमको अनुपात | ० | ० | ० | २.१ | २२.८ | |
| नयाँ क्षयरोगी बिरामी पत्ता लागेको दर | ७५.२ | ६२.१ | ९२.७ | ९७ | १२९.१ | |
| क्षयरोगको उपचार सफलता दर | १०० | ९४ | १०० | ९१ | ९१.५ | |
| कुष्ठरोगको रोग प्रकोप दर (प्रति १०००० मा) | ० | ०.८३ | १.७ | ०.५ | ० | |
| ए. आर. टी. उपचारमा रहेका जम्मा एच. आइ. भी. पोजेटिभको संख्या | ० | ० | ० | ६९१ | २२१५२ | |
| उपचारात्मक सेवा |
ग्राफ
तालिका
|
|||||
| ओ पि डी मा आएका बिरामी मध्ये नयाँ बिरामीको दर | ७५.६ | ९९.९ | ९३.२ | १०५ | ९२ | |
शीर्ष १० स्वास्थ्य अवस्थाको सूची
स्वास्थ्य सूचना व्यवस्थापन प्रणाली २०७८०७९स्वास्थ्य क्षेत्रमा बजेट
- सशर्त स्वास्थ्यमा छुट्याएको बजेट
- समानीकरणबाट विनियोजित स्वास्थ्य बजेट
- अन्य श्रोतबाट बिनियोजित स्वास्थ्य बजेट
| बजेट | सानीभेरी गाउँपालिका | |||||
|---|---|---|---|---|---|---|
| २०७७/७८ | २०७८/७९ | २०७९/८० | ||||
| ग्राफ | ||||||
| पालिकाको कुल बजेट (रु ) | ४८५,०८६,४०० | ५१५,०९०,००० | ||||
| स्वास्थ्य बजेट (सबै स्रोत) | ४८,५८४,५९६ | ४१,१८०,००० | ||||
| सशर्त स्वास्थ्यमा छुट्याएको बजेट | ३२,२४५,७०० | २१,३८०,००० | ||||
| समानीकरणबाट विनियोजित स्वास्थ्य बजेट | १६,३३८,८९६ | १९,८००,००० | ||||
| अन्य श्रोतबाट बिनियोजित स्वास्थ्य बजेट | - | - | ||||
| बजेट खर्च (%) | ९८ | ४१,१८०,००० | ||||
| तालिका | ||||||
महत्वपूर्ण सम्पर्क
Sanibheri Rural Municipality
ठेगाना : सानीभेरी गाँउपालिका
टेलिफोन : ,
वेबसाइट : www.sanibherimun.gov.np
प्रमुख प्रशासकीय अधिकृत
नाम : दिपक बुढाथाेकी
सम्पर्क : ९८५७८२४२५३
ईमेल : budhathokidipak67@gmail.com

यो प्रोफाइल अमेरिकी अन्तर्राष्ट्रिय विकास नियोग (युएसएआइडी) मार्फत अमेरिकी जनताहरुको सहयोगका कारण सम्भव बनेको हो । यो प्रतिवेदन भित्रका विषयवस्तु र सामग्री स्वास्थ्यका लागि सक्षम प्रणालीका एकल जिम्मेवारी हुन् र तिनले युएसएआइडी वा अमेरिकी सरकारको विचारको प्रतिविम्बित गर्छन् भन्ने जरुरी छैन ।