
संक्षिप्त परिचय शान्तिनगर गाउँपालिका

शान्तिनगर गाउँपालिका लुम्विनी प्रदेशमा पर्ने दाङ जिल्लाको पश्चिमी उत्तरतर्फ पर्दछ । नेपालको मानचित्रमा ८२०७’५” देखि ८२०१५’३०” पूर्वी देशान्तर र २८०६’३५” देखि २८०१५’३०” उत्तरी अक्षांसमा अवस्थीत रहेको यस गाउँपालिकाको दक्षिण तिर दंगीशरण गाउँपालिका, पूर्वमा तुलसीपुर उप-महानगरपालिका तेस्तै उत्तरमा सल्यान जिल्ला र पश्चिममा बबई गाउँपालिका आवस्थित रहेको छ । कुल ११६.०२ वर्ग कि. मी मा फैलिएको शान्तिनगर गाउँपालिकाको २०६८ को राष्ट्रिय जनगणना अनुसार यस गाउँपालिकाको जनसंख्या २५,२०३ रहेको छ जसमा सबै भन्दा बढी १०,९१८ जना (४३.३२%) क्षेत्रि जाति को बसोबास रहेको छ । तेसै गरी दोस्रोमा थारु र तेस्रो मा मगर समुदायको बसोबास रहेको छ। जम्मा सात वडा रहेको यस गाउँपालिका साबिक बाघमारे, शान्तिनगर र धनौरी गा.वि.स को समाबेशबाट गठन भएको छ ।
जनसाङ्खिक सूचक
-
कूल जनसंख्या ७
२८,१६८
/ -
१ बर्ष भन्दा मुनिको जनसंख्या ७
४९६
/ -
पाँच बर्ष भन्दा मुनिको जनसंख्या ७
२,५१४
/ -
किशोरावस्था (१०-१९ बर्ष) को जनसंख्या ७
५,२८५
/ -
प्रजनन उमेरका महिला (१५ -४९ बर्ष ) ७
८,३४६
/ -
अनुमानित गर्भवती महिलाहरु ७
६३४
/ -
अनुमानित जिवित जन्मको संख्या ७
४९८
/ -
परिवारमा अनुपस्थित (विदेशमा बस्ने) जनसंख्या २
२,५७९
-
मोबाइल फोन भएका घरधुरी (%) २
६०
-
टेलिभिजन भएका घरधुरी (%) २
२१
-
लैङ्गिक अनुपात २
९५
-
१४ बर्ष र सो भन्दा कम उमेरका जनसंख्या ७
६,२९५
-
६५ बर्ष र सो भन्दा माथि उमेरका जनसंख्या २
१,२२२
उमेर र लिंगको आधारमा जनसंख्या वितरण
जनगणना २०६८जातिगत आधारमा जनसंख्या वितरण
जनगणना २०६८वार्ड अनुसार जनसंख्या वितरण
जनगणना २०६८स्वास्थ्य सेवा प्रवाह गर्ने संस्थाहरु
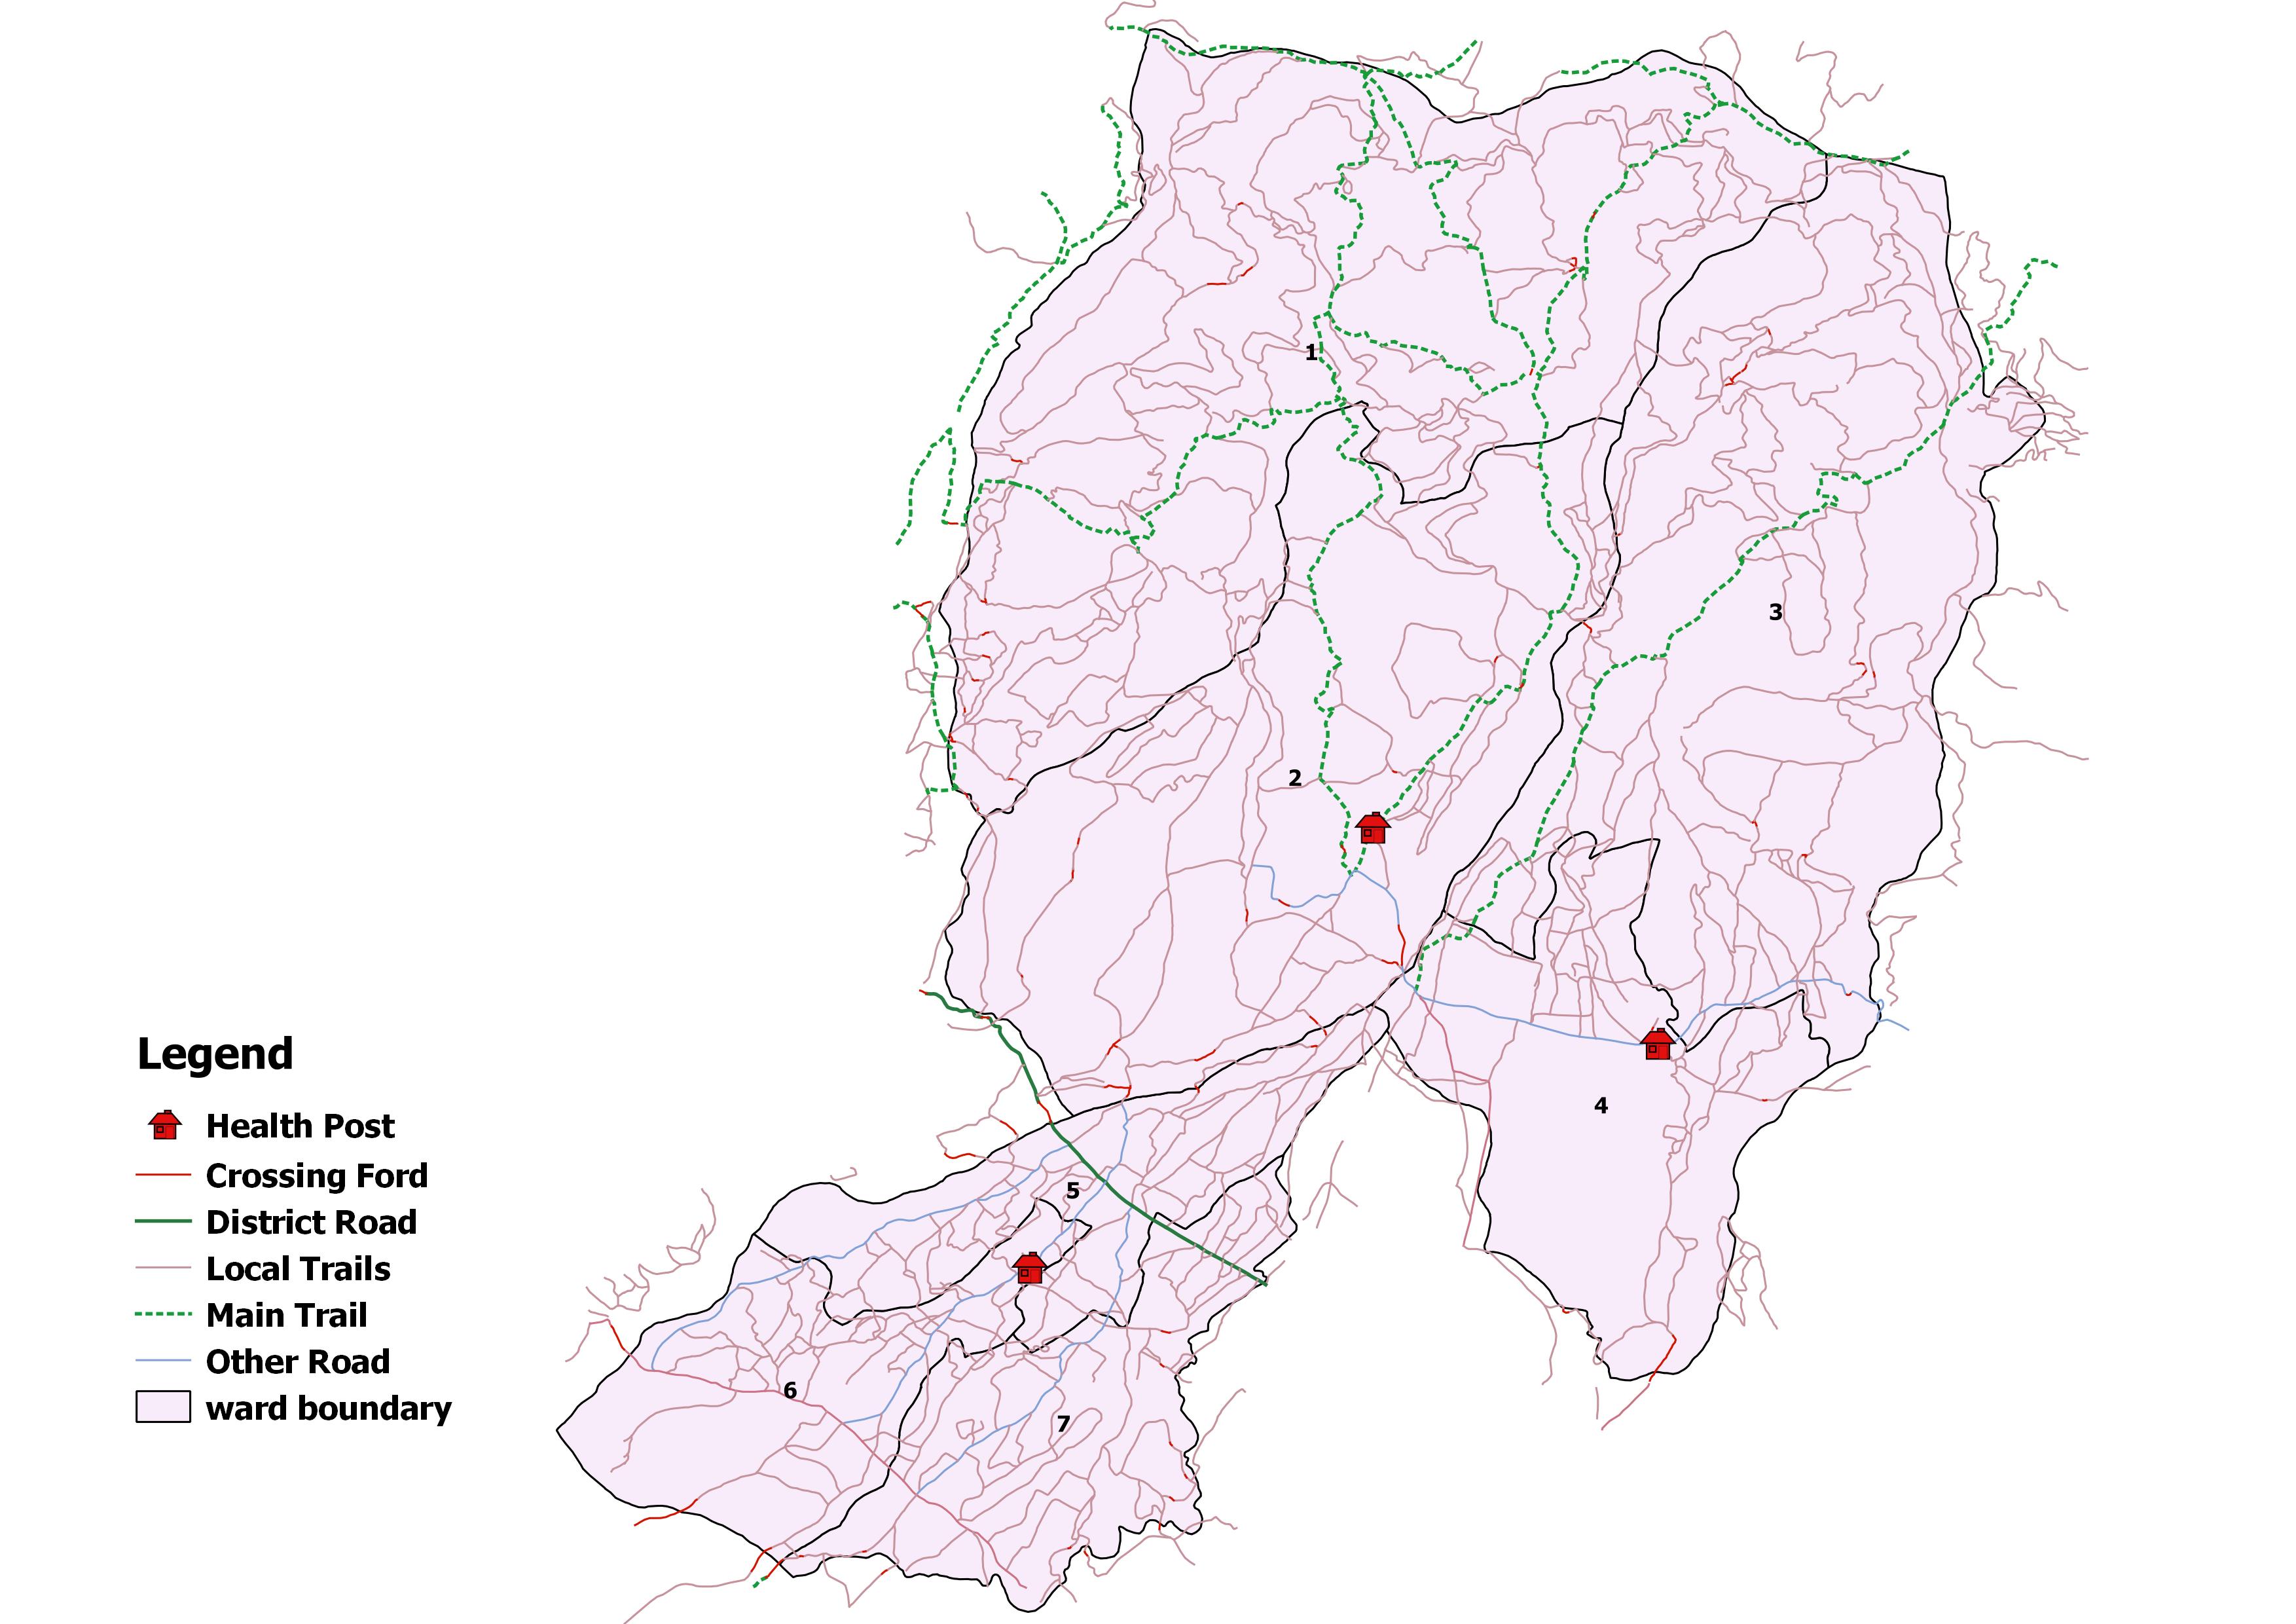
- अस्पताल -
- प्रास्वाके -
- स्वास्थ्य चौकी ३
- सामुदायिक स्वास्थ्य ईकाई -
- शहरी स्वास्थ्य केन्द्र -
- गाउँघर क्लिनिक ९
- खोप क्लिनिक १४
- आधारभूत स्वस्थ सेवाकेन्द्र ५
- बर्थिंग सेन्टर ३
सरकारी संस्था
- अस्पताल तथा नर्सिंग होम -
- पोलिक्लिनिक -
- औषधि पसल १६
निजी (गैर-सरकारी संस्था समेत)
अन्य स्वास्थ्य केन्द्रहरु
- माइक्रोस्कोपी केन्द्र ३
- एआरटि केन्द्र -
- एचाईभी परीक्षण केन्द्र -
- क्षयरोग उपचार केन्द्र ३
- आयुर्वेद अस्पताल/केन्द्र -
- आँखा अस्पताल/केन्द्र -
अस्पताल शैयाहरू
- सार्वजनिक -
- निजी -
वडा अनुसार स्वास्थ्य संस्थाको जानकारी
| स्वास्थ्यसंस्थाको नाम | वार्ड न | बर्थिंग सेन्टर BEONC/CEONC | महिला स्वास्थ्य स्वयं सेवक संख्या | दक्ष प्रसुतिकर्मी संख्या | परिवार नियोजन *सेवा | स्वीकृत दरबन्दी | दरबन्दी अनुसार पदपूर्ति | करारका कर्मचारी |
|---|---|---|---|---|---|---|---|---|
| शानतिनगर स्वास्थ्य चौकी | ४ | प्रसुती केन्द्र | १४ | ३ | ५ साधनहरू | ६ | ६ | ३ |
| बाघमारे स्वास्थ्य चौकी | २ | प्रसुती केन्द्र | १४ | २ | ५ साधनहरू | ६ | ६ | ४ |
| धनौरि स्वास्थ्य चौकी | ६ | प्रसुती केन्द्र | २० | ४ | ५ साधनहरू | ६ | ६ | २ |
| बसतिखोला आधारभुत स्वास्थ्य सेवा केन्द्र | ३ | - | - | ० | ३ साधनहरू | ३ | ३ | ३ |
| रगैचा आधारभुत स्वास्थ्य सेवा केन्द्र | ५ | - | - | ० | ३ साधनहरू | ३ | ३ | ३ |
| सानो-तुलसिपुर आधारभुत स्वास्थ्य सेवा केन्द्र | ७ | - | - | ० | ३ साधनहरू | ३ | ३ | २ |
| पेदिखोला सामुदायिक स्वास्थ्य सेवा इकाइ | १ | - | - | ० | ३ साधनहरू | ३ | ३ | ३ |
| नयाँ बस्तिअाधारभुत स्वास्थ्य सेवा केन्द्र | १ | - | - | ० | ३ साधनहरू | ३ | ३ | २ |
| कुल कर्मचारी संख्या | ४८ | ९ | ३३ | ३३ | २२ | |||
स्वास्थ्य सेवाको लागि मानव संसाधन
- CEONC साइटहरू-
- BEONC साइटहरू-
- आइयुसीडी तथा इम्पलान्ट सेवा प्रदायक४
- एकीकृत बालरोग व्यवस्थापन (IMCI) प्रशिक्षित कर्मचारी७
- जनसंख्या (प्रति मस्वास्वका) ५८७
- जनसंख्या (प्रति स्वास्थ्यकर्मी) ८५४
- अनुमानित गर्भवति (प्रति दक्ष प्रसुतिकर्मी) ७०
- अनुमानित गर्भवति (प्रति बर्थिङ्ग सेन्टर) २११
- जनसंख्या (प्रति स्वास्थ्य संस्था) (अस्पताल,प्रस्वाके र स्वाचौ सहित) -
- जनसंख्या (प्रति सरकारी अस्पताल) -
- जनसंख्या (प्रति अस्पताल र नर्सिंग होम (सबै) -
मातृशिशु बालस्वास्थ्य र परिवार नियोजन सेवा उपयोगको अवस्था
स्वास्थ्य सूचना व्यवस्थापन प्रणाली २०७८प्रमूख स्वास्थ्य सेवाहरूको उपयोगको तुलनात्मक अवस्था
| सूचक | शान्तिनगर गाउँपालिका | लुम्बिनी प्रदेश २०७८/७९ | राष्ट्रीय २०७८/७९ | |||
|---|---|---|---|---|---|---|
| २०७६/७७ | २०७७/७८ | २०७८/७९ | ||||
| खाेप |
ग्राफ
तालिका
|
|||||
| बि.सि.जि. कभरेज | ७० | ७०.७ | ८२.४ | १०३.१ | १०३.५ | |
| २३ महिनाभित्र पूर्ण खोप प्राप्त गरेका बालबालिका (%) | ० | ० | ० | ० | ० | |
| डि.पि.टि. - हेप बि - हिव ३ कभरेज | ७० | ८२ | ९६.६ | ९६.६ | ९५.२ | |
| दादुरा रूबेला १ (९-११ महिना) कभरेज | ७७ | ८२.८ | ९७ | ९६.७ | ९४.७ | |
| जे.इ कभरेज | ८१ | ७६ | ९९ | ९८.९ | ९५.९ | |
| टि.डी. २ र टि. डी. २+ कभरेज | ५५ | ४९.२ | ६८.८ | ७३.९ | ७१.७ | |
| पोषण |
ग्राफ
तालिका
|
|||||
| कम जन्म तौल भएका नवजात शिशुको प्रतिशत | ०.४६ | ०.६१ | ०.७७ | १२ | ९.४ | |
| नयाँ तौल लिएका १ वर्ष मुनिका शिशुहरुको प्रतिशत | ६३ | १०४.२ | ११० | १०९ | १०४.१ | |
| नयाँ तौल लिएका २ वर्ष मुनिका शिशुहरु मध्ये अति जोखिम अवस्थाका बालबालिकाहरुको प्रतिशत | ५ | ४.५ | १०६.४ | ३.५ | ३.६ | |
| गर्भवती अवस्थामा १८० दिन आइरन चक्की प्राप्त गरेका गर्भवती महिलाहरुको प्रतिशत | ४३ | ५४.१ | ७२.२ | ७५.८ | ६० | |
| सुत्केरी अवस्थामा भिटामिन ए प्राप्त गरेका महिलाहरुको प्रतिशत | १७ | २०.२ | १७.६ | ९८.२ | ७६.३ | |
| नवजात शिशु तथा बाल रोगको एकीकृत व्यस्थापन |
ग्राफ
तालिका
|
|||||
| नाभी मलम लगाएका नवजात शिशुको प्रतिशत | १०० | ८५.६ | ८९.२ | ९४.२ | ८२.९ | |
| ब्याक्टेरियाको गम्भीर संक्रमण भएकामध्ये जेन्टामाईसिन सुईद्वारा पूर्ण उपचार पाएको प्रतिशत | ० | ० | १४.८ | ३९.५ | ४७.४ | |
| नयाँ निमोनिया बिरामीको दर (प्रति हजार पाँच वर्षमुनिका बालबालिकाहरुमा) | ८४ | ३७ | ५३.८ | २९.३ | ३६.८ | |
| नयाँ एआरआई (स्वाशप्रश्वाका) बिरामी मध्ये कडा निमोनिया भएका बिरामीको प्रतिशत | ० | ० | ० | ०.०५ | ०.१८ | |
| नयाँ झाडापखालाका बिरामीको दर (प्रति हजार पाँच वर्ष मुनिका बालबालिकाहरुमा) | ४५४ | ५१८.८ | ६८५ | ३३९ | ३५२.४ | |
| ५ वर्ष मुनिका झाडापखालाका बिरामी मध्ये जिंक र पुनर्जलीय झोलबाट उपचार गरेको प्रतिशत | ९९.९ | ९९.३ | १०० | ९८.७ | ९४.५ | |
| जम्मा नवजात शिशु मृत्यु संख्या | ० | ० | १ | ५७३ | १९१४ | |
| सुरक्षित मातृत्व तथा परिवार नियोजन |
ग्राफ
तालिका
|
|||||
| प्परोटोकल अनुसार पहिलो पटक गर्भवती जाँच गराएका गर्भवती महिलाहरुको प्रतिशत | ८० | ६९ | ९७.५ | ९३.५ | ९१.४ | |
| प्रजनन् उमेरका महिलाहरुमा परिवार नियोजनको प्रयोगकर्ता दर (आधुनिक साधन) | ० | ० | ० | ० | ० | |
| ४ पटक गर्भवती जाँच (महिना: ४,६,८,९/हप्ता: १६, २०-२४,३२ र ३६) महिलाहरुको प्रतिशत | ४६ | ५५ | ७३.२ | ७९.७ | ७९.४ | |
| स्वास्थ्य संस्था प्रसुति दर | १५ | १६.७ | १६.२ | ९४.२ | ७९ | |
| दक्ष प्रसुतिकर्मी/स्वास्थ्यकर्मीद्वारा प्रसुति गराएको प्रतिशत | १५ | १६.७ | १६.२ | ८९.८ | ७५ | |
| प्रोटोकल अनुसार ४ पटक (आ.व २०७८/७९ सम्म ३ पटक) सुत्केरी जाँच गराउने आमाहरुको प्रतिशत | १५ | १५.७ | ५४.६ | ५३.७ | ४०.८ | |
| जम्मा मातृ मृत्यु संख्या | ० | ० | ० | ७४ | २३१ | |
| परिवार नियोजन सेवाका नयाँ सेवाग्राही दर (प्रजनन उमेरका महिलाहरु मध्ये) | १० | १०.९ | १५.५ | १२.४ | ११.५ | |
| औलो रोग, क्षय रोग, कुष्ठरोग र एचआईभी |
ग्राफ
तालिका
|
|||||
| औलोको स्लाइड नमुना पोजेटिभ दर | ०.५ | ० | ० | ०.२७ | ०.१७ | |
| डेंगुको जम्मा विरामी संख्या | ० | ० | ० | ० | ० | |
| आयातित औलोरोगको प्रतिशत (नयाँ औलो रोग मध्ये | ० | ० | ० | ९५.५ | ८९.५ | |
| जम्मा औलो रोग मध्ये प्लाज्मोडियम फाल्सिपारमको अनुपात | ० | ० | ० | ३८.७ | २२.८ | |
| नयाँ क्षयरोगी बिरामी पत्ता लागेको दर | १३९ | ११०.३ | १७६.७ | १५७.४ | १२९.१ | |
| क्षयरोगको उपचार सफलता दर | ८० | ९५ | ८७.९ | ९१ | ९१.५ | |
| कुष्ठरोगको रोग प्रकोप दर (प्रति १०००० मा) | ०.३४ | ०.६७ | ० | ०.९ | ० | |
| ए. आर. टी. उपचारमा रहेका जम्मा एच. आइ. भी. पोजेटिभको संख्या | ० | ० | ० | ४३२६ | २२१५२ | |
| उपचारात्मक सेवा |
ग्राफ
तालिका
|
|||||
| ओ पि डी मा आएका बिरामी मध्ये नयाँ बिरामीको दर | ६२ | ७४.१ | ८० | ९४.५ | ९२ | |
शीर्ष १० स्वास्थ्य अवस्थाको सूची
स्वास्थ्य सूचना व्यवस्थापन प्रणाली २०७८स्वास्थ्य क्षेत्रमा बजेट
- सशर्त स्वास्थ्यमा छुट्याएको बजेट
- समानीकरणबाट विनियोजित स्वास्थ्य बजेट
- अन्य श्रोतबाट बिनियोजित स्वास्थ्य बजेट
| बजेट | शान्तिनगर गाउँपालिका | |||||
|---|---|---|---|---|---|---|
| २०७६/७७ | २०७७/७८ | २०७८/७९ | ||||
| ग्राफ | ||||||
| पालिकाको कुल बजेट (रु ) | ३१९,७४८,००० | २८९,८००,००० | २८,८३४,५०० | |||
| स्वास्थ्य बजेट (सबै स्रोत) | १०,७६१,००० | २५,२४७,००० | २८,८३४,५०० | |||
| सशर्त स्वास्थ्यमा छुट्याएको बजेट | ६,७११,००० | २०,८००,००० | २३,९०३,००० | |||
| समानीकरणबाट विनियोजित स्वास्थ्य बजेट | ४,०५०,००० | ४,४४७,००० | ४,९३१,५०० | |||
| अन्य श्रोतबाट बिनियोजित स्वास्थ्य बजेट | ||||||
| बजेट खर्च (%) | ९५ | ८४ | - | |||
| तालिका | ||||||
महत्वपूर्ण सम्पर्क
Shantinagar Rural Municipality
ठेगाना : शान्तिनगर गाउँपालिका प्रदेश नं. ५ दाङ
टेलिफोन : ,
वेबसाइट : shantinagarmun.gov.np

यो प्रोफाइल अमेरिकी अन्तर्राष्ट्रिय विकास नियोग (युएसएआइडी) मार्फत अमेरिकी जनताहरुको सहयोगका कारण सम्भव बनेको हो । यो प्रतिवेदन भित्रका विषयवस्तु र सामग्री स्वास्थ्यका लागि सक्षम प्रणालीका एकल जिम्मेवारी हुन् र तिनले युएसएआइडी वा अमेरिकी सरकारको विचारको प्रतिविम्बित गर्छन् भन्ने जरुरी छैन ।