संक्षिप्त परिचय शिवालय गाउँपालिका
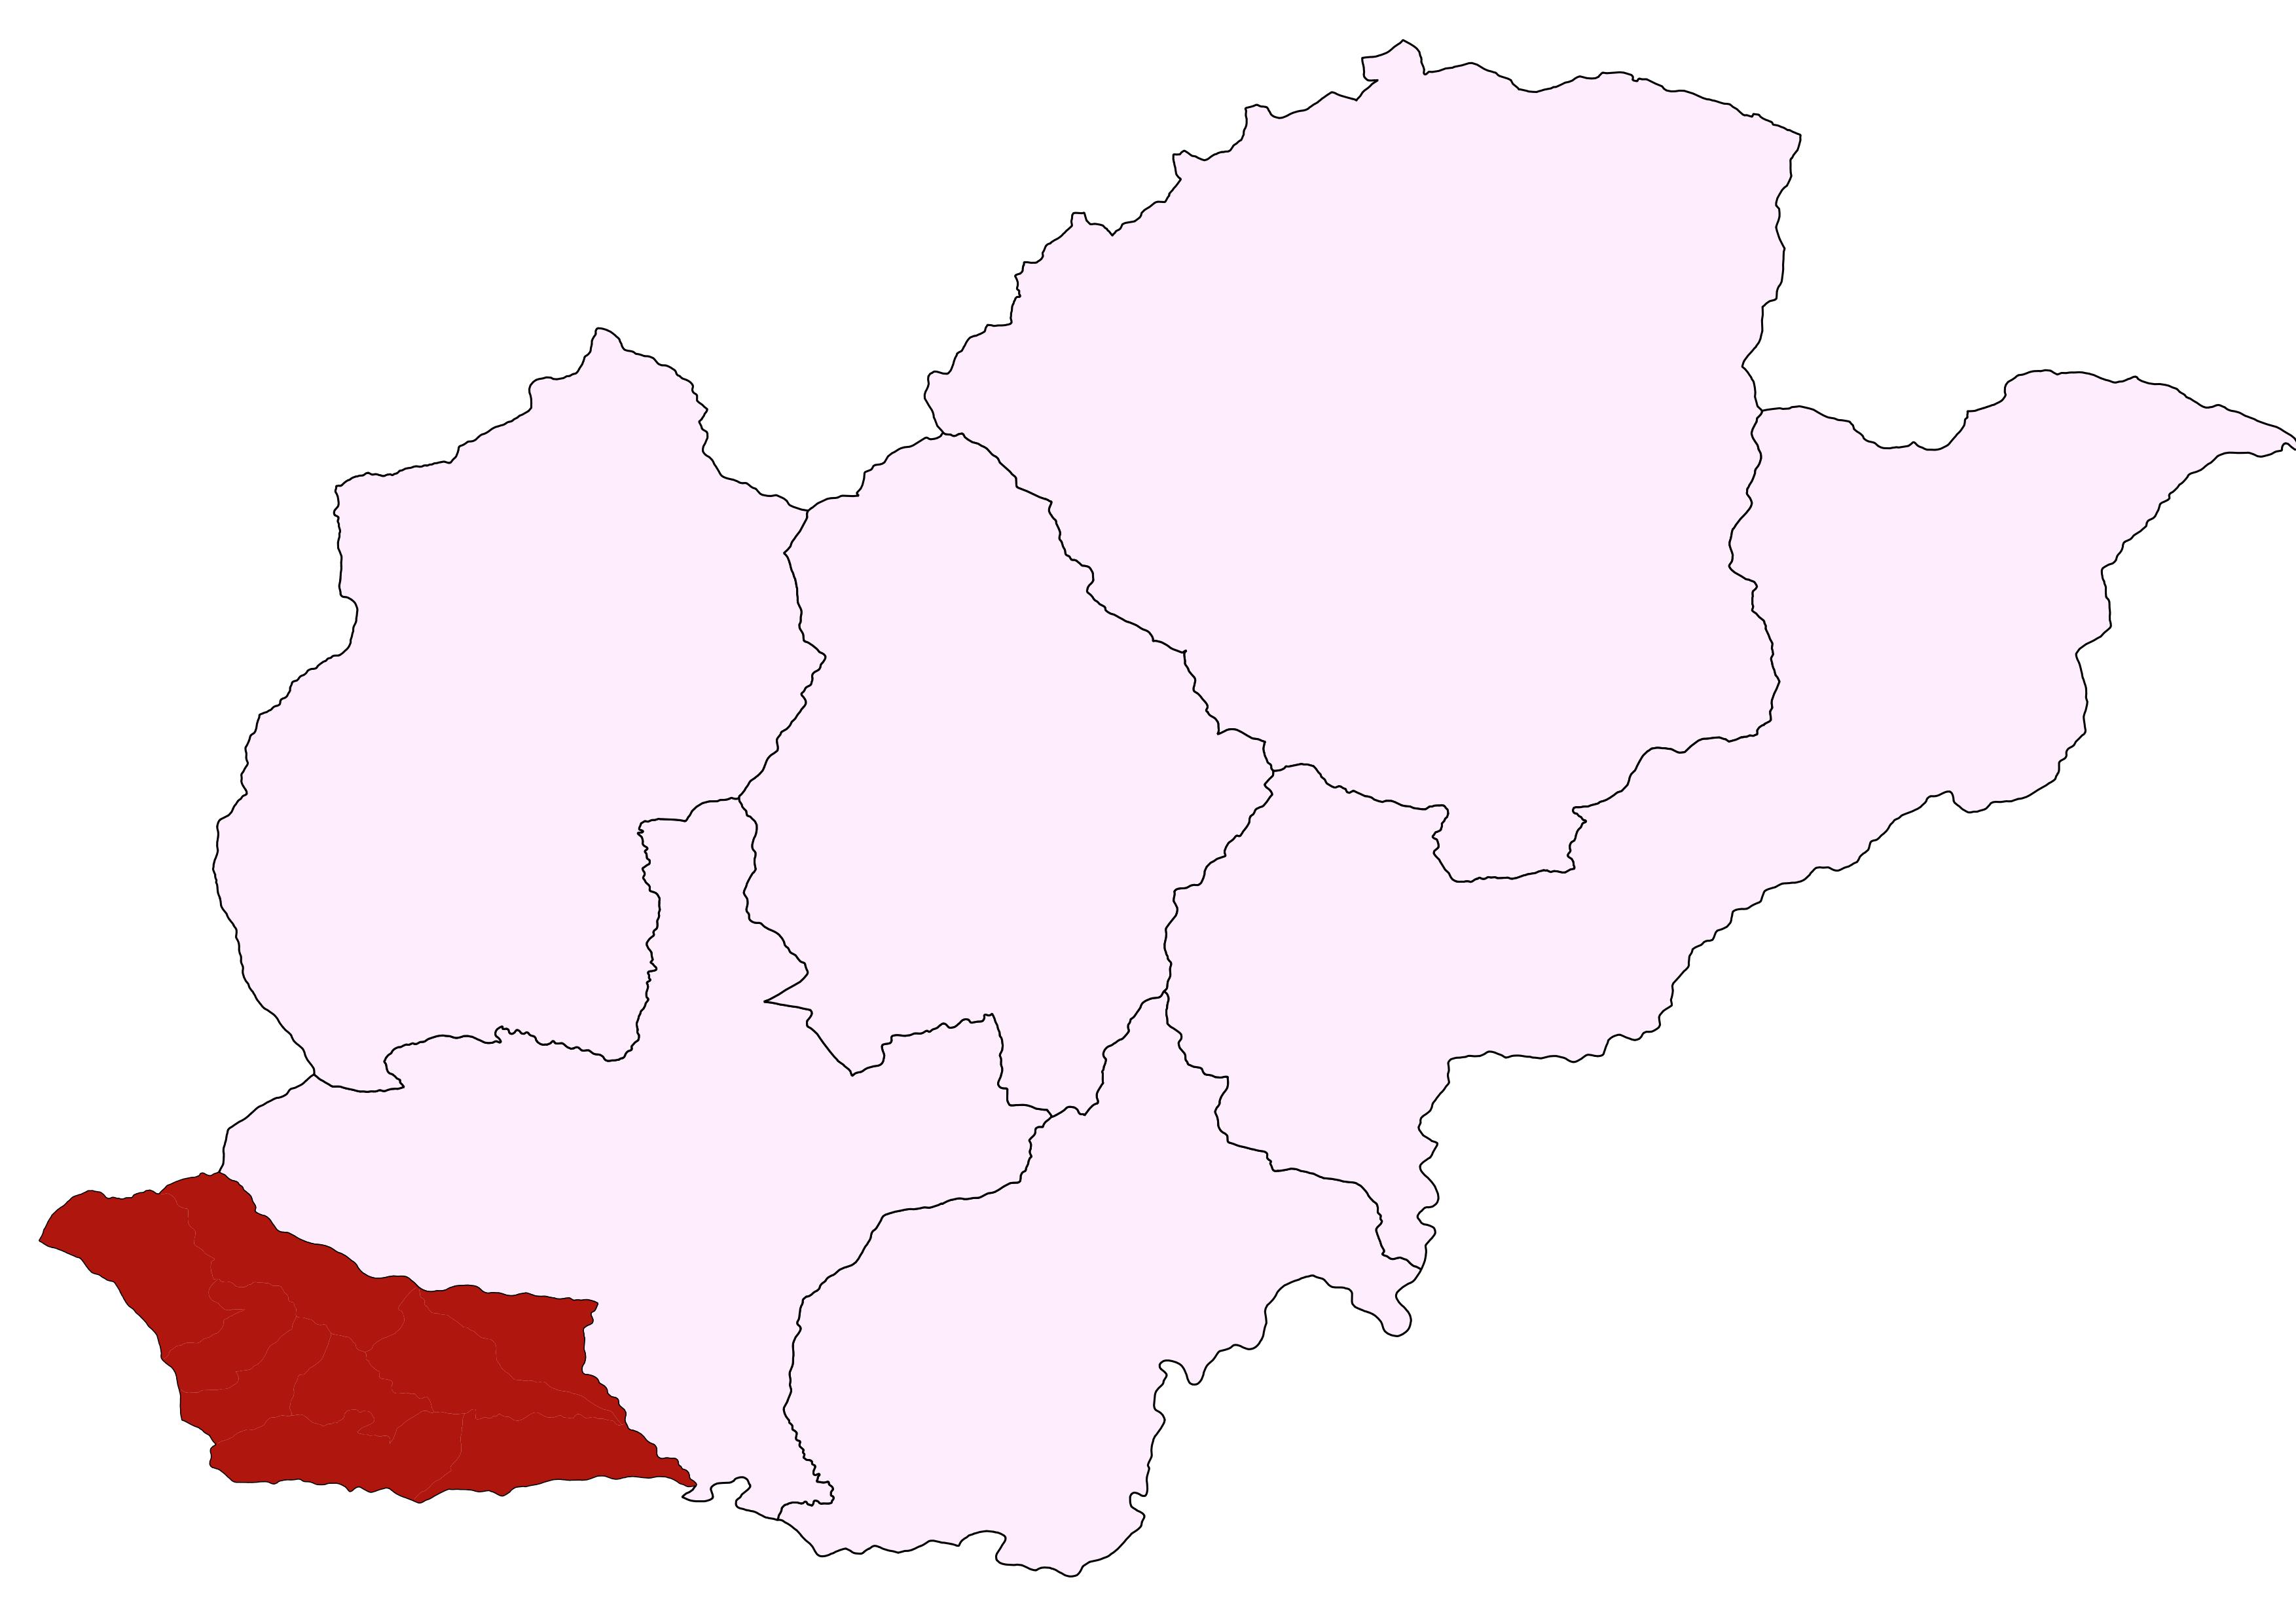
शिवालय गाउँ पालिका जाजरकोट जिल्लाको पश्चिमी भागमा रहेको गाउँ पालिका हो । यस गाउपालिकाको कुल क्षेत्रफल १३४.२६ वर्ग किलोमिटर (५१.84 वर्ग मील) छ र कुल जनसंख्या २०११ को जनगणना अनुसार १५२६९ छ। यो गाउपालिकाको कुल ९ वटा वडामा विभाजित छ भने यस गाउपालिकाको केन्द्र सिमामा रहेको छ । यस गाउपालिका अन्तर्गत सिमा, जुगेथापाचौर, थालारैकर गरि ३ वटा स्वास्थ्य चौकी रहेका छन् भने बर्थिंग सेन्टर सीमा स्वास्थ्य चौकी मा मात्र संचालमा छ ।
जनसाङ्खिक सूचक
-
कूल जनसंख्या १
१५,००५
/ -
१ बर्ष भन्दा मुनिको जनसंख्या १
३०७
/ -
पाँच बर्ष भन्दा मुनिको जनसंख्या १
१,८३६
/ -
किशोरावस्था (१०-१९ बर्ष) को जनसंख्या १
३,७९६
/ -
प्रजनन उमेरका महिला (१५ -४९ बर्ष ) १
३,१०६
/ -
अनुमानित गर्भवती महिलाहरु १
४४५
/ -
अनुमानित जिवित जन्मको संख्या १
३५०
/ -
परिवारमा अनुपस्थित (विदेशमा बस्ने) जनसंख्या २
२,२३६
-
मोबाइल फोन भएका घरधुरी (%) २
८८
-
टेलिभिजन भएका घरधुरी (%) २
२
-
लैङ्गिक अनुपात २
९८
-
१४ बर्ष र सो भन्दा कम उमेरका जनसंख्या २
५,४७४
-
६५ बर्ष र सो भन्दा माथि उमेरका जनसंख्या २
७१९
उमेर र लिंगको आधारमा जनसंख्या वितरण
जनगणना २०७८जातिगत आधारमा जनसंख्या वितरण
जनगणना २०७८वार्ड अनुसार जनसंख्या वितरण
जनगणना २०७८स्वास्थ्य सेवा प्रवाह गर्ने संस्थाहरु

- अस्पताल -
- प्रास्वाके -
- स्वास्थ्य चौकी ३
- सामुदायिक स्वास्थ्य ईकाई -
- शहरी स्वास्थ्य केन्द्र -
- गाउँघर क्लिनिक -
- खोप क्लिनिक १५
- आधारभूत स्वस्थ सेवाकेन्द्र ६
- बर्थिंग सेन्टर २
सरकारी संस्था
- अस्पताल तथा नर्सिंग होम -
- पोलिक्लिनिक -
- औषधि पसल ५
निजी (गैर-सरकारी संस्था समेत)
अन्य स्वास्थ्य केन्द्रहरु
- माइक्रोस्कोपी केन्द्र -
- एआरटि केन्द्र -
- एचाईभी परीक्षण केन्द्र -
- क्षयरोग उपचार केन्द्र ३
- आयुर्वेद अस्पताल/केन्द्र १
- आँखा अस्पताल/केन्द्र -
अस्पताल शैयाहरू
- सार्वजनिक -
- निजी -
वडा अनुसार स्वास्थ्य संस्थाको जानकारी
| स्वास्थ्यसंस्थाको नाम | वार्ड न | बर्थिंग सेन्टर BEONC/CEONC | महिला स्वास्थ्य स्वयं सेवक संख्या | दक्ष प्रसुतिकर्मी संख्या | परिवार नियोजन *सेवा | स्वीकृत दरबन्दी | दरबन्दी अनुसार पदपूर्ति | करारका कर्मचारी |
|---|---|---|---|---|---|---|---|---|
| सिमा स्वास्थ्य चौकी | ३ | बर्थिंग सेन्टर | ३ | २ | ४ साधनहरू | ५ | ३ | २ |
| थालारैकर स्वास्थ्य चौकी | ५ | बर्थिंग सेन्टर | ४ | १ | ३ साधनहरू | ५ | ४ | १ |
| जुगेथापाचौर स्वास्थ्य चौकी | ७ | - | ४ | ० | ३ साधनहरू | ५ | २ | २ |
| आयुर्बेद औशधालय | ७ | - | ० | ० | ० साधनहरू | २ | १ | ० |
| काफलगैरी आधारभूत स्वास्थ्य सेवा केन्द्र | १ | - | ४ | ० | ३ साधनहरू | २ | ० | २ |
| धुर्बेगैरा आधारभूत स्वास्थ्य सेवा केन्द्र | २ | - | ३ | ० | ३ साधनहरू | २ | ० | २ |
| टाटा आधारभूत स्वास्थ्य सेवा केन्द्र | ४ | - | ३ | १ | ३ साधनहरू | २ | ० | २ |
| टुनीबगर आधारभूत स्वास्थ्य सेवा केन्द्र | ६ | - | २ | ० | ३ साधनहरू | २ | ० | २ |
| पोखरे आधारभूत स्वास्थ्य सेवा केन्द्र | ८ | - | ३ | ० | ३ साधनहरू | २ | ० | २ |
| नहडा आधारभूत स्वास्थ्य सेवा केन्द्र | ९ | - | ३ | ० | ३ साधनहरू | २ | ० | २ |
| कुल कर्मचारी संख्या | २९ | ४ | २९ | १० | १७ | |||
स्वास्थ्य सेवाको लागि मानव संसाधन
- CEONC साइटहरू-
- BEONC साइटहरू-
- आइयुसीडी तथा इम्पलान्ट सेवा प्रदायक१
- एकीकृत बालरोग व्यवस्थापन (IMCI) प्रशिक्षित कर्मचारी५
- जनसंख्या (प्रति मस्वास्वका) ५१७
- जनसंख्या (प्रति स्वास्थ्यकर्मी) १५०१
- अनुमानित गर्भवति (प्रति दक्ष प्रसुतिकर्मी) १११
- अनुमानित गर्भवति (प्रति बर्थिङ्ग सेन्टर) २२३
- जनसंख्या (प्रति स्वास्थ्य संस्था) (अस्पताल,प्रस्वाके र स्वाचौ सहित) -
- जनसंख्या (प्रति सरकारी अस्पताल) -
- जनसंख्या (प्रति अस्पताल र नर्सिंग होम (सबै) -
मातृशिशु बालस्वास्थ्य र परिवार नियोजन सेवा उपयोगको अवस्था
स्वास्थ्य सूचना व्यवस्थापन प्रणाली २०७९प्रमूख स्वास्थ्य सेवाहरूको उपयोगको तुलनात्मक अवस्था
| सूचक | शिवालय गाउँपालिका | कर्णाली प्रदेश २०७८/७९ | राष्ट्रीय २०७८/७९ | |||
|---|---|---|---|---|---|---|
| २०७६/७७ | २०७७/७८ | २०७८/७९ | ||||
| खाेप |
ग्राफ
तालिका
|
|||||
| बि.सि.जि. कभरेज | ७६.७ | १०७.४ | ६९.६ | ९२ | १०३.५ | |
| २३ महिनाभित्र पूर्ण खोप प्राप्त गरेका बालबालिका (%) | ० | ० | ० | ० | ० | |
| डि.पि.टि. - हेप बि - हिव ३ कभरेज | ९१.२ | ८३.२ | ७९.८ | ९४ | ९५.२ | |
| दादुरा रूबेला १ (९-११ महिना) कभरेज | ८२.४ | ८२.१ | ८२.३ | ९५ | ९४.७ | |
| जे.इ कभरेज | ९५.९ | ७३.७ | ८२.१ | ९६ | ९५.९ | |
| टि.डी. २ र टि. डी. २+ कभरेज | ६५.९ | ४५.१ | ४७.७ | ६६ | ७१.७ | |
| पोषण |
ग्राफ
तालिका
|
|||||
| कम जन्म तौल भएका नवजात शिशुको प्रतिशत | १.१ | ०.५५ | ० | ६.८ | ९.४ | |
| नयाँ तौल लिएका १ वर्ष मुनिका शिशुहरुको प्रतिशत | १४७.४ | १३४.४ | ९७.८ | १२० | १०४.१ | |
| नयाँ तौल लिएका २ वर्ष मुनिका शिशुहरु मध्ये अति जोखिम अवस्थाका बालबालिकाहरुको प्रतिशत | ०.७ | ०.२ | ०.३ | ४.१ | ३.६ | |
| गर्भवती अवस्थामा १८० दिन आइरन चक्की प्राप्त गरेका गर्भवती महिलाहरुको प्रतिशत | २३.४ | ३५.३ | २९.५ | ७३ | ६० | |
| सुत्केरी अवस्थामा भिटामिन ए प्राप्त गरेका महिलाहरुको प्रतिशत | ७२.७ | ७०.५ | ७१.६ | ८८ | ७६.३ | |
| नवजात शिशु तथा बाल रोगको एकीकृत व्यस्थापन |
ग्राफ
तालिका
|
|||||
| नाभी मलम लगाएका नवजात शिशुको प्रतिशत | ९६.२ | ७९.९ | ४५ | ९६ | ८२.९ | |
| ब्याक्टेरियाको गम्भीर संक्रमण भएकामध्ये जेन्टामाईसिन सुईद्वारा पूर्ण उपचार पाएको प्रतिशत | २५ | ५० | ० | ७५ | ४७.४ | |
| नयाँ निमोनिया बिरामीको दर (प्रति हजार पाँच वर्षमुनिका बालबालिकाहरुमा) | ४६.४ | ७३.५ | ६५.२ | ११३ | ३६.८ | |
| नयाँ एआरआई (स्वाशप्रश्वाका) बिरामी मध्ये कडा निमोनिया भएका बिरामीको प्रतिशत | ० | ० | ० | ०.४१ | ०.१८ | |
| नयाँ झाडापखालाका बिरामीको दर (प्रति हजार पाँच वर्ष मुनिका बालबालिकाहरुमा) | ३३०.६ | २८१.४ | २७२.२ | ५७९ | ३५२.४ | |
| ५ वर्ष मुनिका झाडापखालाका बिरामी मध्ये जिंक र पुनर्जलीय झोलबाट उपचार गरेको प्रतिशत | १०० | ९९.६ | १०० | ९५ | ९४.५ | |
| जम्मा नवजात शिशु मृत्यु संख्या | १ | १ | १ | १९९ | १९१४ | |
| सुरक्षित मातृत्व तथा परिवार नियोजन |
ग्राफ
तालिका
|
|||||
| प्परोटोकल अनुसार पहिलो पटक गर्भवती जाँच गराएका गर्भवती महिलाहरुको प्रतिशत | ३३.१ | ५५.६ | ३९.३ | १२२ | ९१.४ | |
| प्रजनन् उमेरका महिलाहरुमा परिवार नियोजनको प्रयोगकर्ता दर (आधुनिक साधन) | ० | ० | ० | ० | ० | |
| ४ पटक गर्भवती जाँच (महिना: ४,६,८,९/हप्ता: १६, २०-२४,३२ र ३६) महिलाहरुको प्रतिशत | २५.६ | ४४.१ | ३१.४ | ७३ | ७९.४ | |
| स्वास्थ्य संस्था प्रसुति दर | ७.७ | १४.९ | १७.३ | ८३ | ७९ | |
| दक्ष प्रसुतिकर्मी/स्वास्थ्यकर्मीद्वारा प्रसुति गराएको प्रतिशत | ६.६ | ११.८ | १४.५ | ७० | ७५ | |
| प्रोटोकल अनुसार ४ पटक (आ.व २०७८/७९ सम्म ३ पटक) सुत्केरी जाँच गराउने आमाहरुको प्रतिशत | ४.४ | १.१ | ८.४ | ५३ | ४०.८ | |
| जम्मा मातृ मृत्यु संख्या | ० | ० | ० | १७ | २३१ | |
| परिवार नियोजन सेवाका नयाँ सेवाग्राही दर (प्रजनन उमेरका महिलाहरु मध्ये) | १०.१ | १६ | १६.५ | १९ | ११.५ | |
| औलो रोग, क्षय रोग, कुष्ठरोग र एचआईभी |
ग्राफ
तालिका
|
|||||
| औलोको स्लाइड नमुना पोजेटिभ दर | ० | ० | ० | ०.२५ | ०.१७ | |
| डेंगुको जम्मा विरामी संख्या | ० | ० | ० | ० | ० | |
| आयातित औलोरोगको प्रतिशत (नयाँ औलो रोग मध्ये | ० | ० | ० | ६३ | ८९.५ | |
| जम्मा औलो रोग मध्ये प्लाज्मोडियम फाल्सिपारमको अनुपात | ० | ० | ० | २.१ | २२.८ | |
| नयाँ क्षयरोगी बिरामी पत्ता लागेको दर | २८.४ | ५.६ | २७.१ | ९७ | १२९.१ | |
| क्षयरोगको उपचार सफलता दर | ५० | १०० | ० | ९१ | ९१.५ | |
| कुष्ठरोगको रोग प्रकोप दर (प्रति १०००० मा) | ० | ० | ० | ०.५ | ० | |
| ए. आर. टी. उपचारमा रहेका जम्मा एच. आइ. भी. पोजेटिभको संख्या | ० | ० | ० | ६९१ | २२१५२ | |
| उपचारात्मक सेवा |
ग्राफ
तालिका
|
|||||
| ओ पि डी मा आएका बिरामी मध्ये नयाँ बिरामीको दर | ४६ | ५८.८ | ५७.१ | १०५ | ९२ | |
शीर्ष १० स्वास्थ्य अवस्थाको सूची
स्वास्थ्य सूचना व्यवस्थापन प्रणाली २०७९८०स्वास्थ्य क्षेत्रमा बजेट
- सशर्त स्वास्थ्यमा छुट्याएको बजेट
- समानीकरणबाट विनियोजित स्वास्थ्य बजेट
- अन्य श्रोतबाट बिनियोजित स्वास्थ्य बजेट
| बजेट | शिवालय गाउँपालिका | |||||
|---|---|---|---|---|---|---|
| २०७८/७९ | २०७९/८० | २०८०/८१ | ||||
| ग्राफ | ||||||
| पालिकाको कुल बजेट (रु ) | ३८६,९७६,२९५ | ४९०,७०९,९७१ | ४६६,५८२,८०० | |||
| स्वास्थ्य बजेट (सबै स्रोत) | ४४,१००,००० | २४,२५६,००० | ४८,४९५,००० | |||
| सशर्त स्वास्थ्यमा छुट्याएको बजेट | ३९,१००,००० | २४,२५६,००० | ४८,४९५,००० | |||
| समानीकरणबाट विनियोजित स्वास्थ्य बजेट | ५,०००,००० | |||||
| अन्य श्रोतबाट बिनियोजित स्वास्थ्य बजेट | ||||||
| बजेट खर्च (%) | ७२ | ९४ | - | |||
| तालिका | ||||||
महत्वपूर्ण सम्पर्क
Shivalaya Rural Municipality
ठेगाना : शिवालय गाउँपालिका
टेलिफोन : ९८५८०५०८०८९७५८००२३७८
वेबसाइट : http://shibalayamun.gov.np/
सूचना प्रविधि अधिकृत
नाम : हरि घर्ती मगर
सम्पर्क : ९८५११३८५२०,९७४८६६३८२८
ईमेल : magarharee54@gmail.com

यो प्रोफाइल अमेरिकी अन्तर्राष्ट्रिय विकास नियोग (युएसएआइडी) मार्फत अमेरिकी जनताहरुको सहयोगका कारण सम्भव बनेको हो । यो प्रतिवेदन भित्रका विषयवस्तु र सामग्री स्वास्थ्यका लागि सक्षम प्रणालीका एकल जिम्मेवारी हुन् र तिनले युएसएआइडी वा अमेरिकी सरकारको विचारको प्रतिविम्बित गर्छन् भन्ने जरुरी छैन ।