संक्षिप्त परिचय सिम्ता गाउँपालिका

सिम्ता गाउँपालिका सुर्खेत जिल्लाको उत्तर पूर्वी भागमा रहेको गाउँपालिका हो । नेपालको संघीय शासन प्रणालीअन्तर्गत राज्य पुनरसंरचनामा स्थानीय तहको नयाँ सिमांकन गर्दा यो गाउँपालिका साबिकका ८ वटा गाबिस घोरेटा¸काफलकोट¸आग्रिगाउँ¸बजेदिचौर¸राकम¸काप्रिचौर¸डाँडाखाली र खानीखोला मिलेर स्थापना भएको हो ।गाउँपालिकाको पुर्वमा सल्यान जिल्ला पश्चिममा सुर्खेत जिल्लाकै चिङ्गाड गाउँपालिका उत्तरमा जाजरकोट जिल्ला र दक्षिणमा सुर्खेत जिल्लाकै गुर्वाकोट गाउँपालिका पर्दछ। यस गाउँपालिकाको कुल चेत्रफल २२९१५ हेक्टर रहेको छ। मुख्य रुपमा छेत्री त्यसपछि क्रमश कामी, ठकुरी, दमाई, बाहुन, मगर, सार्की र सन्यासी जातीको बसोबासरहेको छ।छेत्रफलको हिसाबले यो गाउँपालिका सुर्खेत जिल्लाको ९ वटा स्थानीय तह मध्ये चौथो सानो गाउँपालिका हो ।
जनसाङ्खिक सूचक
-
कूल जनसंख्या १
२३,३३२
/ -
१ बर्ष भन्दा मुनिको जनसंख्या १
४१४
/ -
पाँच बर्ष भन्दा मुनिको जनसंख्या १
२,०१७
/ -
किशोरावस्था (१०-१९ बर्ष) को जनसंख्या १
४,४९३
/ -
प्रजनन उमेरका महिला (१५ -४९ बर्ष ) १
६,३३८
/ -
अनुमानित गर्भवती महिलाहरु १
५२२
/ -
अनुमानित जिवित जन्मको संख्या १
४१६
/ -
परिवारमा अनुपस्थित (विदेशमा बस्ने) जनसंख्या २
३,८४४
-
मोबाइल फोन भएका घरधुरी (%) २
४,७६०
-
टेलिभिजन भएका घरधुरी (%) २
५५९
-
लैङ्गिक अनुपात २
७९
-
१४ बर्ष र सो भन्दा कम उमेरका जनसंख्या १
६,३२३
/ -
६५ बर्ष र सो भन्दा माथि उमेरका जनसंख्या २
१,६१७
उमेर र लिंगको आधारमा जनसंख्या वितरण
जनगणना २०७८जातिगत आधारमा जनसंख्या वितरण
जनगणना २०७८वार्ड अनुसार जनसंख्या वितरण
जनगणना २०७८स्वास्थ्य सेवा प्रवाह गर्ने संस्थाहरु
- अस्पताल -
- प्रास्वाके -
- स्वास्थ्य चौकी ८
- सामुदायिक स्वास्थ्य ईकाई ४
- शहरी स्वास्थ्य केन्द्र -
- गाउँघर क्लिनिक २१
- खोप क्लिनिक २८
- आधारभूत स्वस्थ सेवाकेन्द्र १
- बर्थिंग सेन्टर ९
सरकारी संस्था
- अस्पताल तथा नर्सिंग होम -
- पोलिक्लिनिक १
- औषधि पसल ७
निजी (गैर-सरकारी संस्था समेत)
अन्य स्वास्थ्य केन्द्रहरु
- माइक्रोस्कोपी केन्द्र १
- एआरटि केन्द्र -
- एचाईभी परीक्षण केन्द्र -
- क्षयरोग उपचार केन्द्र ९
- आयुर्वेद अस्पताल/केन्द्र १
- आँखा अस्पताल/केन्द्र १
अस्पताल शैयाहरू
- सार्वजनिक -
- निजी -
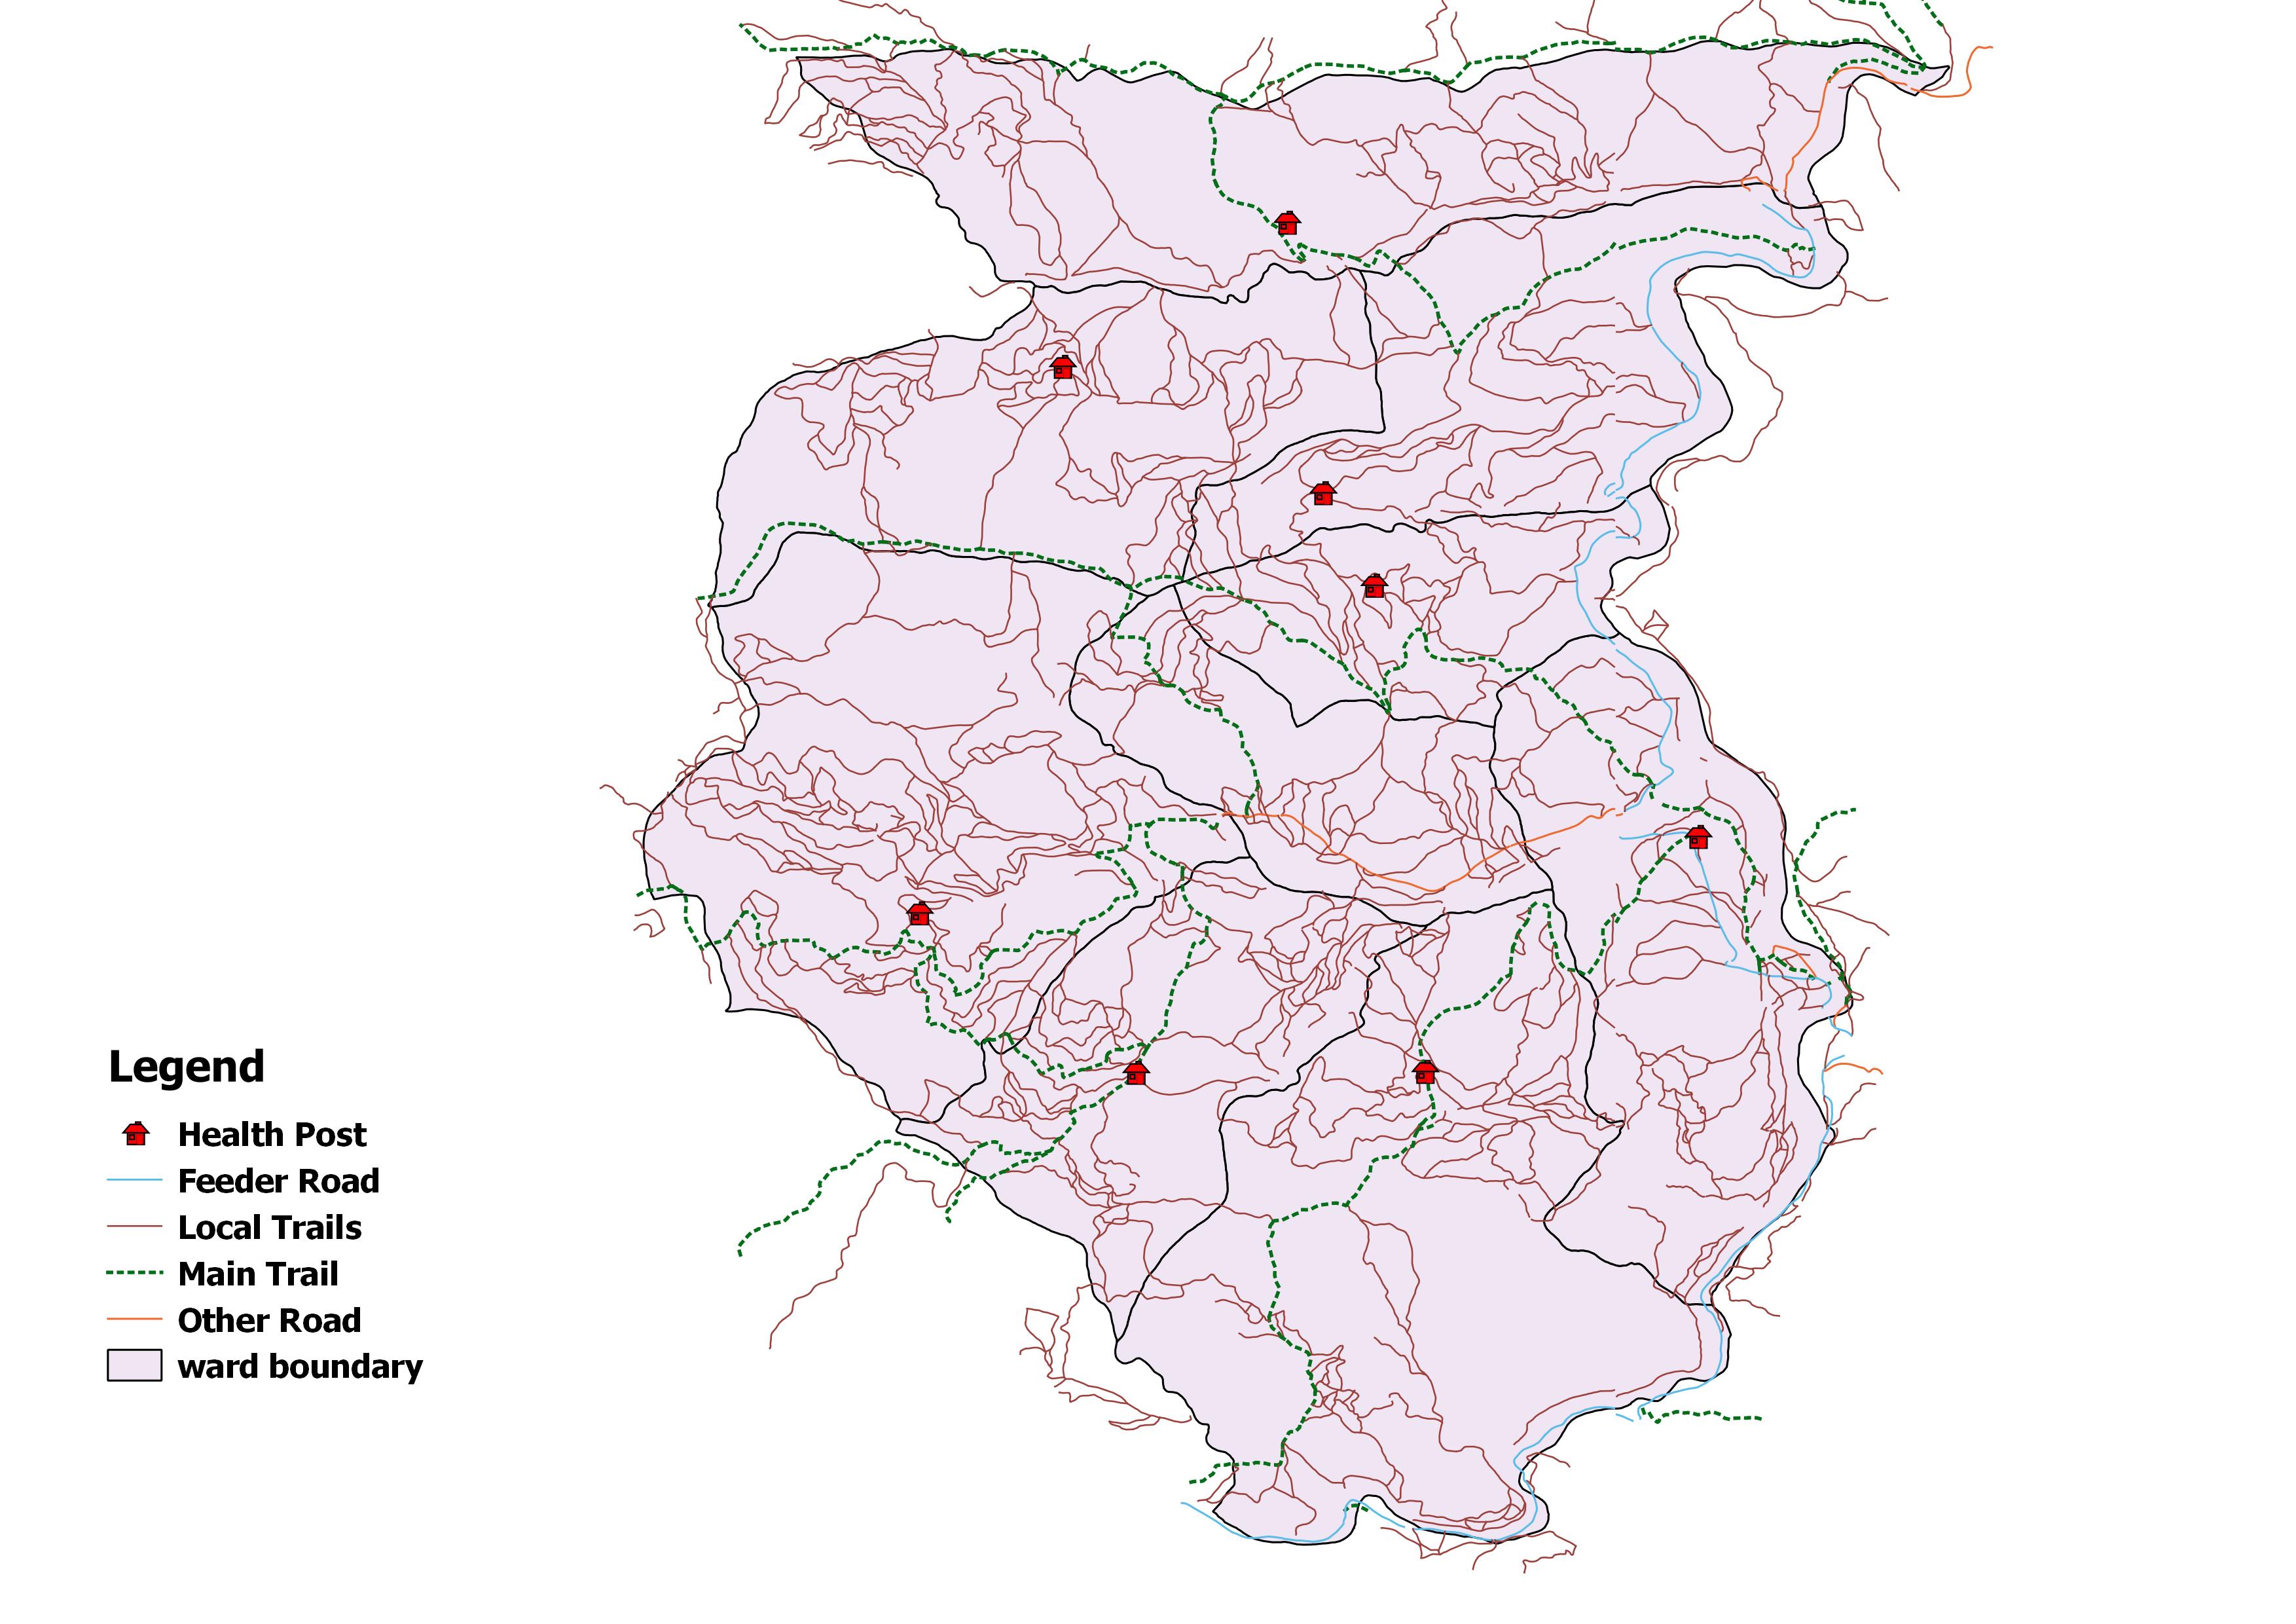
वडा अनुसार स्वास्थ्य संस्थाको जानकारी
| स्वास्थ्यसंस्थाको नाम | वार्ड न | बर्थिंग सेन्टर BEONC/CEONC | महिला स्वास्थ्य स्वयं सेवक संख्या | दक्ष प्रसुतिकर्मी संख्या | परिवार नियोजन *सेवा | स्वीकृत दरबन्दी | दरबन्दी अनुसार पदपूर्ति | करारका कर्मचारी |
|---|---|---|---|---|---|---|---|---|
| घोरेटा स्वास्थ्य चौकी | १ | बर्थिंग सेन्टर | ९ | ० | ५ साधनहरू | ५ | २ | १ |
| काफलकोट स्वास्थ्य चौकी | २ | बर्थिंग सेन्टर | १२ | १ | ५ साधनहरू | ५ | ५ | २ |
| आग्रिगाउँ स्वास्थ्य चौकी | ३ | बर्थिंग सेन्टर | ११ | १ | ५ साधनहरू | ५ | ३ | ५ |
| बजेडिचौर स्वास्थ्य चौकी | ४ | बर्थिंग सेन्टर | ९ | १ | ५ साधनहरू | ५ | ५ | ४ |
| राकम स्वास्थ्य चौकी | ६ | बर्थिंग सेन्टर | १२ | ३ | ५ साधनहरू | ५ | ५ | ५ |
| काप्रिचौर स्वास्थ्य चौकी | ७ | बर्थिंग सेन्टर | ११ | २ | ५ साधनहरू | ५ | ५ | ३ |
| डाँडाखली स्वास्थ्य चौकी | ८ | बर्थिंग सेन्टर | १२ | १ | ५ साधनहरू | ५ | ५ | २ |
| खानिखोला स्वास्थ्य चौकी | ९ | बर्थिंग सेन्टर | १६ | १ | ५ साधनहरू | ५ | ५ | २ |
| खनेटा सामुदायिक स्वास्थ्य इकाइ | १ | बर्थिंग सेन्टर | ० | ० | ३ साधनहरू | ० | ० | ५ |
| द्रुपला सामुदायिक स्वास्थ्य इकाइ | २ | - | ० | ० | ३ साधनहरू | ० | ० | ३ |
| बाँखर्क सामुदायिक स्वास्थ्य इकाइ | ३ | - | ० | ० | ३ साधनहरू | ० | ० | ३ |
| आधारभुत स्वास्थ्य सेवा केन्द्र आली | ५ | - | ६ | ० | ३ साधनहरू | ० | ० | ४ |
| बैसपानी सामुदायिक स्वास्थ्य इकाइ | ७ | - | ० | ० | ३ साधनहरू | ० | ० | ३ |
| सिम्ता गाउँपालिका स्वास्थ्य शाखा | ६ | - | ० | ० | ० साधनहरू | २ | २ | २ |
| कुल कर्मचारी संख्या | ९८ | १० | ४२ | ३७ | ४४ | |||
स्वास्थ्य सेवाको लागि मानव संसाधन
- CEONC साइटहरू-
- BEONC साइटहरू-
- आइयुसीडी तथा इम्पलान्ट सेवा प्रदायक८
- एकीकृत बालरोग व्यवस्थापन (IMCI) प्रशिक्षित कर्मचारी३९
- जनसंख्या (प्रति मस्वास्वका) २३८
- जनसंख्या (प्रति स्वास्थ्यकर्मी) ६३१
- अनुमानित गर्भवति (प्रति दक्ष प्रसुतिकर्मी) ५२
- अनुमानित गर्भवति (प्रति बर्थिङ्ग सेन्टर) ५८
- जनसंख्या (प्रति स्वास्थ्य संस्था) (अस्पताल,प्रस्वाके र स्वाचौ सहित) -
- जनसंख्या (प्रति सरकारी अस्पताल) -
- जनसंख्या (प्रति अस्पताल र नर्सिंग होम (सबै) -
मातृशिशु बालस्वास्थ्य र परिवार नियोजन सेवा उपयोगको अवस्था
स्वास्थ्य सूचना व्यवस्थापन प्रणाली २०८१प्रमूख स्वास्थ्य सेवाहरूको उपयोगको तुलनात्मक अवस्था
| सूचक | सिम्ता गाउँपालिका | कर्णाली प्रदेश २०७८/७९ | राष्ट्रीय २०७८/७९ | |||
|---|---|---|---|---|---|---|
| २०८०/८१ | २०७९/८० | २०७९/८० | ||||
| खाेप |
ग्राफ
तालिका
|
|||||
| बि.सि.जि. कभरेज | ७७ | ७४ | ७६ | ९२ | १०३.५ | |
| २३ महिनाभित्र पूर्ण खोप प्राप्त गरेका बालबालिका (%) | १०७ | ९२ | १११ | ० | ० | |
| डि.पि.टि. - हेप बि - हिव ३ कभरेज | ९६ | ९१ | ९३ | ९४ | ९५.२ | |
| दादुरा रूबेला १ (९-११ महिना) कभरेज | १०५ | ९८ | ९६ | ९५ | ९४.७ | |
| जे.इ कभरेज | ११२ | ८७ | ११५ | ९६ | ९५.९ | |
| टि.डी. २ र टि. डी. २+ कभरेज | ६५ | ६७ | ६६ | ६६ | ७१.७ | |
| पोषण |
ग्राफ
तालिका
|
|||||
| कम जन्म तौल भएका नवजात शिशुको प्रतिशत | ८ | ६ | ६ | ६.८ | ९.४ | |
| नयाँ तौल लिएका १ वर्ष मुनिका शिशुहरुको प्रतिशत | १०३ | ९७ | १०८ | १२० | १०४.१ | |
| नयाँ तौल लिएका २ वर्ष मुनिका शिशुहरु मध्ये अति जोखिम अवस्थाका बालबालिकाहरुको प्रतिशत | २ | १ | २ | ४.१ | ३.६ | |
| गर्भवती अवस्थामा १८० दिन आइरन चक्की प्राप्त गरेका गर्भवती महिलाहरुको प्रतिशत | ६९ | ६५ | ७९ | ७३ | ६० | |
| सुत्केरी अवस्थामा भिटामिन ए प्राप्त गरेका महिलाहरुको प्रतिशत | १०० | १०० | १०० | ८८ | ७६.३ | |
| नवजात शिशु तथा बाल रोगको एकीकृत व्यस्थापन |
ग्राफ
तालिका
|
|||||
| नाभी मलम लगाएका नवजात शिशुको प्रतिशत | १०० | १०० | १०० | ९६ | ८२.९ | |
| ब्याक्टेरियाको गम्भीर संक्रमण भएकामध्ये जेन्टामाईसिन सुईद्वारा पूर्ण उपचार पाएको प्रतिशत | ३३ | ५० | ० | ७५ | ४७.४ | |
| नयाँ निमोनिया बिरामीको दर (प्रति हजार पाँच वर्षमुनिका बालबालिकाहरुमा) | १० | ४ | ११ | ११३ | ३६.८ | |
| नयाँ एआरआई (स्वाशप्रश्वाका) बिरामी मध्ये कडा निमोनिया भएका बिरामीको प्रतिशत | ० | ० | ० | ०.४१ | ०.१८ | |
| नयाँ झाडापखालाका बिरामीको दर (प्रति हजार पाँच वर्ष मुनिका बालबालिकाहरुमा) | ६१३ | ५४८ | ५९५ | ५७९ | ३५२.४ | |
| ५ वर्ष मुनिका झाडापखालाका बिरामी मध्ये जिंक र पुनर्जलीय झोलबाट उपचार गरेको प्रतिशत | १०० | १०० | १०० | ९५ | ९४.५ | |
| जम्मा नवजात शिशु मृत्यु संख्या | ० | ० | ० | १९९ | १९१४ | |
| सुरक्षित मातृत्व तथा परिवार नियोजन |
ग्राफ
तालिका
|
|||||
| प्परोटोकल अनुसार पहिलो पटक गर्भवती जाँच गराएका गर्भवती महिलाहरुको प्रतिशत | ६४ | ५४ | ६९ | १२२ | ९१.४ | |
| प्रजनन् उमेरका महिलाहरुमा परिवार नियोजनको प्रयोगकर्ता दर (आधुनिक साधन) | १९० | १६६ | १५६ | ० | ० | |
| ४ पटक गर्भवती जाँच (महिना: ४,६,८,९/हप्ता: १६, २०-२४,३२ र ३६) महिलाहरुको प्रतिशत | ७७ | ९१ | ७९ | ७३ | ७९.४ | |
| स्वास्थ्य संस्था प्रसुति दर | ५८ | ५७ | ६० | ८३ | ७९ | |
| दक्ष प्रसुतिकर्मी/स्वास्थ्यकर्मीद्वारा प्रसुति गराएको प्रतिशत | ५७ | ५६ | ५६ | ७० | ७५ | |
| प्रोटोकल अनुसार ४ पटक (आ.व २०७८/७९ सम्म ३ पटक) सुत्केरी जाँच गराउने आमाहरुको प्रतिशत | ४७ | ५७ | ३९ | ५३ | ४०.८ | |
| जम्मा मातृ मृत्यु संख्या | ० | ० | ० | १७ | २३१ | |
| परिवार नियोजन सेवाका नयाँ सेवाग्राही दर (प्रजनन उमेरका महिलाहरु मध्ये) | १२ | १२ | १३ | १९ | ११.५ | |
| औलो रोग, क्षय रोग, कुष्ठरोग र एचआईभी |
ग्राफ
तालिका
|
|||||
| औलोको स्लाइड नमुना पोजेटिभ दर | ० | ० | ० | ०.२५ | ०.१७ | |
| डेंगुको जम्मा विरामी संख्या | ० | ० | ० | ० | ० | |
| आयातित औलोरोगको प्रतिशत (नयाँ औलो रोग मध्ये | ० | ० | ० | ६३ | ८९.५ | |
| जम्मा औलो रोग मध्ये प्लाज्मोडियम फाल्सिपारमको अनुपात | ० | ० | ० | २.१ | २२.८ | |
| नयाँ क्षयरोगी बिरामी पत्ता लागेको दर | ७३ | ११४ | ९७ | ९७ | १२९.१ | |
| क्षयरोगको उपचार सफलता दर | १०० | ९६ | ९५ | ९१ | ९१.५ | |
| कुष्ठरोगको रोग प्रकोप दर (प्रति १०००० मा) | ०.४३ | ० | ० | ०.५ | ० | |
| ए. आर. टी. उपचारमा रहेका जम्मा एच. आइ. भी. पोजेटिभको संख्या | ० | ० | ० | ६९१ | २२१५२ | |
| उपचारात्मक सेवा |
ग्राफ
तालिका
|
|||||
| ओ पि डी मा आएका बिरामी मध्ये नयाँ बिरामीको दर | ९८ | ९७ | ९७ | १०५ | ९२ | |
शीर्ष १० स्वास्थ्य अवस्थाको सूची
स्वास्थ्य सूचना व्यवस्थापन प्रणाली २०८१-०८२स्वास्थ्य क्षेत्रमा बजेट
- सशर्त स्वास्थ्यमा छुट्याएको बजेट
- समानीकरणबाट विनियोजित स्वास्थ्य बजेट
- अन्य श्रोतबाट बिनियोजित स्वास्थ्य बजेट
| बजेट | सिम्ता गाउँपालिका | |||||
|---|---|---|---|---|---|---|
| २०७८/७९ | २०७९/८० | २०८०/८१ | ||||
| ग्राफ | ||||||
| पालिकाको कुल बजेट (रु ) | ५०८,०३०,१९३ | ४१४,२००,००० | ६००,०००,००० | |||
| स्वास्थ्य बजेट (सबै स्रोत) | ५८,१३८,००० | ५७,७३०,००० | ६४,१०९,००० | |||
| सशर्त स्वास्थ्यमा छुट्याएको बजेट | ५०,६२८,००० | ४९,०३०,००० | ५६,२५९,००० | |||
| समानीकरणबाट विनियोजित स्वास्थ्य बजेट | ७,५१०,००० | ८,७००,००० | ७,५५०,००० | |||
| अन्य श्रोतबाट बिनियोजित स्वास्थ्य बजेट | - | - | ३००,००० | |||
| बजेट खर्च (%) | ८३ | ८९ | - | |||
| तालिका | ||||||
महत्वपूर्ण सम्पर्क
Simta Rural Municipality
ठेगाना : सिम्ता गाउँपालिका
टेलिफोन : ९८५८०७७५००
वेबसाइट : http://simtamun.gov.np/

यो प्रोफाइल अमेरिकी अन्तर्राष्ट्रिय विकास नियोग (युएसएआइडी) मार्फत अमेरिकी जनताहरुको सहयोगका कारण सम्भव बनेको हो । यो प्रतिवेदन भित्रका विषयवस्तु र सामग्री स्वास्थ्यका लागि सक्षम प्रणालीका एकल जिम्मेवारी हुन् र तिनले युएसएआइडी वा अमेरिकी सरकारको विचारको प्रतिविम्बित गर्छन् भन्ने जरुरी छैन ।