संक्षिप्त परिचय सुस्ता गाउँपालिका
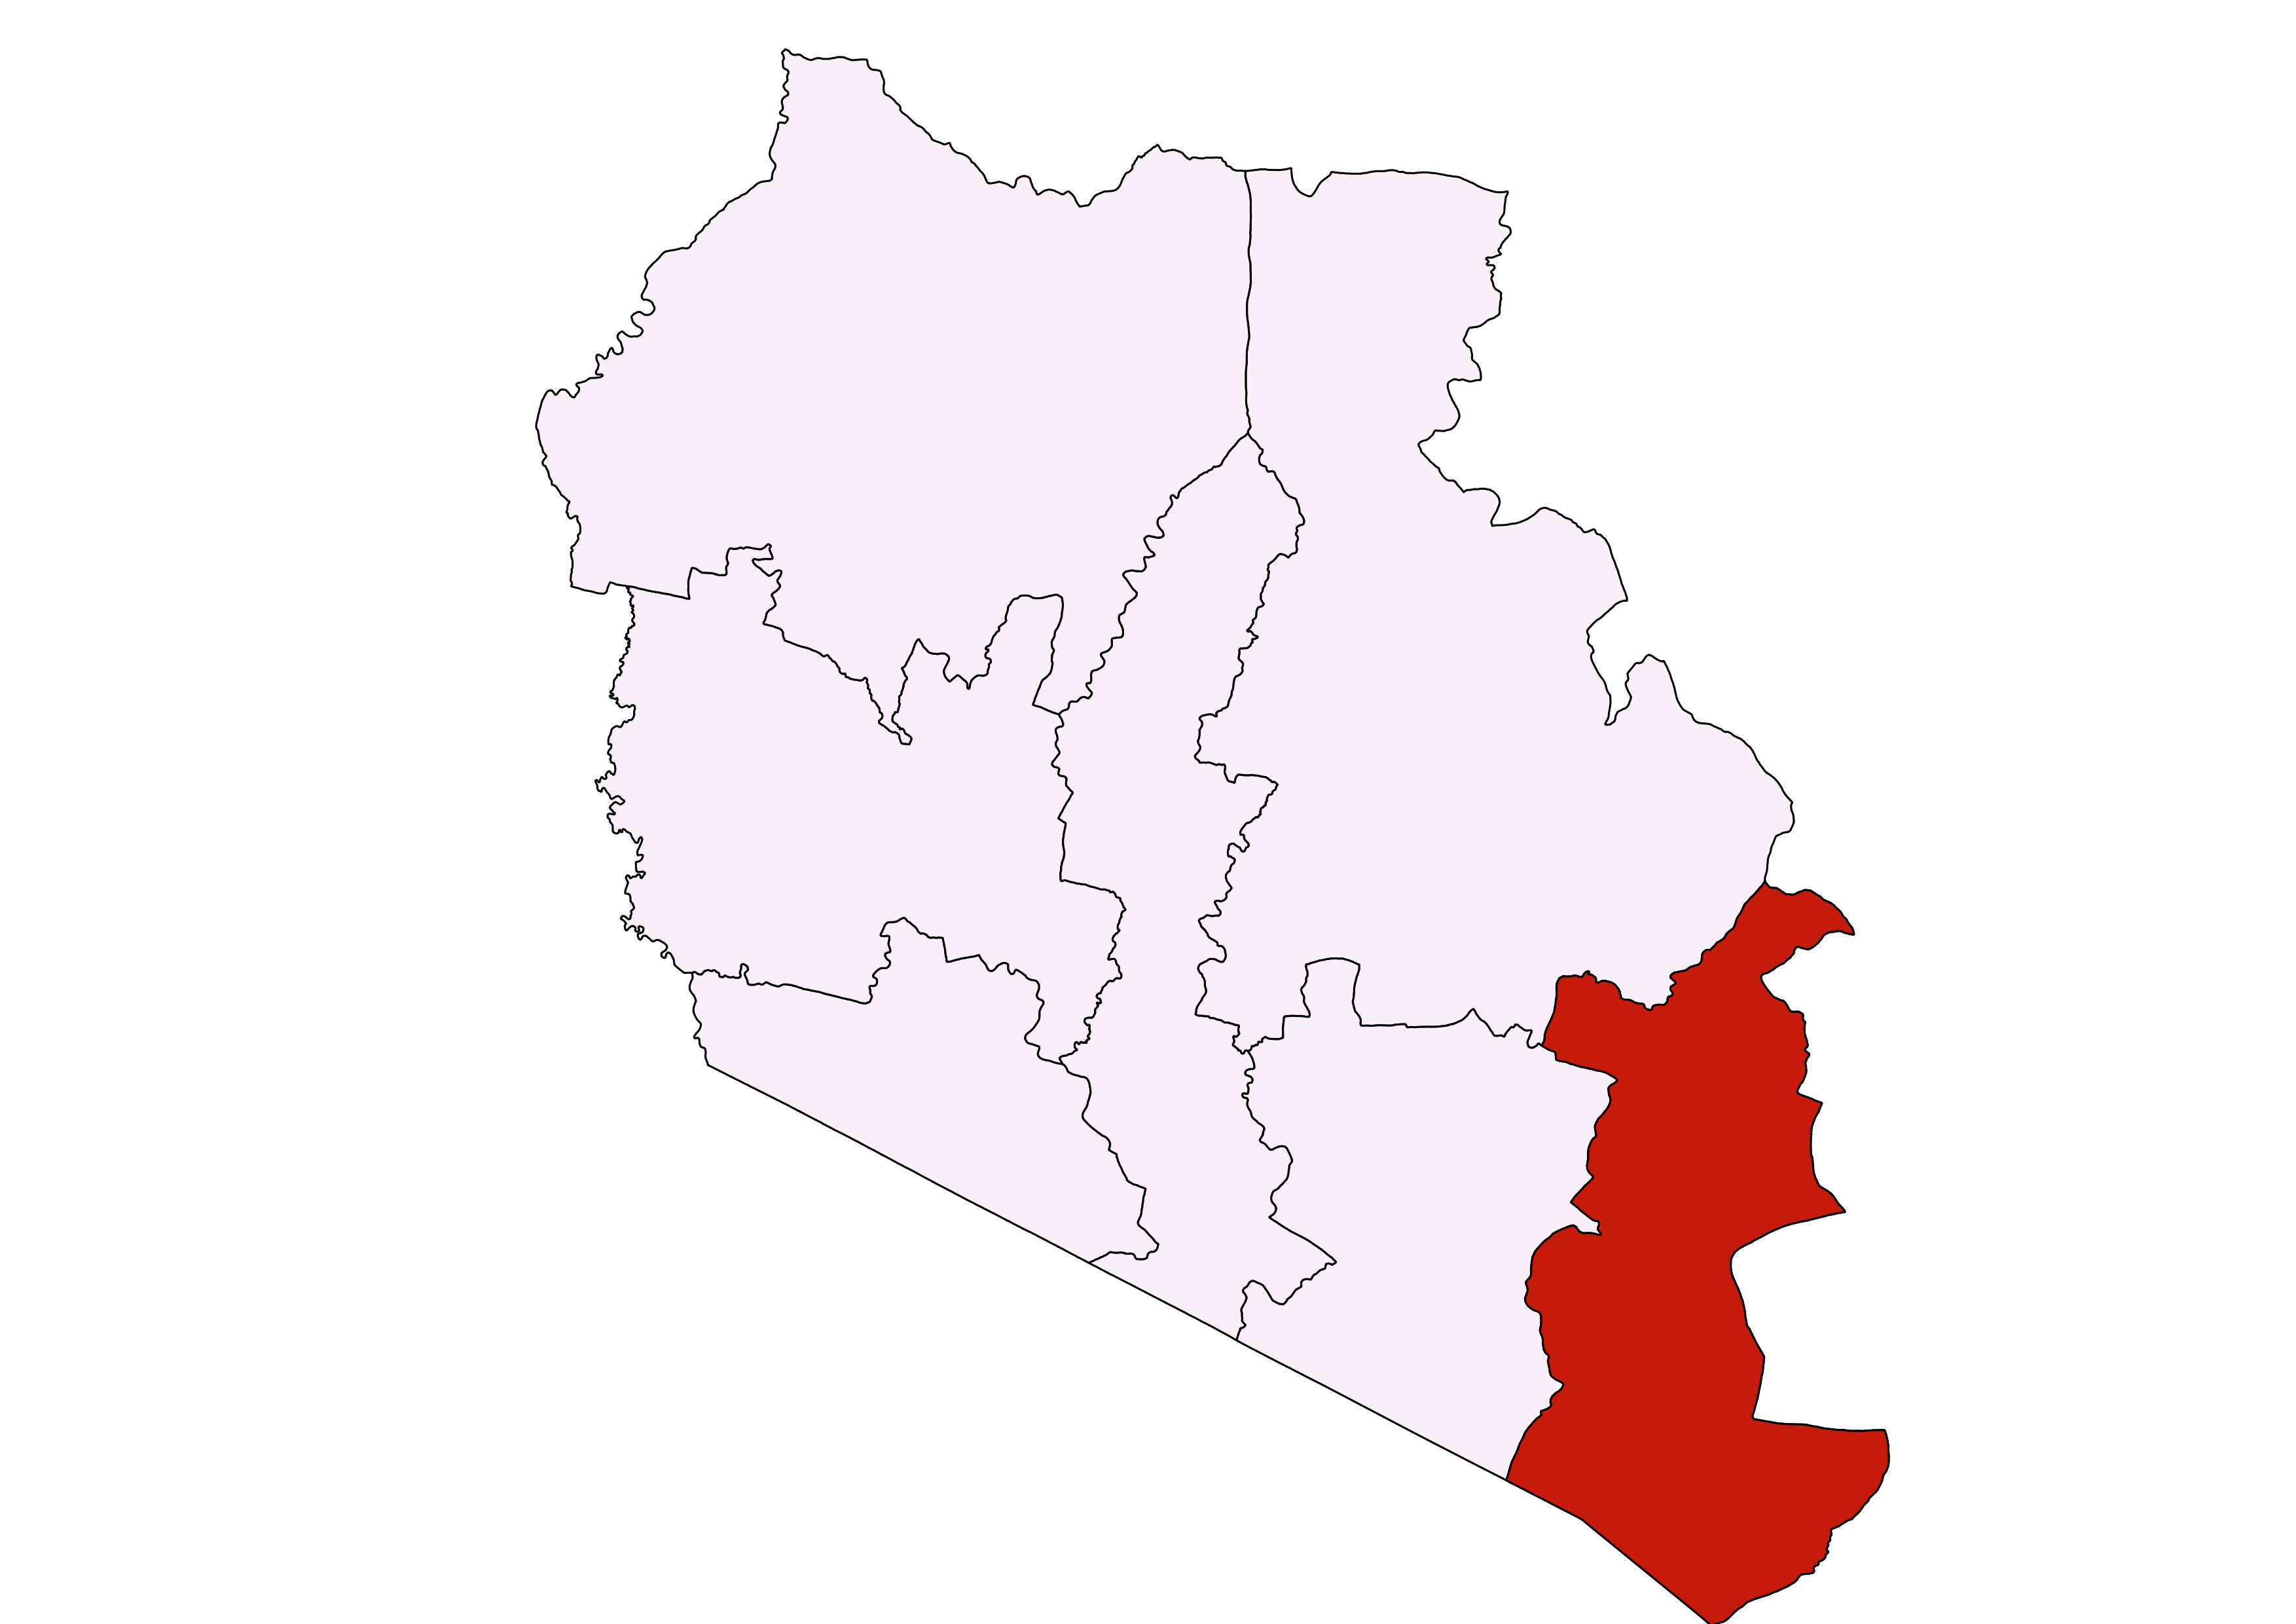
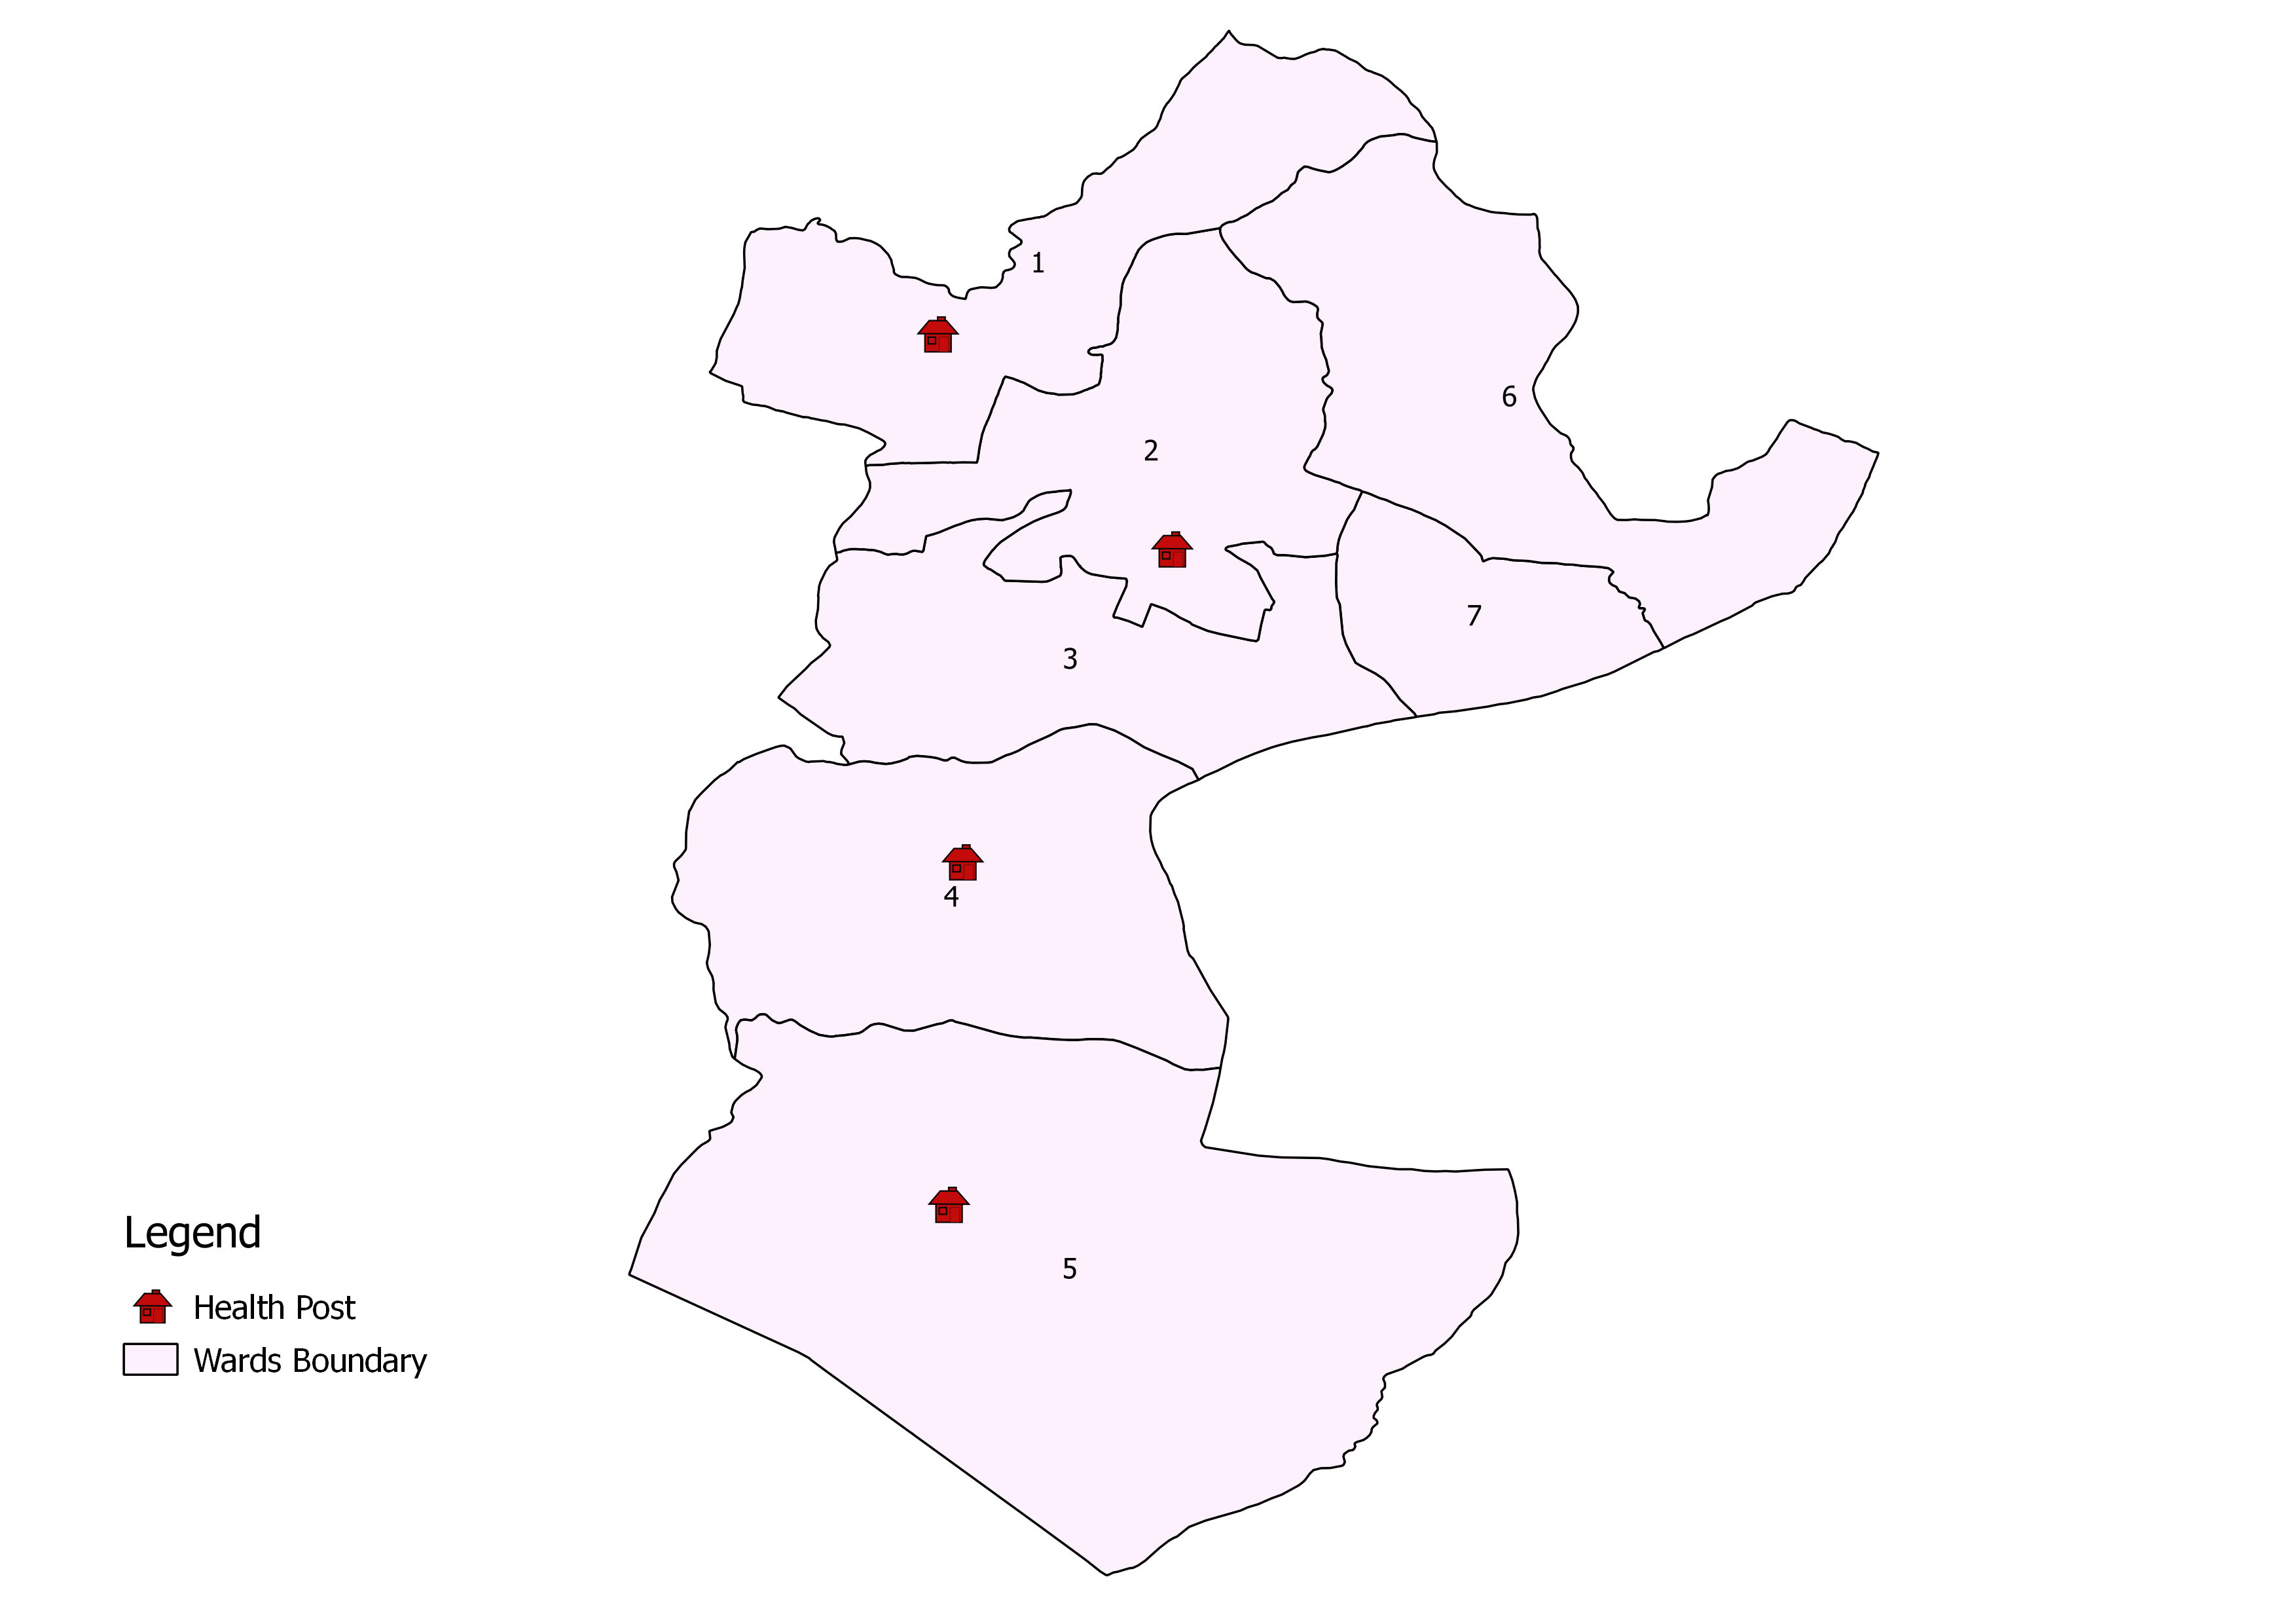
यस सुस्ता गाउँपालिका लुम्बीनी प्रदेश को नवलपरासी पश्चिमका ७ वटा स्थानिय तह अन्र्तगत एक हो । यस गाउँपालिकाको सिमाना पूर्वमा विनिय त्रिवेणी गाउँपालिका र भारत, पश्चिममा प्रतापपुर गाउँपालिका र बर्दघाट नगरपालिका, उत्तरमा बर्दघाट नगरपालिका र विनयी त्रिवेणी गाउँपालिका र दक्षिणमा भारत सँग जोडिको छ । यस गाउँपालिकाको अधिकांश भुभाग समथर रहेको छ । यो गाउँपालिका साबिकका कुडिया गा.वि.स., त्रिवेणी सुस्ता गा.वि.स. को वडा नं. ४ , रुपौलीया गा.वि.स. को ३ देखी ९ वडा, नर्सही गा.वि.स. र पक्लीहवा गा.वि.स. मिलि बनेको र ५ वटा वडा भित्र विभाजित रहेको छ । पवित्र, प्रशिद्ध, धार्मिक एंव ऐतिहासिक रुपमा अन्तराष्टिय स्तरमा परिचित नारायणी नदि को किनारामा ९१.२४ वर्ग किलो मिटरमा फैलिएको यस गाउँपालिकामा मधेसी, दलित, बाह्रमण, क्षेत्रि, मगर, नेवार आदि जातिहरु गरि करिब ७२१३ घर परिवारका ४४४०३ जनाको बसोबास रहेको छ । यस गाउँपालिकाका ९५ प्रतिशत जनताहरु निर्वाहमुखि कृषि र पशुपालन पेशामा संलग्न रहेका छन् भने ५ प्रतिशत जनताहरु अन्य पेशामा संलग्न रहेका छन । समग्रमा यहाँका वासिन्दाहरुको जीवनस्तर मध्यम खालको रहेको छ ।
जनसाङ्खिक सूचक
-
कूल जनसंख्या १
४४,७७६
२०७८/७९ -
१ बर्ष भन्दा मुनिको जनसंख्या १
८३६
२०७८/७९ -
पाँच बर्ष भन्दा मुनिको जनसंख्या १
४,२२९
२०७८/७९ -
किशोरावस्था (१०-१९ बर्ष) को जनसंख्या १
८,२०८
२०७८/७९ -
प्रजनन उमेरका महिला (१५ -४९ बर्ष ) १
१२,८४२
२०७८/७९ -
अनुमानित गर्भवती महिलाहरु १
१,०९२
२०७८/७९ -
अनुमानित जिवित जन्मको संख्या १
८६०
२०७८/७९ -
परिवारमा अनुपस्थित (विदेशमा बस्ने) जनसंख्या २
२,५४८
-
मोबाइल फोन भएका घरधुरी (%) २
६१
-
टेलिभिजन भएका घरधुरी (%) २
४७
-
लैङ्गिक अनुपात २
९५
-
१४ बर्ष र सो भन्दा कम उमेरका जनसंख्या २
१३,१४७
-
६५ बर्ष र सो भन्दा माथि उमेरका जनसंख्या २
१,९१७
उमेर र लिंगको आधारमा जनसंख्या वितरण
जनगणना २०६८जातिगत आधारमा जनसंख्या वितरण
जनगणना २०६८वार्ड अनुसार जनसंख्या वितरण
जनगणना २०६८स्वास्थ्य सेवा प्रवाह गर्ने संस्थाहरु
- अस्पताल -
- प्रास्वाके -
- स्वास्थ्य चौकी ४
- सामुदायिक स्वास्थ्य ईकाई १
- शहरी स्वास्थ्य केन्द्र -
- गाउँघर क्लिनिक १४
- खोप क्लिनिक १९
- आधारभूत स्वस्थ सेवाकेन्द्र १
- बर्थिंग सेन्टर १
सरकारी संस्था
- अस्पताल तथा नर्सिंग होम -
- पोलिक्लिनिक -
- औषधि पसल -
निजी (गैर-सरकारी संस्था समेत)
अन्य स्वास्थ्य केन्द्रहरु
- माइक्रोस्कोपी केन्द्र १
- एआरटि केन्द्र -
- एचाईभी परीक्षण केन्द्र -
- क्षयरोग उपचार केन्द्र ४
- आयुर्वेद अस्पताल/केन्द्र -
- आँखा अस्पताल/केन्द्र -
अस्पताल शैयाहरू
- सार्वजनिक -
- निजी -
वडा अनुसार स्वास्थ्य संस्थाको जानकारी
| स्वास्थ्यसंस्थाको नाम | वार्ड न | बर्थिंग सेन्टर BEONC/CEONC | महिला स्वास्थ्य स्वयं सेवक संख्या | दक्ष प्रसुतिकर्मी संख्या | परिवार नियोजन *सेवा | स्वीकृत दरबन्दी | दरबन्दी अनुसार पदपूर्ति | करारका कर्मचारी |
|---|---|---|---|---|---|---|---|---|
| रूपौलीय स्वास्थ्य चौकी | १ | - | ५ | - | ३ साधनहरू | ६ | ४ | ० |
| कुदिया स्वास्थ्य चौकी | २ | - | ७ | - | ४ साधनहरू | ६ | ४ | १ |
| आधारभूत स्वास्थ्य सेवा केन्द्र | ३ | - | ४ | - | ५ साधनहरू | २ | २ | ० |
| नरशही स्वास्थ्य चौकी | ४ | प्रसुती केन्द्र | ९ | ४ | ५ साधनहरू | ६ | २ | ४ |
| पक्लीहवा स्वास्थ्य चौकी | ५ | - | ९ | - | ३ साधनहरू | ६ | २ | १ |
| सुस्ता सामुदायिक स्वास्थ्य इकाइ | ५ | - | १ | - | ३ साधनहरू | २ | ० | २ |
| कुल कर्मचारी संख्या | ३५ | ४ | २८ | १४ | ८ | |||
स्वास्थ्य सेवाको लागि मानव संसाधन
- CEONC साइटहरू-
- BEONC साइटहरू-
- आइयुसीडी तथा इम्पलान्ट सेवा प्रदायक५
- एकीकृत बालरोग व्यवस्थापन (IMCI) प्रशिक्षित कर्मचारी१०
- जनसंख्या (प्रति मस्वास्वका) १२७९
- जनसंख्या (प्रति स्वास्थ्यकर्मी) ३१९८
- अनुमानित गर्भवति (प्रति दक्ष प्रसुतिकर्मी) २७३
- अनुमानित गर्भवति (प्रति बर्थिङ्ग सेन्टर) १०९२
- जनसंख्या (प्रति स्वास्थ्य संस्था) (अस्पताल,प्रस्वाके र स्वाचौ सहित) -
- जनसंख्या (प्रति सरकारी अस्पताल) -
- जनसंख्या (प्रति अस्पताल र नर्सिंग होम (सबै) -
मातृशिशु बालस्वास्थ्य र परिवार नियोजन सेवा उपयोगको अवस्था
स्वास्थ्य सूचना व्यवस्थापन प्रणाली २०७८प्रमूख स्वास्थ्य सेवाहरूको उपयोगको तुलनात्मक अवस्था
| सूचक | सुस्ता गाउँपालिका | लुम्बिनी प्रदेश २०७८/७९ | राष्ट्रीय २०७८/७९ | |||
|---|---|---|---|---|---|---|
| २०७६/७७ | २०७७/७८ | २०७८/७९ | ||||
| खाेप |
ग्राफ
तालिका
|
|||||
| बि.सि.जि. कभरेज | ८३.५ | ८५.४ | ९०.९ | १०३.१ | १०३.५ | |
| २३ महिनाभित्र पूर्ण खोप प्राप्त गरेका बालबालिका (%) | ० | ० | ० | ० | ० | |
| डि.पि.टि. - हेप बि - हिव ३ कभरेज | ८३.७ | ९१.४ | ९४ | ९६.६ | ९५.२ | |
| दादुरा रूबेला १ (९-११ महिना) कभरेज | ८४.३ | ८३ | ९३.८ | ९६.७ | ९४.७ | |
| जे.इ कभरेज | ६८.१ | ६९.९ | ९०.४ | ९८.९ | ९५.९ | |
| टि.डी. २ र टि. डी. २+ कभरेज | ७२.२ | ७२.६ | ७५.७ | ७३.९ | ७१.७ | |
| पोषण |
ग्राफ
तालिका
|
|||||
| कम जन्म तौल भएका नवजात शिशुको प्रतिशत | ०.१२ | ५.७ | ०.७८ | १२ | ९.४ | |
| नयाँ तौल लिएका १ वर्ष मुनिका शिशुहरुको प्रतिशत | ४४.७ | १०४.३ | ११३.८ | १०९ | १०४.१ | |
| नयाँ तौल लिएका २ वर्ष मुनिका शिशुहरु मध्ये अति जोखिम अवस्थाका बालबालिकाहरुको प्रतिशत | ५.५ | ४.१ | २ | ३.५ | ३.६ | |
| गर्भवती अवस्थामा १८० दिन आइरन चक्की प्राप्त गरेका गर्भवती महिलाहरुको प्रतिशत | ४८.४ | ४७.३ | ६२.४ | ७५.८ | ६० | |
| सुत्केरी अवस्थामा भिटामिन ए प्राप्त गरेका महिलाहरुको प्रतिशत | ५२.८ | ४०.१ | ३३.८ | ९८.२ | ७६.३ | |
| नवजात शिशु तथा बाल रोगको एकीकृत व्यस्थापन |
ग्राफ
तालिका
|
|||||
| नाभी मलम लगाएका नवजात शिशुको प्रतिशत | ८७.५ | ९०.५ | ९४.७ | ९४.२ | ८२.९ | |
| ब्याक्टेरियाको गम्भीर संक्रमण भएकामध्ये जेन्टामाईसिन सुईद्वारा पूर्ण उपचार पाएको प्रतिशत | ० | ० | २३ | ३९.५ | ४७.४ | |
| नयाँ निमोनिया बिरामीको दर (प्रति हजार पाँच वर्षमुनिका बालबालिकाहरुमा) | १६.५ | ४ | ३७.१ | २९.३ | ३६.८ | |
| नयाँ एआरआई (स्वाशप्रश्वाका) बिरामी मध्ये कडा निमोनिया भएका बिरामीको प्रतिशत | ०.२५ | ०.३६ | ०.०७ | ०.०५ | ०.१८ | |
| नयाँ झाडापखालाका बिरामीको दर (प्रति हजार पाँच वर्ष मुनिका बालबालिकाहरुमा) | २१२.९ | १७५.८ | १९९.८ | ३३९ | ३५२.४ | |
| ५ वर्ष मुनिका झाडापखालाका बिरामी मध्ये जिंक र पुनर्जलीय झोलबाट उपचार गरेको प्रतिशत | ८३.६ | ९६.९ | ९५.२ | ९८.७ | ९४.५ | |
| जम्मा नवजात शिशु मृत्यु संख्या | ० | ३ | ० | ५७३ | १९१४ | |
| सुरक्षित मातृत्व तथा परिवार नियोजन |
ग्राफ
तालिका
|
|||||
| प्परोटोकल अनुसार पहिलो पटक गर्भवती जाँच गराएका गर्भवती महिलाहरुको प्रतिशत | ६५.४ | ६९.७ | ८४.८ | ९३.५ | ९१.४ | |
| प्रजनन् उमेरका महिलाहरुमा परिवार नियोजनको प्रयोगकर्ता दर (आधुनिक साधन) | ० | ० | ० | ० | ० | |
| ४ पटक गर्भवती जाँच (महिना: ४,६,८,९/हप्ता: १६, २०-२४,३२ र ३६) महिलाहरुको प्रतिशत | ४८.३ | ४७.३ | ६२.३ | ७९.७ | ७९.४ | |
| स्वास्थ्य संस्था प्रसुति दर | २२.४ | १८.१ | २२.३ | ९४.२ | ७९ | |
| दक्ष प्रसुतिकर्मी/स्वास्थ्यकर्मीद्वारा प्रसुति गराएको प्रतिशत | २२.४ | १८.४ | २२.३ | ८९.८ | ७५ | |
| प्रोटोकल अनुसार ४ पटक (आ.व २०७८/७९ सम्म ३ पटक) सुत्केरी जाँच गराउने आमाहरुको प्रतिशत | १८.७ | १४.८ | ३८.९ | ५३.७ | ४०.८ | |
| जम्मा मातृ मृत्यु संख्या | ० | ० | ० | ७४ | २३१ | |
| परिवार नियोजन सेवाका नयाँ सेवाग्राही दर (प्रजनन उमेरका महिलाहरु मध्ये) | ५.८ | ६ | ६.७ | १२.४ | ११.५ | |
| औलो रोग, क्षय रोग, कुष्ठरोग र एचआईभी |
ग्राफ
तालिका
|
|||||
| औलोको स्लाइड नमुना पोजेटिभ दर | ०.१८ | ०.२ | ० | ०.२७ | ०.१७ | |
| डेंगुको जम्मा विरामी संख्या | ० | ० | ० | ० | ० | |
| आयातित औलोरोगको प्रतिशत (नयाँ औलो रोग मध्ये | १०० | १०० | ० | ९५.५ | ८९.५ | |
| जम्मा औलो रोग मध्ये प्लाज्मोडियम फाल्सिपारमको अनुपात | ० | १०० | ० | ३८.७ | २२.८ | |
| नयाँ क्षयरोगी बिरामी पत्ता लागेको दर | ११४.७ | ११५.८ | ११०.२ | १५७.४ | १२९.१ | |
| क्षयरोगको उपचार सफलता दर | १०० | ८७ | ७६.६ | ९१ | ९१.५ | |
| कुष्ठरोगको रोग प्रकोप दर (प्रति १०००० मा) | ० | ०.७४ | १.५ | ०.९ | ० | |
| ए. आर. टी. उपचारमा रहेका जम्मा एच. आइ. भी. पोजेटिभको संख्या | ० | ० | ० | ४३२६ | २२१५२ | |
| उपचारात्मक सेवा |
ग्राफ
तालिका
|
|||||
| ओ पि डी मा आएका बिरामी मध्ये नयाँ बिरामीको दर | ५१ | ४६.२ | ५९ | ९४.५ | ९२ | |
शीर्ष १० स्वास्थ्य अवस्थाको सूची
स्वास्थ्य सूचना व्यवस्थापन प्रणाली २०७६/७७स्वास्थ्य क्षेत्रमा बजेट
- सशर्त स्वास्थ्यमा छुट्याएको बजेट
- समानीकरणबाट विनियोजित स्वास्थ्य बजेट
- अन्य श्रोतबाट बिनियोजित स्वास्थ्य बजेट
| बजेट | सुस्ता गाउँपालिका | |||||
|---|---|---|---|---|---|---|
| २०७७/७८ | २०७८/७९ | २०७९/८० | ||||
| ग्राफ | ||||||
| पालिकाको कुल बजेट (रु ) | ६४९,७९५,६२४ | ५९१,३७३,८७४ | ५६४,३८६,५२२ | |||
| स्वास्थ्य बजेट (सबै स्रोत) | २७,४०४,००० | ३९,४०८,००० | ३६,७२५,००० | |||
| सशर्त स्वास्थ्यमा छुट्याएको बजेट | २२,५५४,००० | ३२,९३२,००० | २७,६७५,००० | |||
| समानीकरणबाट विनियोजित स्वास्थ्य बजेट | ४,८५०,००० | ६,४७६,००० | ९,०५०,००० | |||
| अन्य श्रोतबाट बिनियोजित स्वास्थ्य बजेट | - | - | - | |||
| बजेट खर्च (%) | २७,४०४,००० | ६० | ३६,७२५,००० | |||
| तालिका | ||||||
महत्वपूर्ण सम्पर्क
Susta Rural Municipality
ठेगाना : सुस्ता गाउँपालिका, नवलपरासी पश्चिम, लुम्बिनी प्रदेश नेपाल
टेलिफोन : ०७८-५०५००१,५०६०००,५०६००४
वेबसाइट : https://sustamun.gov.np/
स्वास्थ्य शाखा प्रमुख
नाम : निर्मला कुशवाहा
सम्पर्क : ९८६६८५१६६६

यो प्रोफाइल अमेरिकी अन्तर्राष्ट्रिय विकास नियोग (युएसएआइडी) मार्फत अमेरिकी जनताहरुको सहयोगका कारण सम्भव बनेको हो । यो प्रतिवेदन भित्रका विषयवस्तु र सामग्री स्वास्थ्यका लागि सक्षम प्रणालीका एकल जिम्मेवारी हुन् र तिनले युएसएआइडी वा अमेरिकी सरकारको विचारको प्रतिविम्बित गर्छन् भन्ने जरुरी छैन ।