संक्षिप्त परिचय ठाकुरबाबा नगरपालिका
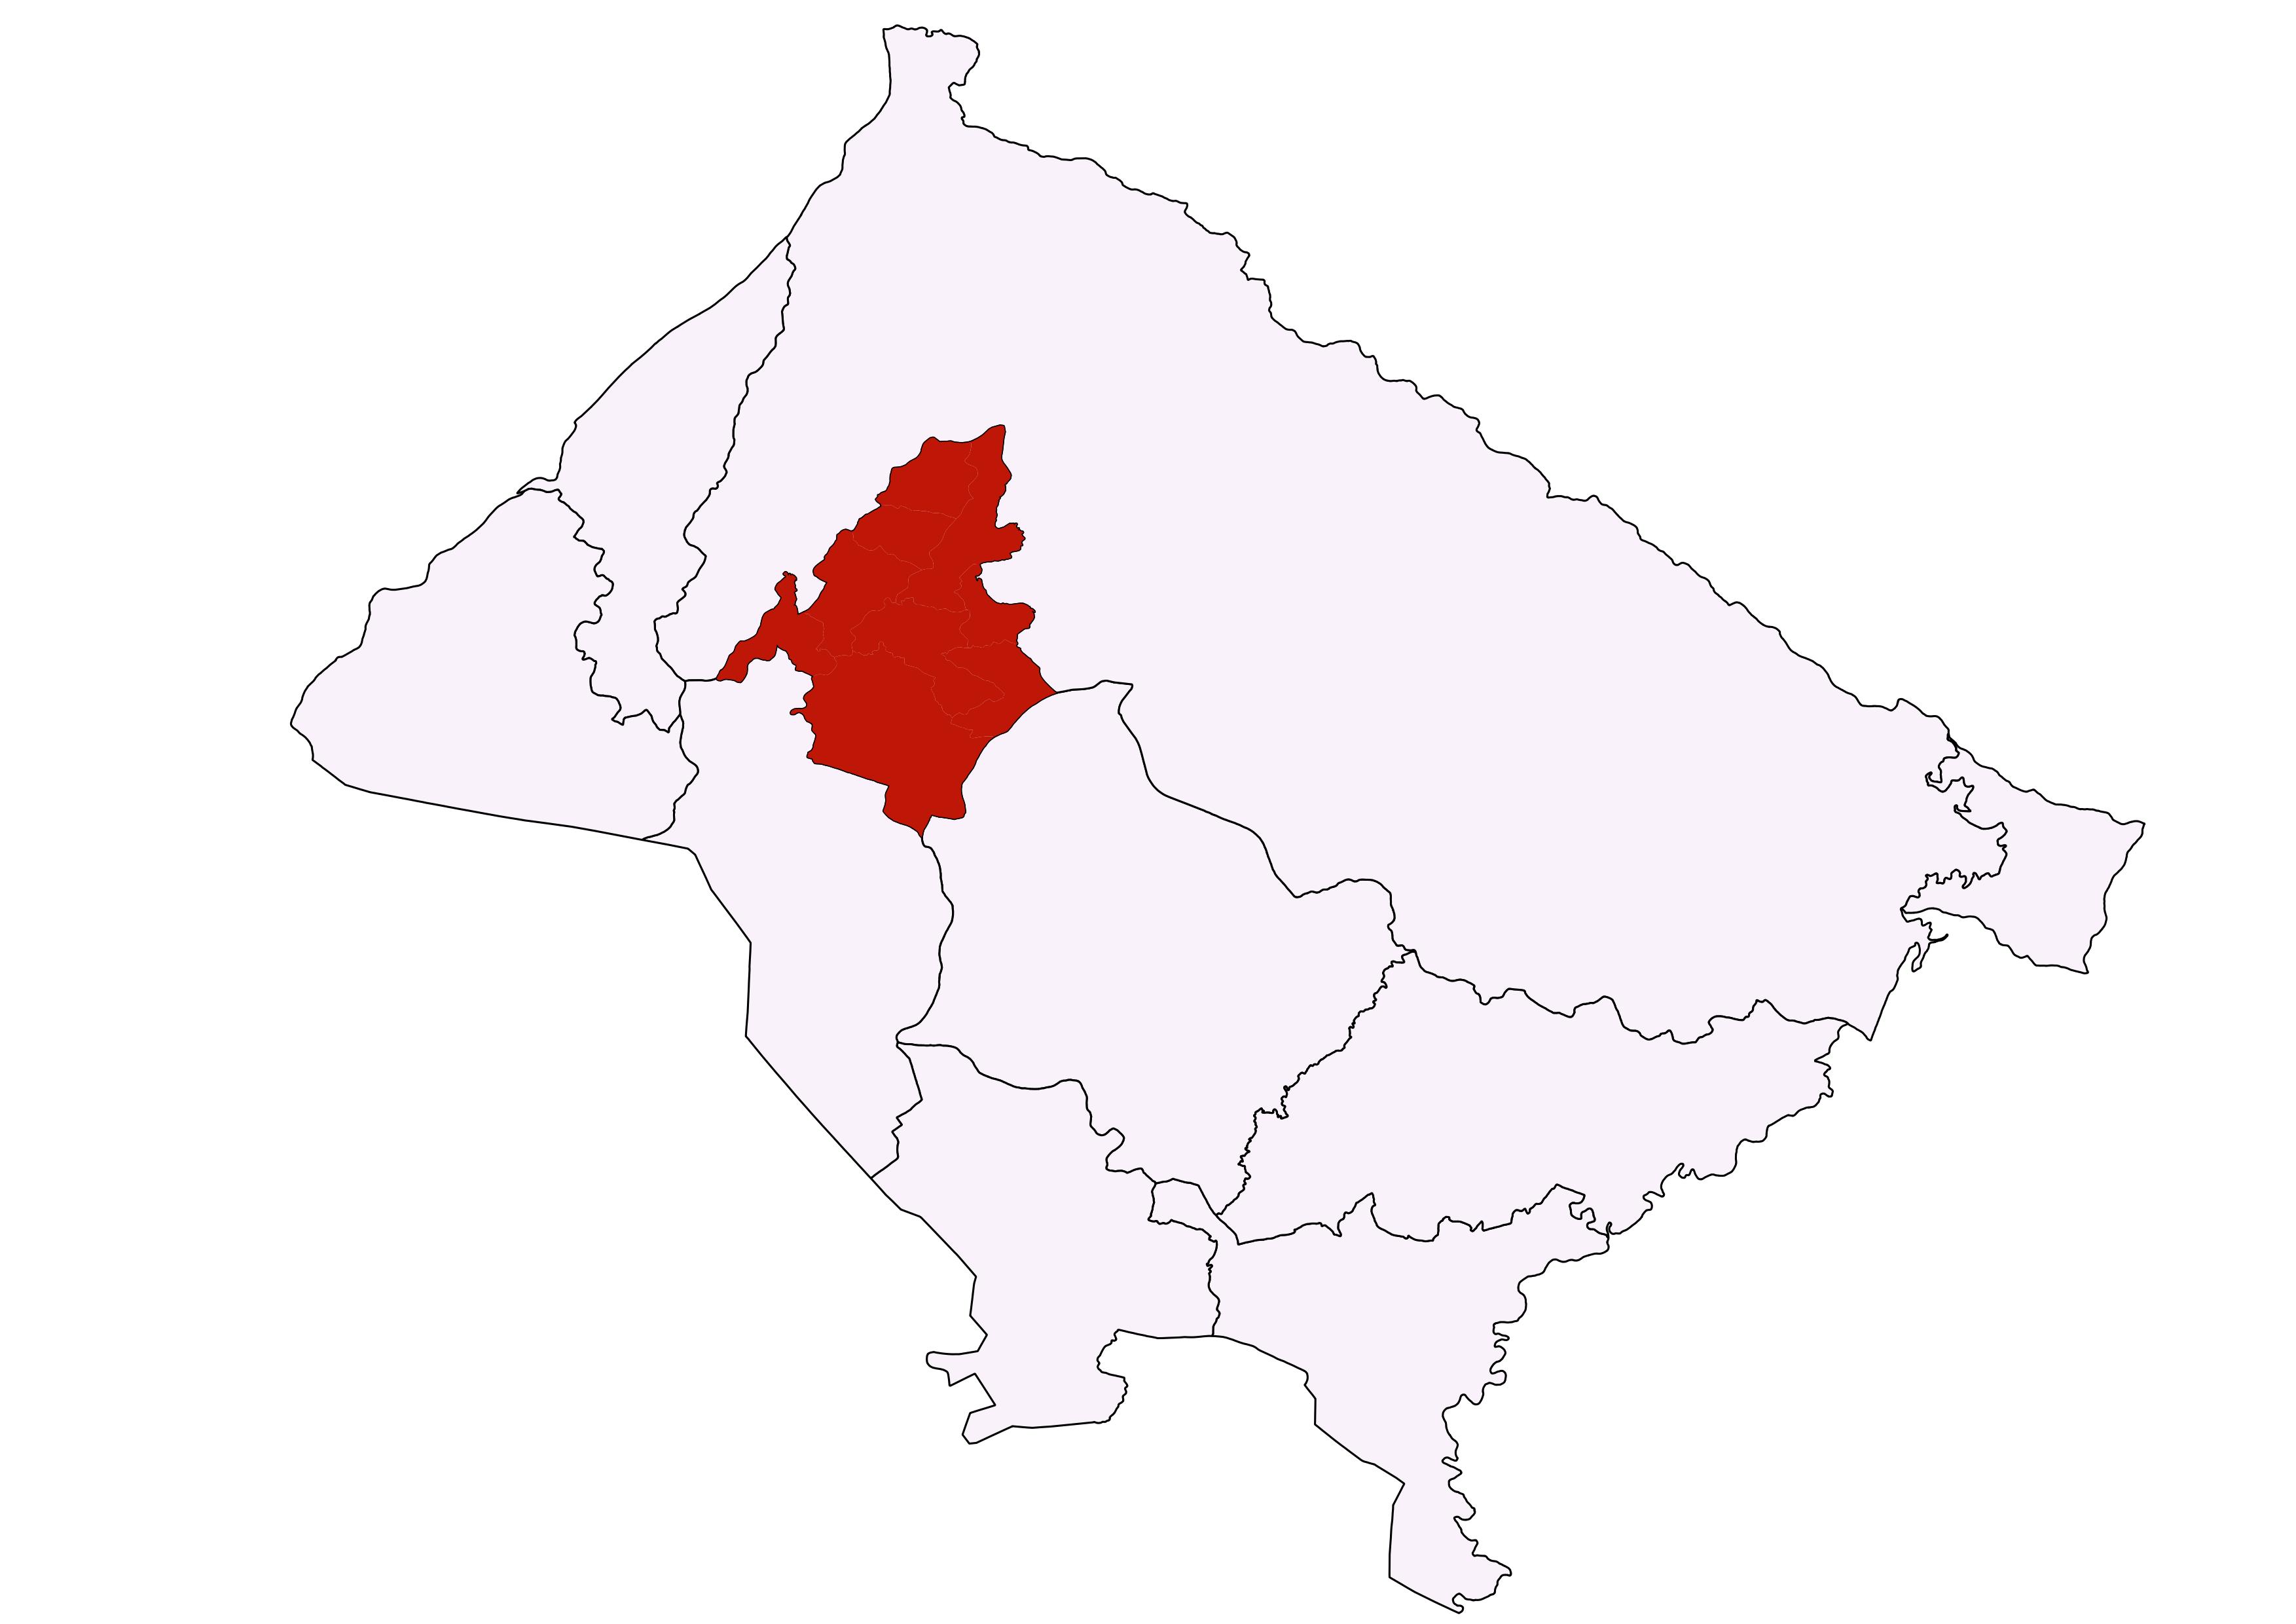
ठाकुरबाबा नगरपालिका नेपालको लुम्बिनी प्रदेशको बर्दिया जिल्लामा अवस्थित छ । यो नगरपालीका २०७३ फाल्गुन २७ मा स्थापना भएको हो । यस क्षेत्रको ऐतिहासिक मन्दिर ठाकुरबाबा मन्दिरको नामबाट नगरपालिकाको नामाकरण गरिएको छ । यो नगरपालिका ९ वटा वडामा विभाजित छ । यस न.पा को पूर्व, पश्चिम, उत्तर मा बर्दिया राष्ट्रिय निकुञ्ज तथा दक्षिणमा मधुवन र राजापुर न.पा को सिमाना रहेको छ । ठाकुरबाबा मन्दिर र बर्दिया राष्ट्रिय निकुञ्ज यहँको प्रमुख आकर्षण हो ।
जनसाङ्खिक सूचक
-
कूल जनसंख्या १
४९,४८०
-
१ बर्ष भन्दा मुनिको जनसंख्या १
८७१
-
पाँच बर्ष भन्दा मुनिको जनसंख्या १
४,३९४
-
किशोरावस्था (१०-१९ बर्ष) को जनसंख्या १
८,९२०
-
प्रजनन उमेरका महिला (१५ -४९ बर्ष ) १
१५,३६१
-
अनुमानित गर्भवती महिलाहरु १
१,१४२
-
अनुमानित जिवित जन्मको संख्या १
८९३
-
परिवारमा अनुपस्थित (विदेशमा बस्ने) जनसंख्या २
२,३९६
-
मोबाइल फोन भएका घरधुरी (%) २
६२
-
टेलिभिजन भएका घरधुरी (%) २
२८
-
लैङ्गिक अनुपात २
८८
-
१४ बर्ष र सो भन्दा कम उमेरका जनसंख्या १
१३,३९२
-
६५ बर्ष र सो भन्दा माथि उमेरका जनसंख्या २
१,९०८
उमेर र लिंगको आधारमा जनसंख्या वितरण
जनगणना २०६८जातिगत आधारमा जनसंख्या वितरण
जनगणना २०६८वार्ड अनुसार जनसंख्या वितरण
जनगणना २०६८स्वास्थ्य सेवा प्रवाह गर्ने संस्थाहरु

- अस्पताल १
- प्रास्वाके -
- स्वास्थ्य चौकी ४
- सामुदायिक स्वास्थ्य ईकाई -
- शहरी स्वास्थ्य केन्द्र -
- गाउँघर क्लिनिक २२
- खोप क्लिनिक २०
- आधारभूत स्वस्थ सेवाकेन्द्र ५
- बर्थिंग सेन्टर ४
सरकारी संस्था
- अस्पताल तथा नर्सिंग होम -
- पोलिक्लिनिक १
- औषधि पसल २१
निजी (गैर-सरकारी संस्था समेत)
अन्य स्वास्थ्य केन्द्रहरु
- माइक्रोस्कोपी केन्द्र ४
- एआरटि केन्द्र -
- एचाईभी परीक्षण केन्द्र -
- क्षयरोग उपचार केन्द्र ४
- आयुर्वेद अस्पताल/केन्द्र १
- आँखा अस्पताल/केन्द्र १
अस्पताल शैयाहरू
- सार्वजनिक १५
- निजी -
वडा अनुसार स्वास्थ्य संस्थाको जानकारी
| स्वास्थ्यसंस्थाको नाम | वार्ड न | बर्थिंग सेन्टर BEONC/CEONC | महिला स्वास्थ्य स्वयं सेवक संख्या | दक्ष प्रसुतिकर्मी संख्या | परिवार नियोजन *सेवा | स्वीकृत दरबन्दी | दरबन्दी अनुसार पदपूर्ति | करारका कर्मचारी |
|---|---|---|---|---|---|---|---|---|
| नेउलापुर स्वास्थ्य चैाकी | १ | हाे | १० | ३ | ५ साधनहरू | ६ | ८ | ३ |
| शिवपुर स्वास्थ्य चैाकी | ६ | हाे | ८ | २ | ५ साधनहरू | ६ | ६ | १ |
| बगनाह स्वास्थ्य चैाकी | ४ | हाे | ८ | ४ | ४ साधनहरू | ६ | ७ | १ |
| ठाकुरदवारा स्वास्थ्य चैाकी | ८ | हाे | ८ | २ | ४ साधनहरू | ६ | ७ | १ |
| ठाकुरद्वारा अाधारभूत स्वास्थ्य सेवा केन्द्र | ९ | हाेइन | ९ | ० | ३ साधनहरू | ० | ० | १ |
| शाहीपुर अाधारभूत स्वास्थ्य सेवा केन्द्र | ५ | हाेइन | १० | ० | ३ साधनहरू | ० | ० | ० |
| गेाधाना अाधारभूत स्वास्थ्य सेवा केन्द्र | ३ | हाेइन | ११ | ० | ३ साधनहरू | ० | ० | २ |
| पेरहनी अाधारभूत स्वास्थ्य सेवा केन्द्र | २ | हाेइन | ११ | ० | ३ साधनहरू | ० | ० | १ |
| कालीगैाडी अाधारभूत स्वास्थ्य सेवा केन्द्र | ७ | हाेइन | ८ | ० | ३ साधनहरू | ० | ० | ० |
| कुल कर्मचारी संख्या | ८३ | ११ | २४ | २८ | १० | |||
स्वास्थ्य सेवाको लागि मानव संसाधन
- CEONC साइटहरू-
- BEONC साइटहरू-
- आइयुसीडी तथा इम्पलान्ट सेवा प्रदायक६
- एकीकृत बालरोग व्यवस्थापन (IMCI) प्रशिक्षित कर्मचारी१८
- जनसंख्या (प्रति मस्वास्वका) ५९६
- जनसंख्या (प्रति स्वास्थ्यकर्मी) १७६७
- अनुमानित गर्भवति (प्रति दक्ष प्रसुतिकर्मी) १०४
- अनुमानित गर्भवति (प्रति बर्थिङ्ग सेन्टर) २८६
- जनसंख्या (प्रति स्वास्थ्य संस्था) (अस्पताल,प्रस्वाके र स्वाचौ सहित) -
- जनसंख्या (प्रति सरकारी अस्पताल) ४९४८०
- जनसंख्या (प्रति अस्पताल र नर्सिंग होम (सबै) ४९४८०
मातृशिशु बालस्वास्थ्य र परिवार नियोजन सेवा उपयोगको अवस्था
स्वास्थ्य सूचना व्यवस्थापन प्रणाली २०७८७९प्रमूख स्वास्थ्य सेवाहरूको उपयोगको तुलनात्मक अवस्था
| सूचक | ठाकुरबाबा नगरपालिका | लुम्बिनी प्रदेश २०७८/७९ | राष्ट्रीय २०७८/७९ | |||
|---|---|---|---|---|---|---|
| २०७६/७७ | २०७७/७८ | २०७८/७९ | ||||
| खाेप |
ग्राफ
तालिका
|
|||||
| बि.सि.जि. कभरेज | ८० | ७५.२ | ८९.३ | १०३.१ | १०३.५ | |
| २३ महिनाभित्र पूर्ण खोप प्राप्त गरेका बालबालिका (%) | ० | ० | ० | ० | ० | |
| डि.पि.टि. - हेप बि - हिव ३ कभरेज | ७७.७ | ८२.१ | ९५.२ | ९६.६ | ९५.२ | |
| दादुरा रूबेला १ (९-११ महिना) कभरेज | ७५.१ | ८१.७ | ९२.३ | ९६.७ | ९४.७ | |
| जे.इ कभरेज | ७४.८ | ८५.९ | ९२.६ | ९८.९ | ९५.९ | |
| टि.डी. २ र टि. डी. २+ कभरेज | ६५ | ६०.६ | ६८ | ७३.९ | ७१.७ | |
| पोषण |
ग्राफ
तालिका
|
|||||
| कम जन्म तौल भएका नवजात शिशुको प्रतिशत | ४.५ | ४.६ | ४.६९ | १२ | ९.४ | |
| नयाँ तौल लिएका १ वर्ष मुनिका शिशुहरुको प्रतिशत | ९१.८ | १०९.८ | १०८.८ | १०९ | १०४.१ | |
| नयाँ तौल लिएका २ वर्ष मुनिका शिशुहरु मध्ये अति जोखिम अवस्थाका बालबालिकाहरुको प्रतिशत | ४.५ | ४.७ | ४.२ | ३.५ | ३.६ | |
| गर्भवती अवस्थामा १८० दिन आइरन चक्की प्राप्त गरेका गर्भवती महिलाहरुको प्रतिशत | ६३ | ५७.६ | ७५ | ७५.८ | ६० | |
| सुत्केरी अवस्थामा भिटामिन ए प्राप्त गरेका महिलाहरुको प्रतिशत | ५४.८ | ५३.२ | ७६.६ | ९८.२ | ७६.३ | |
| नवजात शिशु तथा बाल रोगको एकीकृत व्यस्थापन |
ग्राफ
तालिका
|
|||||
| नाभी मलम लगाएका नवजात शिशुको प्रतिशत | ९८.४ | ९८ | ९७.४ | ९४.२ | ८२.९ | |
| ब्याक्टेरियाको गम्भीर संक्रमण भएकामध्ये जेन्टामाईसिन सुईद्वारा पूर्ण उपचार पाएको प्रतिशत | ९३.५ | ८१.५ | ७७.९१ | ३९.५ | ४७.४ | |
| नयाँ निमोनिया बिरामीको दर (प्रति हजार पाँच वर्षमुनिका बालबालिकाहरुमा) | ५७.९ | १७.१ | ४३.२ | २९.३ | ३६.८ | |
| नयाँ एआरआई (स्वाशप्रश्वाका) बिरामी मध्ये कडा निमोनिया भएका बिरामीको प्रतिशत | ०.०७ | ० | ० | ०.०५ | ०.१८ | |
| नयाँ झाडापखालाका बिरामीको दर (प्रति हजार पाँच वर्ष मुनिका बालबालिकाहरुमा) | २३६.१ | २७९.४ | ३३४.८ | ३३९ | ३५२.४ | |
| ५ वर्ष मुनिका झाडापखालाका बिरामी मध्ये जिंक र पुनर्जलीय झोलबाट उपचार गरेको प्रतिशत | ८९.७ | ९५.७ | ९७.७ | ९८.७ | ९४.५ | |
| जम्मा नवजात शिशु मृत्यु संख्या | १ | ८ | ४ | ५७३ | १९१४ | |
| सुरक्षित मातृत्व तथा परिवार नियोजन |
ग्राफ
तालिका
|
|||||
| प्परोटोकल अनुसार पहिलो पटक गर्भवती जाँच गराएका गर्भवती महिलाहरुको प्रतिशत | ७४.६ | ६९.५ | ८३.८ | ९३.५ | ९१.४ | |
| प्रजनन् उमेरका महिलाहरुमा परिवार नियोजनको प्रयोगकर्ता दर (आधुनिक साधन) | ० | ० | ० | ० | ० | |
| ४ पटक गर्भवती जाँच (महिना: ४,६,८,९/हप्ता: १६, २०-२४,३२ र ३६) महिलाहरुको प्रतिशत | ६३.१ | ५७.६ | ७४.८ | ७९.७ | ७९.४ | |
| स्वास्थ्य संस्था प्रसुति दर | ५४.८ | ५२.९ | ५९.५ | ९४.२ | ७९ | |
| दक्ष प्रसुतिकर्मी/स्वास्थ्यकर्मीद्वारा प्रसुति गराएको प्रतिशत | ५४.८ | ५२.९ | ५९.५ | ८९.८ | ७५ | |
| प्रोटोकल अनुसार ४ पटक (आ.व २०७८/७९ सम्म ३ पटक) सुत्केरी जाँच गराउने आमाहरुको प्रतिशत | ४३.४ | ३७.४ | ५९.८ | ५३.७ | ४०.८ | |
| जम्मा मातृ मृत्यु संख्या | १ | ० | २ | ७४ | २३१ | |
| परिवार नियोजन सेवाका नयाँ सेवाग्राही दर (प्रजनन उमेरका महिलाहरु मध्ये) | ९.४ | १०.१ | ११ | १२.४ | ११.५ | |
| औलो रोग, क्षय रोग, कुष्ठरोग र एचआईभी |
ग्राफ
तालिका
|
|||||
| औलोको स्लाइड नमुना पोजेटिभ दर | ०.१५ | ०.१६ | ०.१६ | ०.२७ | ०.१७ | |
| डेंगुको जम्मा विरामी संख्या | ० | ० | ० | ० | ० | |
| आयातित औलोरोगको प्रतिशत (नयाँ औलो रोग मध्ये | ० | १०० | १०० | ९५.५ | ८९.५ | |
| जम्मा औलो रोग मध्ये प्लाज्मोडियम फाल्सिपारमको अनुपात | ० | ० | ० | ३८.७ | २२.८ | |
| नयाँ क्षयरोगी बिरामी पत्ता लागेको दर | ६१.५ | ९६ | १२५ | १५७.४ | १२९.१ | |
| क्षयरोगको उपचार सफलता दर | ९६ | ८३.३ | ९१.८ | ९१ | ९१.५ | |
| कुष्ठरोगको रोग प्रकोप दर (प्रति १०००० मा) | ०.२ | ०.५९ | ०.६१ | ०.९ | ० | |
| ए. आर. टी. उपचारमा रहेका जम्मा एच. आइ. भी. पोजेटिभको संख्या | ० | ० | ० | ४३२६ | २२१५२ | |
| उपचारात्मक सेवा |
ग्राफ
तालिका
|
|||||
| ओ पि डी मा आएका बिरामी मध्ये नयाँ बिरामीको दर | ७२.६ | ५९.७ | ६३.३ | ९४.५ | ९२ | |
शीर्ष १० स्वास्थ्य अवस्थाको सूची
स्वास्थ्य सूचना व्यवस्थापन प्रणाली २०७८७९स्वास्थ्य क्षेत्रमा बजेट
- सशर्त स्वास्थ्यमा छुट्याएको बजेट
- समानीकरणबाट विनियोजित स्वास्थ्य बजेट
- अन्य श्रोतबाट बिनियोजित स्वास्थ्य बजेट
| बजेट | ठाकुरबाबा नगरपालिका | |||||
|---|---|---|---|---|---|---|
| २०७६/७७ | २०७७/७८ | २०७८/७९ | ||||
| ग्राफ | ||||||
| पालिकाको कुल बजेट (रु ) | ६४४,६६४,००० | ७१२,०४९,१०६ | ६६१,०४८,९५१ | |||
| स्वास्थ्य बजेट (सबै स्रोत) | २८,७९३,००० | ३२,८००,००० | ५७,११५,४२६ | |||
| सशर्त स्वास्थ्यमा छुट्याएको बजेट | २३,७९३,००० | २७,३००,००० | २९,५००,००० | |||
| समानीकरणबाट विनियोजित स्वास्थ्य बजेट | ५,०००,००० | ५,५००,००० | २७,६१५,४२६ | |||
| अन्य श्रोतबाट बिनियोजित स्वास्थ्य बजेट | - | - | - | |||
| बजेट खर्च (%) | ९३ | ९७ | - | |||
| तालिका | ||||||
महत्वपूर्ण सम्पर्क
Thakurbaba Municipality
ठेगाना : ठाकुरबाबा नगरपालिका सैनवार बर्दिया
टेलिफोन : -/
वेबसाइट : http://thakurbabamun.gov.np/

यो प्रोफाइल अमेरिकी अन्तर्राष्ट्रिय विकास नियोग (युएसएआइडी) मार्फत अमेरिकी जनताहरुको सहयोगका कारण सम्भव बनेको हो । यो प्रतिवेदन भित्रका विषयवस्तु र सामग्री स्वास्थ्यका लागि सक्षम प्रणालीका एकल जिम्मेवारी हुन् र तिनले युएसएआइडी वा अमेरिकी सरकारको विचारको प्रतिविम्बित गर्छन् भन्ने जरुरी छैन ।