संक्षिप्त परिचय त्रिवेणी गाउँपालिका
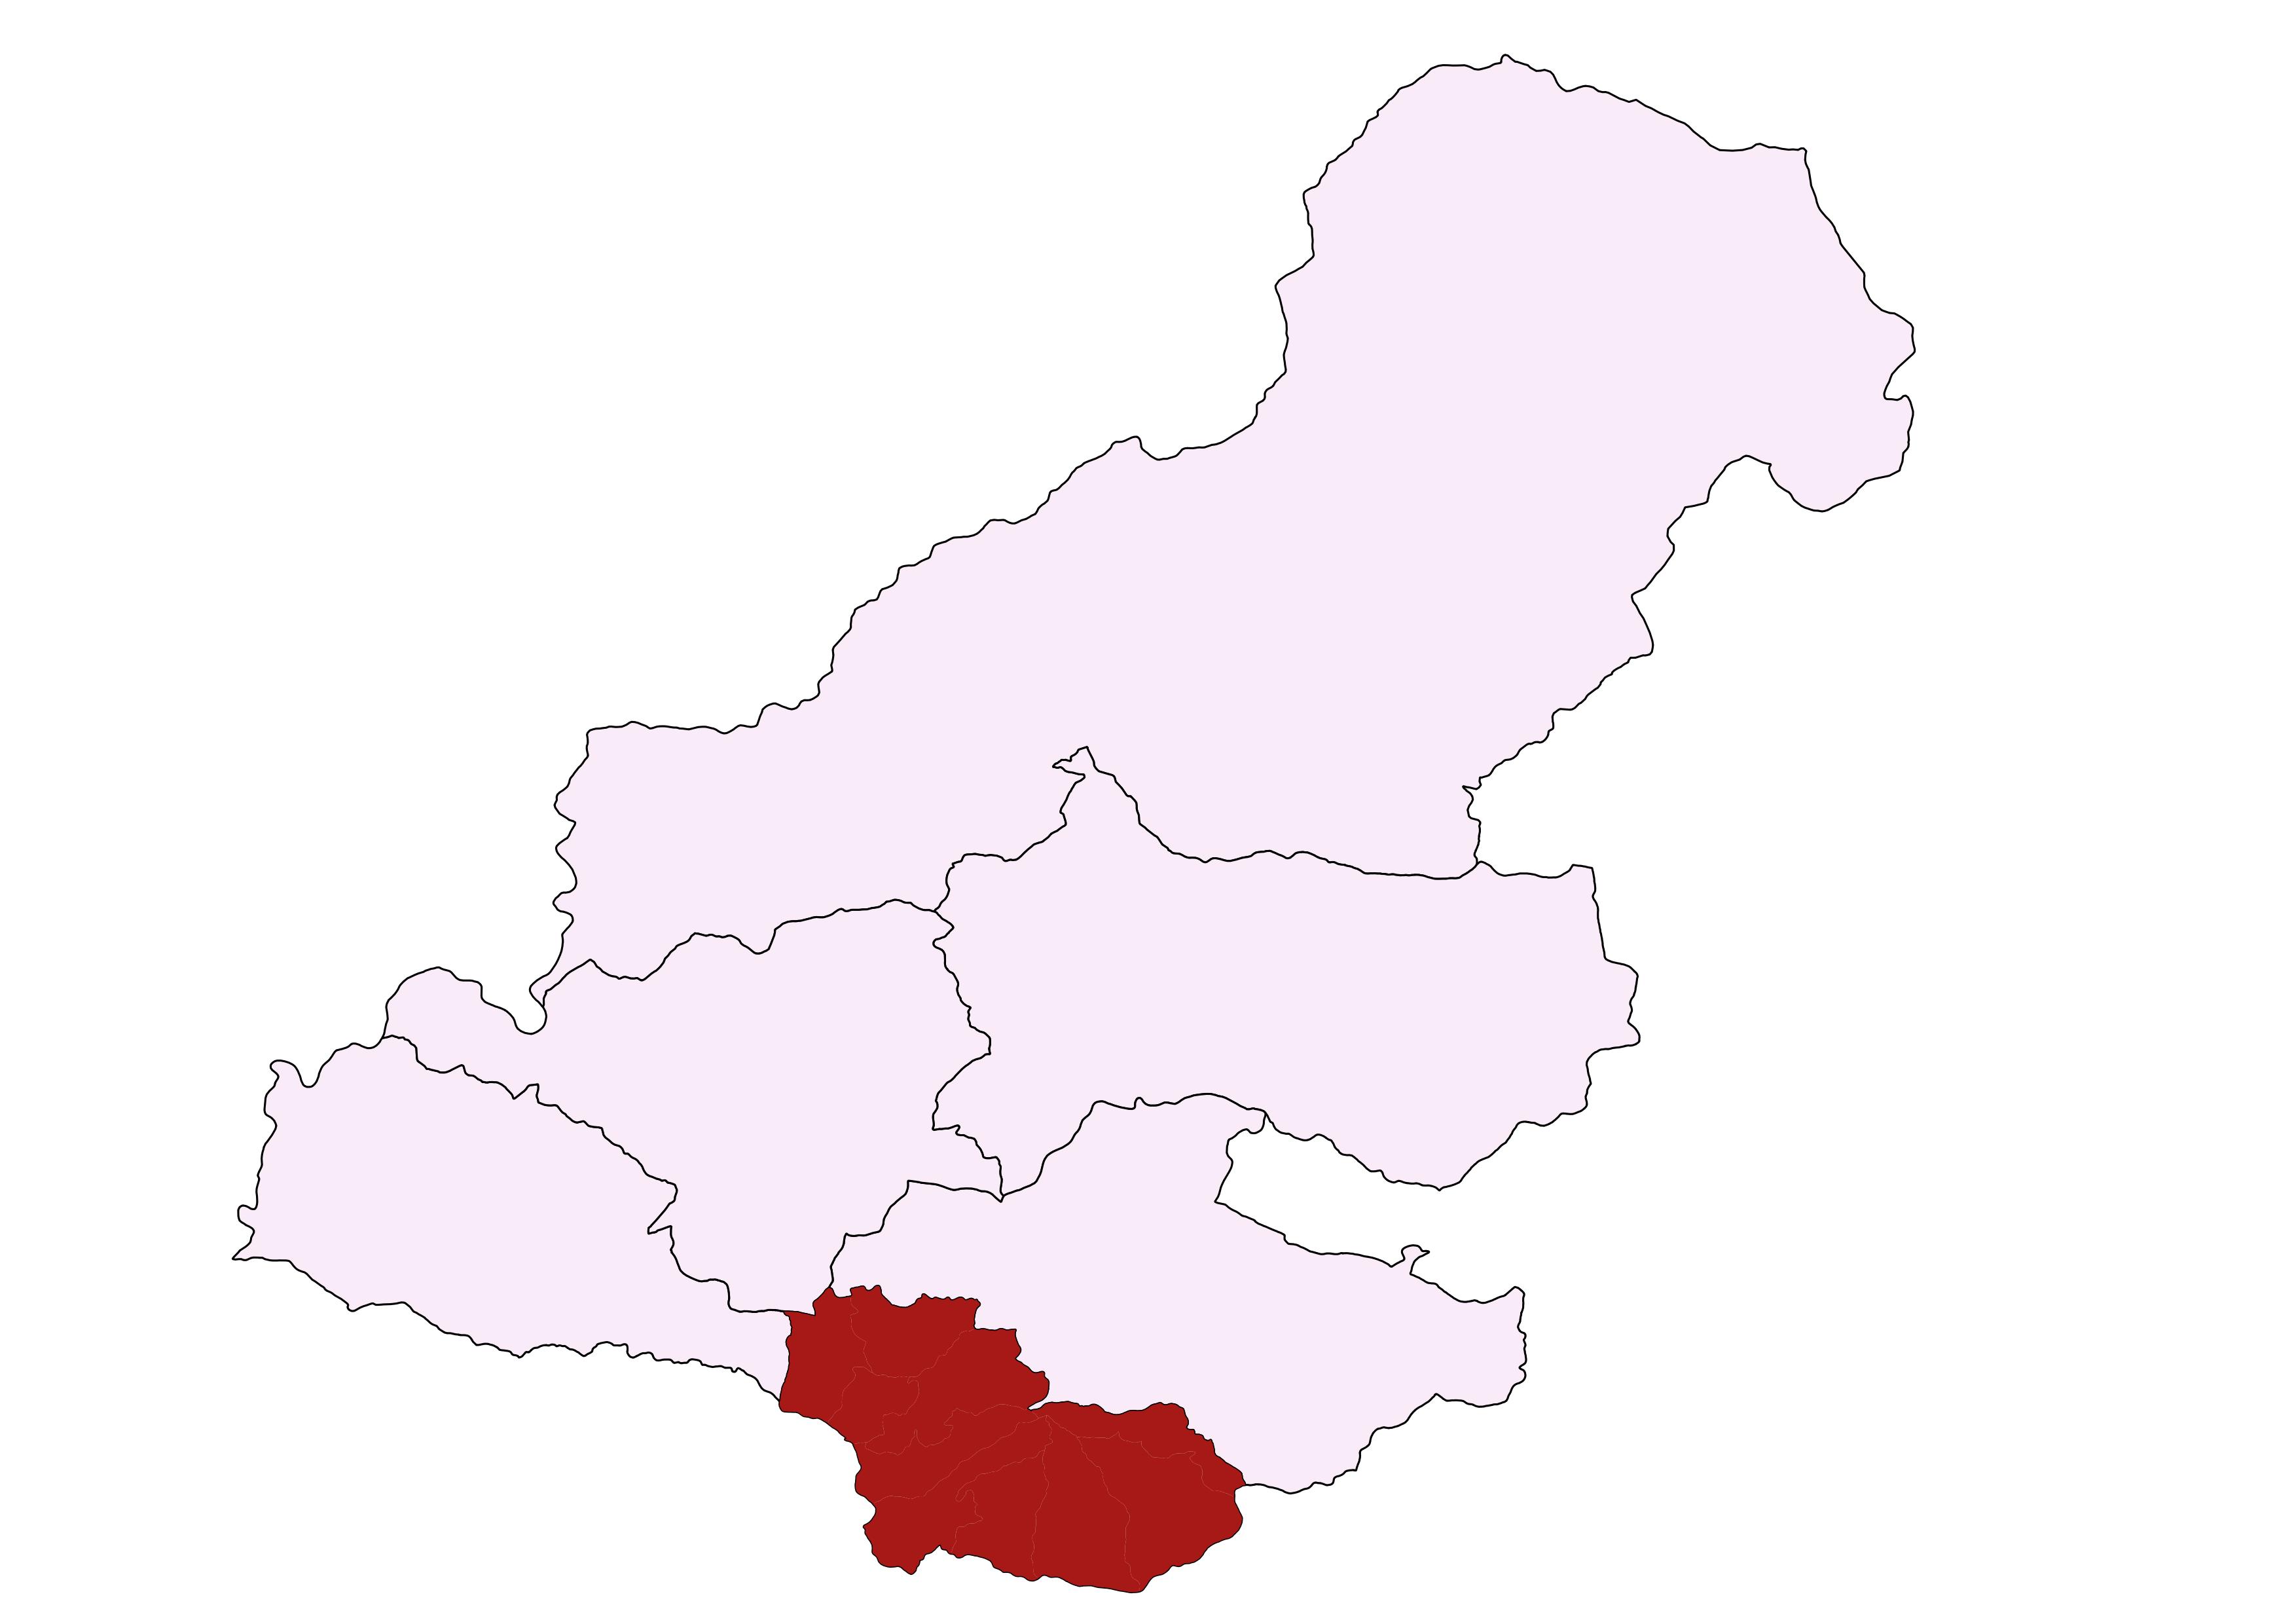
त्रिवेणी गाउँपालिका नेपालकाे संविधानकाे धारा २९५ काे उपधारा (३) बमाेजिम कायम भएका गाउँपालिका मध्येकाे एक हाे । रूघा, खारा, मुरूबाट बग्ने सबै खाेलाहरू एकिकृत भई सिम्रुतु पुगेर एकै ठाउँमा भेट हुने र साे स्थानलाई त्रिवेणी भन्ने गरीइएकाे कारणले यस गाउँपालिकाकाे नाम त्रिवेणी राखिएकाे हाे । साविकका गा.वि.स हरू रूघा, खारा, मुरू, पेउघा र नुवाकाेट (३) भु-भाग ओगटेर बनेकाे यस गाउँपालिकाकाे कुल क्षेत्रफल ८५.४९ वर्ग किलाेमिटर र यस गाउँपालिकाकाे जनसङ्ख्या १९५०४ रहेकाे छ ।समुन्द्र सतहबाट ११२५ मि. देखि २६८२ मि. सम्मकाे उचार्इमा रहेकाे यस गाउँपालिकाे पुर्वमा राेल्पा जिल्ला, पश्चिममा चाैरजहारी नगरपालिका र सानीभेरी गाउँपालिका, उत्तरमा मुसीकाेट नगरपालिका र दक्षिणमा सल्यान र राेल्पा जिल्ला पर्दछन ।
जनसाङ्खिक सूचक
-
कूल जनसंख्या १
२०,७४१
/ -
१ बर्ष भन्दा मुनिको जनसंख्या १
३९५
/ -
पाँच बर्ष भन्दा मुनिको जनसंख्या १
१,९३५
/ -
किशोरावस्था (१०-१९ बर्ष) को जनसंख्या १
४,०१२
/ -
प्रजनन उमेरका महिला (१५ -४९ बर्ष ) १
६,३५२
/ -
अनुमानित गर्भवती महिलाहरु १
४८०
/ -
अनुमानित जिवित जन्मको संख्या १
३७८
/ -
परिवारमा अनुपस्थित (विदेशमा बस्ने) जनसंख्या २
१,८१३
-
मोबाइल फोन भएका घरधुरी (%) २
४६
-
टेलिभिजन भएका घरधुरी (%) २
२
-
लैङ्गिक अनुपात २
८४
-
१४ बर्ष र सो भन्दा कम उमेरका जनसंख्या १
५,७३०
/ -
६५ बर्ष र सो भन्दा माथि उमेरका जनसंख्या २
७९९
उमेर र लिंगको आधारमा जनसंख्या वितरण
जनगणना २०६८जातिगत आधारमा जनसंख्या वितरण
जनगणना २०६८वार्ड अनुसार जनसंख्या वितरण
जनगणना २०६८स्वास्थ्य सेवा प्रवाह गर्ने संस्थाहरु

- अस्पताल १
- प्रास्वाके -
- स्वास्थ्य चौकी ४
- सामुदायिक स्वास्थ्य ईकाई २
- शहरी स्वास्थ्य केन्द्र -
- गाउँघर क्लिनिक ८
- खोप क्लिनिक १७
- आधारभूत स्वस्थ सेवाकेन्द्र ५
- बर्थिंग सेन्टर ५
सरकारी संस्था
- अस्पताल तथा नर्सिंग होम १
- पोलिक्लिनिक २
- औषधि पसल ३
निजी (गैर-सरकारी संस्था समेत)
अन्य स्वास्थ्य केन्द्रहरु
- माइक्रोस्कोपी केन्द्र १
- एआरटि केन्द्र -
- एचाईभी परीक्षण केन्द्र -
- क्षयरोग उपचार केन्द्र ५
- आयुर्वेद अस्पताल/केन्द्र १
- आँखा अस्पताल/केन्द्र -
अस्पताल शैयाहरू
- सार्वजनिक -
- निजी १५
वडा अनुसार स्वास्थ्य संस्थाको जानकारी
| स्वास्थ्यसंस्थाको नाम | वार्ड न | बर्थिंग सेन्टर BEONC/CEONC | महिला स्वास्थ्य स्वयं सेवक संख्या | दक्ष प्रसुतिकर्मी संख्या | परिवार नियोजन *सेवा | स्वीकृत दरबन्दी | दरबन्दी अनुसार पदपूर्ति | करारका कर्मचारी |
|---|---|---|---|---|---|---|---|---|
| त्रिवेणाी गाउँ पालिका हस्पिटल | ३ | बर्थिंग सेन्टर | ३ | ३ | ५ साधनहरू | ५ | ९ | ११ |
| सिम्रतु स्वास्थ्य चाैकी | २ | बर्थिंग सेन्टर | ४ | ३ | ५ साधनहरू | ५ | ५ | ३ |
| मुरू स्वास्थ्य चाैकी | ७ | बर्थिंग सेन्टर | ५ | २ | ५ साधनहरू | ५ | ५ | २ |
| खारा स्वास्थ्य चाैकी | ४ | बर्थिंग सेन्टर | ६ | १ | ४ साधनहरू | ५ | ५ | १ |
| पेउघा स्वास्थ्य चाैकी | ९ | बर्थिंग सेन्टर | ४ | ३ | ५ साधनहरू | ५ | ४ | ४ |
| रूघा | १ | - | ५ | - | ३ साधनहरू | - | १ | १ |
| िजबाङ | ५ | - | ३ | - | ३ साधनहरू | - | १ | २ |
| माझगाउ | ८ | - | ३ | - | ३ साधनहरू | - | १ | २ |
| चाैतारा | ९ | - | - | - | ३ साधनहरू | - | १ | २ |
| गैरीनेटा | २ | - | - | - | ३ साधनहरू | - | १ | १ |
| बरनेटी | १० | - | ३ | - | ३ साधनहरू | - | २ | २ |
| घोडेढुंगा | ६ | - | ४ | - | ३ साधनहरू | - | १ | १ |
| कुल कर्मचारी संख्या | ४० | १२ | २५ | ३६ | ३२ | |||
स्वास्थ्य सेवाको लागि मानव संसाधन
- CEONC साइटहरू-
- BEONC साइटहरू-
- आइयुसीडी तथा इम्पलान्ट सेवा प्रदायक७
- एकीकृत बालरोग व्यवस्थापन (IMCI) प्रशिक्षित कर्मचारी२५
- जनसंख्या (प्रति मस्वास्वका) ५१९
- जनसंख्या (प्रति स्वास्थ्यकर्मी) ५७६
- अनुमानित गर्भवति (प्रति दक्ष प्रसुतिकर्मी) ४०
- अनुमानित गर्भवति (प्रति बर्थिङ्ग सेन्टर) ९६
- जनसंख्या (प्रति स्वास्थ्य संस्था) (अस्पताल,प्रस्वाके र स्वाचौ सहित) -
- जनसंख्या (प्रति सरकारी अस्पताल) २०७४१
- जनसंख्या (प्रति अस्पताल र नर्सिंग होम (सबै) १०३७१
मातृशिशु बालस्वास्थ्य र परिवार नियोजन सेवा उपयोगको अवस्था
स्वास्थ्य सूचना व्यवस्थापन प्रणाली २०७८प्रमूख स्वास्थ्य सेवाहरूको उपयोगको तुलनात्मक अवस्था
| सूचक | त्रिवेणी गाउँपालिका | कर्णाली प्रदेश २०७८/७९ | राष्ट्रीय २०७८/७९ | |||
|---|---|---|---|---|---|---|
| २०७६/७७ | २०७७/७८ | २०७८/७९ | ||||
| खाेप |
ग्राफ
तालिका
|
|||||
| बि.सि.जि. कभरेज | ९२.६ | १०७ | १०८.९ | ९२ | १०३.५ | |
| २३ महिनाभित्र पूर्ण खोप प्राप्त गरेका बालबालिका (%) | ० | ० | ० | ० | ० | |
| डि.पि.टि. - हेप बि - हिव ३ कभरेज | १०० | १०७ | १०६.६ | ९४ | ९५.२ | |
| दादुरा रूबेला १ (९-११ महिना) कभरेज | ८९.६ | ९९ | ११३ | ९५ | ९४.७ | |
| जे.इ कभरेज | १०५.१ | १२२ | ११८.५ | ९६ | ९५.९ | |
| टि.डी. २ र टि. डी. २+ कभरेज | ८३.६ | ८३ | ७२.६ | ६६ | ७१.७ | |
| पोषण |
ग्राफ
तालिका
|
|||||
| कम जन्म तौल भएका नवजात शिशुको प्रतिशत | २.७ | ७ | ३.९ | ६.८ | ९.४ | |
| नयाँ तौल लिएका १ वर्ष मुनिका शिशुहरुको प्रतिशत | १११ | १०६.२ | १३६.१ | १२० | १०४.१ | |
| नयाँ तौल लिएका २ वर्ष मुनिका शिशुहरु मध्ये अति जोखिम अवस्थाका बालबालिकाहरुको प्रतिशत | १.९ | ०.७ | ०.४ | ४.१ | ३.६ | |
| गर्भवती अवस्थामा १८० दिन आइरन चक्की प्राप्त गरेका गर्भवती महिलाहरुको प्रतिशत | ५१.२ | ६४ | ६५ | ७३ | ६० | |
| सुत्केरी अवस्थामा भिटामिन ए प्राप्त गरेका महिलाहरुको प्रतिशत | ६०.१ | ७०.१ | ८६.५ | ८८ | ७६.३ | |
| नवजात शिशु तथा बाल रोगको एकीकृत व्यस्थापन |
ग्राफ
तालिका
|
|||||
| नाभी मलम लगाएका नवजात शिशुको प्रतिशत | ९२.२ | ८८ | ९१.७ | ९६ | ८२.९ | |
| ब्याक्टेरियाको गम्भीर संक्रमण भएकामध्ये जेन्टामाईसिन सुईद्वारा पूर्ण उपचार पाएको प्रतिशत | ६३.६ | ५० | ४३.२ | ७५ | ४७.४ | |
| नयाँ निमोनिया बिरामीको दर (प्रति हजार पाँच वर्षमुनिका बालबालिकाहरुमा) | २१७.६ | १५३.७ | १९५.५ | ११३ | ३६.८ | |
| नयाँ एआरआई (स्वाशप्रश्वाका) बिरामी मध्ये कडा निमोनिया भएका बिरामीको प्रतिशत | ०.२९ | ०.१४ | ०.४१ | ०.४१ | ०.१८ | |
| नयाँ झाडापखालाका बिरामीको दर (प्रति हजार पाँच वर्ष मुनिका बालबालिकाहरुमा) | ३२२ | ४४१.८ | ३५८.४ | ५७९ | ३५२.४ | |
| ५ वर्ष मुनिका झाडापखालाका बिरामी मध्ये जिंक र पुनर्जलीय झोलबाट उपचार गरेको प्रतिशत | १०० | १०० | १०० | ९५ | ९४.५ | |
| जम्मा नवजात शिशु मृत्यु संख्या | १ | ० | ५ | १९९ | १९१४ | |
| सुरक्षित मातृत्व तथा परिवार नियोजन |
ग्राफ
तालिका
|
|||||
| प्परोटोकल अनुसार पहिलो पटक गर्भवती जाँच गराएका गर्भवती महिलाहरुको प्रतिशत | ७८.७ | ९६.५ | ९८.२ | १२२ | ९१.४ | |
| प्रजनन् उमेरका महिलाहरुमा परिवार नियोजनको प्रयोगकर्ता दर (आधुनिक साधन) | ० | ० | ० | ० | ० | |
| ४ पटक गर्भवती जाँच (महिना: ४,६,८,९/हप्ता: १६, २०-२४,३२ र ३६) महिलाहरुको प्रतिशत | ५२.७ | ८४.९ | ९८.२ | ७३ | ७९.४ | |
| स्वास्थ्य संस्था प्रसुति दर | ५२.७ | ६३.९ | ७८.५ | ८३ | ७९ | |
| दक्ष प्रसुतिकर्मी/स्वास्थ्यकर्मीद्वारा प्रसुति गराएको प्रतिशत | ५२.७ | ६१.९ | ७४.९ | ७० | ७५ | |
| प्रोटोकल अनुसार ४ पटक (आ.व २०७८/७९ सम्म ३ पटक) सुत्केरी जाँच गराउने आमाहरुको प्रतिशत | १५ | १९ | ५८.३ | ५३ | ४०.८ | |
| जम्मा मातृ मृत्यु संख्या | ० | ० | ० | १७ | २३१ | |
| परिवार नियोजन सेवाका नयाँ सेवाग्राही दर (प्रजनन उमेरका महिलाहरु मध्ये) | १८.२ | १८.६ | २८.४ | १९ | ११.५ | |
| औलो रोग, क्षय रोग, कुष्ठरोग र एचआईभी |
ग्राफ
तालिका
|
|||||
| औलोको स्लाइड नमुना पोजेटिभ दर | ० | ० | ० | ०.२५ | ०.१७ | |
| डेंगुको जम्मा विरामी संख्या | ० | ० | ० | ० | ० | |
| आयातित औलोरोगको प्रतिशत (नयाँ औलो रोग मध्ये | ० | ० | ० | ६३ | ८९.५ | |
| जम्मा औलो रोग मध्ये प्लाज्मोडियम फाल्सिपारमको अनुपात | ० | ० | ० | २.१ | २२.८ | |
| नयाँ क्षयरोगी बिरामी पत्ता लागेको दर | २८.३ | ४२ | ५८.४ | ९७ | १२९.१ | |
| क्षयरोगको उपचार सफलता दर | ७१.७ | १०० | ८७.५ | ९१ | ९१.५ | |
| कुष्ठरोगको रोग प्रकोप दर (प्रति १०००० मा) | ० | ० | ० | ०.५ | ० | |
| ए. आर. टी. उपचारमा रहेका जम्मा एच. आइ. भी. पोजेटिभको संख्या | ० | ० | ० | ६९१ | २२१५२ | |
| उपचारात्मक सेवा |
ग्राफ
तालिका
|
|||||
| ओ पि डी मा आएका बिरामी मध्ये नयाँ बिरामीको दर | ९८.८ | ८४.३ | १११.९ | १०५ | ९२ | |
शीर्ष १० स्वास्थ्य अवस्थाको सूची
स्वास्थ्य सूचना व्यवस्थापन प्रणाली २०७८०७९स्वास्थ्य क्षेत्रमा बजेट
- सशर्त स्वास्थ्यमा छुट्याएको बजेट
- समानीकरणबाट विनियोजित स्वास्थ्य बजेट
- अन्य श्रोतबाट बिनियोजित स्वास्थ्य बजेट
| बजेट | त्रिवेणी गाउँपालिका | |||||
|---|---|---|---|---|---|---|
| २०७७/७८ | २०७८/७९ | २०७९/८० | ||||
| ग्राफ | ||||||
| पालिकाको कुल बजेट (रु ) | ४७६,२१२,००० | ४७०,०००,००० | ४९३,५६५,४२२ | |||
| स्वास्थ्य बजेट (सबै स्रोत) | ३४,७८८,००० | ३९,८३२,००० | २९,७००,००० | |||
| सशर्त स्वास्थ्यमा छुट्याएको बजेट | २७,१८८,००० | ३६,२३२,००० | २४,९००,००० | |||
| समानीकरणबाट विनियोजित स्वास्थ्य बजेट | ७,६००,००० | ३,६००,००० | ४,६००,००० | |||
| अन्य श्रोतबाट बिनियोजित स्वास्थ्य बजेट | - | २००,००० | ||||
| बजेट खर्च (%) | ९६ | - | - | |||
| तालिका | ||||||
महत्वपूर्ण सम्पर्क
Tribeni Rural Municipality
ठेगाना : त्रिवेणी गाउँपालिका
टेलिफोन : -
वेबसाइट : www.trivenimunrukum.gov.np
सूचना तथा प्रविधी
नाम : युवराज गिरी
सम्पर्क : ९८०१९४७६९१
ईमेल : info@trivenimunrukum.gov.np , ito.trivenimunrukum@gmail.com

यो प्रोफाइल अमेरिकी अन्तर्राष्ट्रिय विकास नियोग (युएसएआइडी) मार्फत अमेरिकी जनताहरुको सहयोगका कारण सम्भव बनेको हो । यो प्रतिवेदन भित्रका विषयवस्तु र सामग्री स्वास्थ्यका लागि सक्षम प्रणालीका एकल जिम्मेवारी हुन् र तिनले युएसएआइडी वा अमेरिकी सरकारको विचारको प्रतिविम्बित गर्छन् भन्ने जरुरी छैन ।