संक्षिप्त परिचय नलगाड नगरपालिका
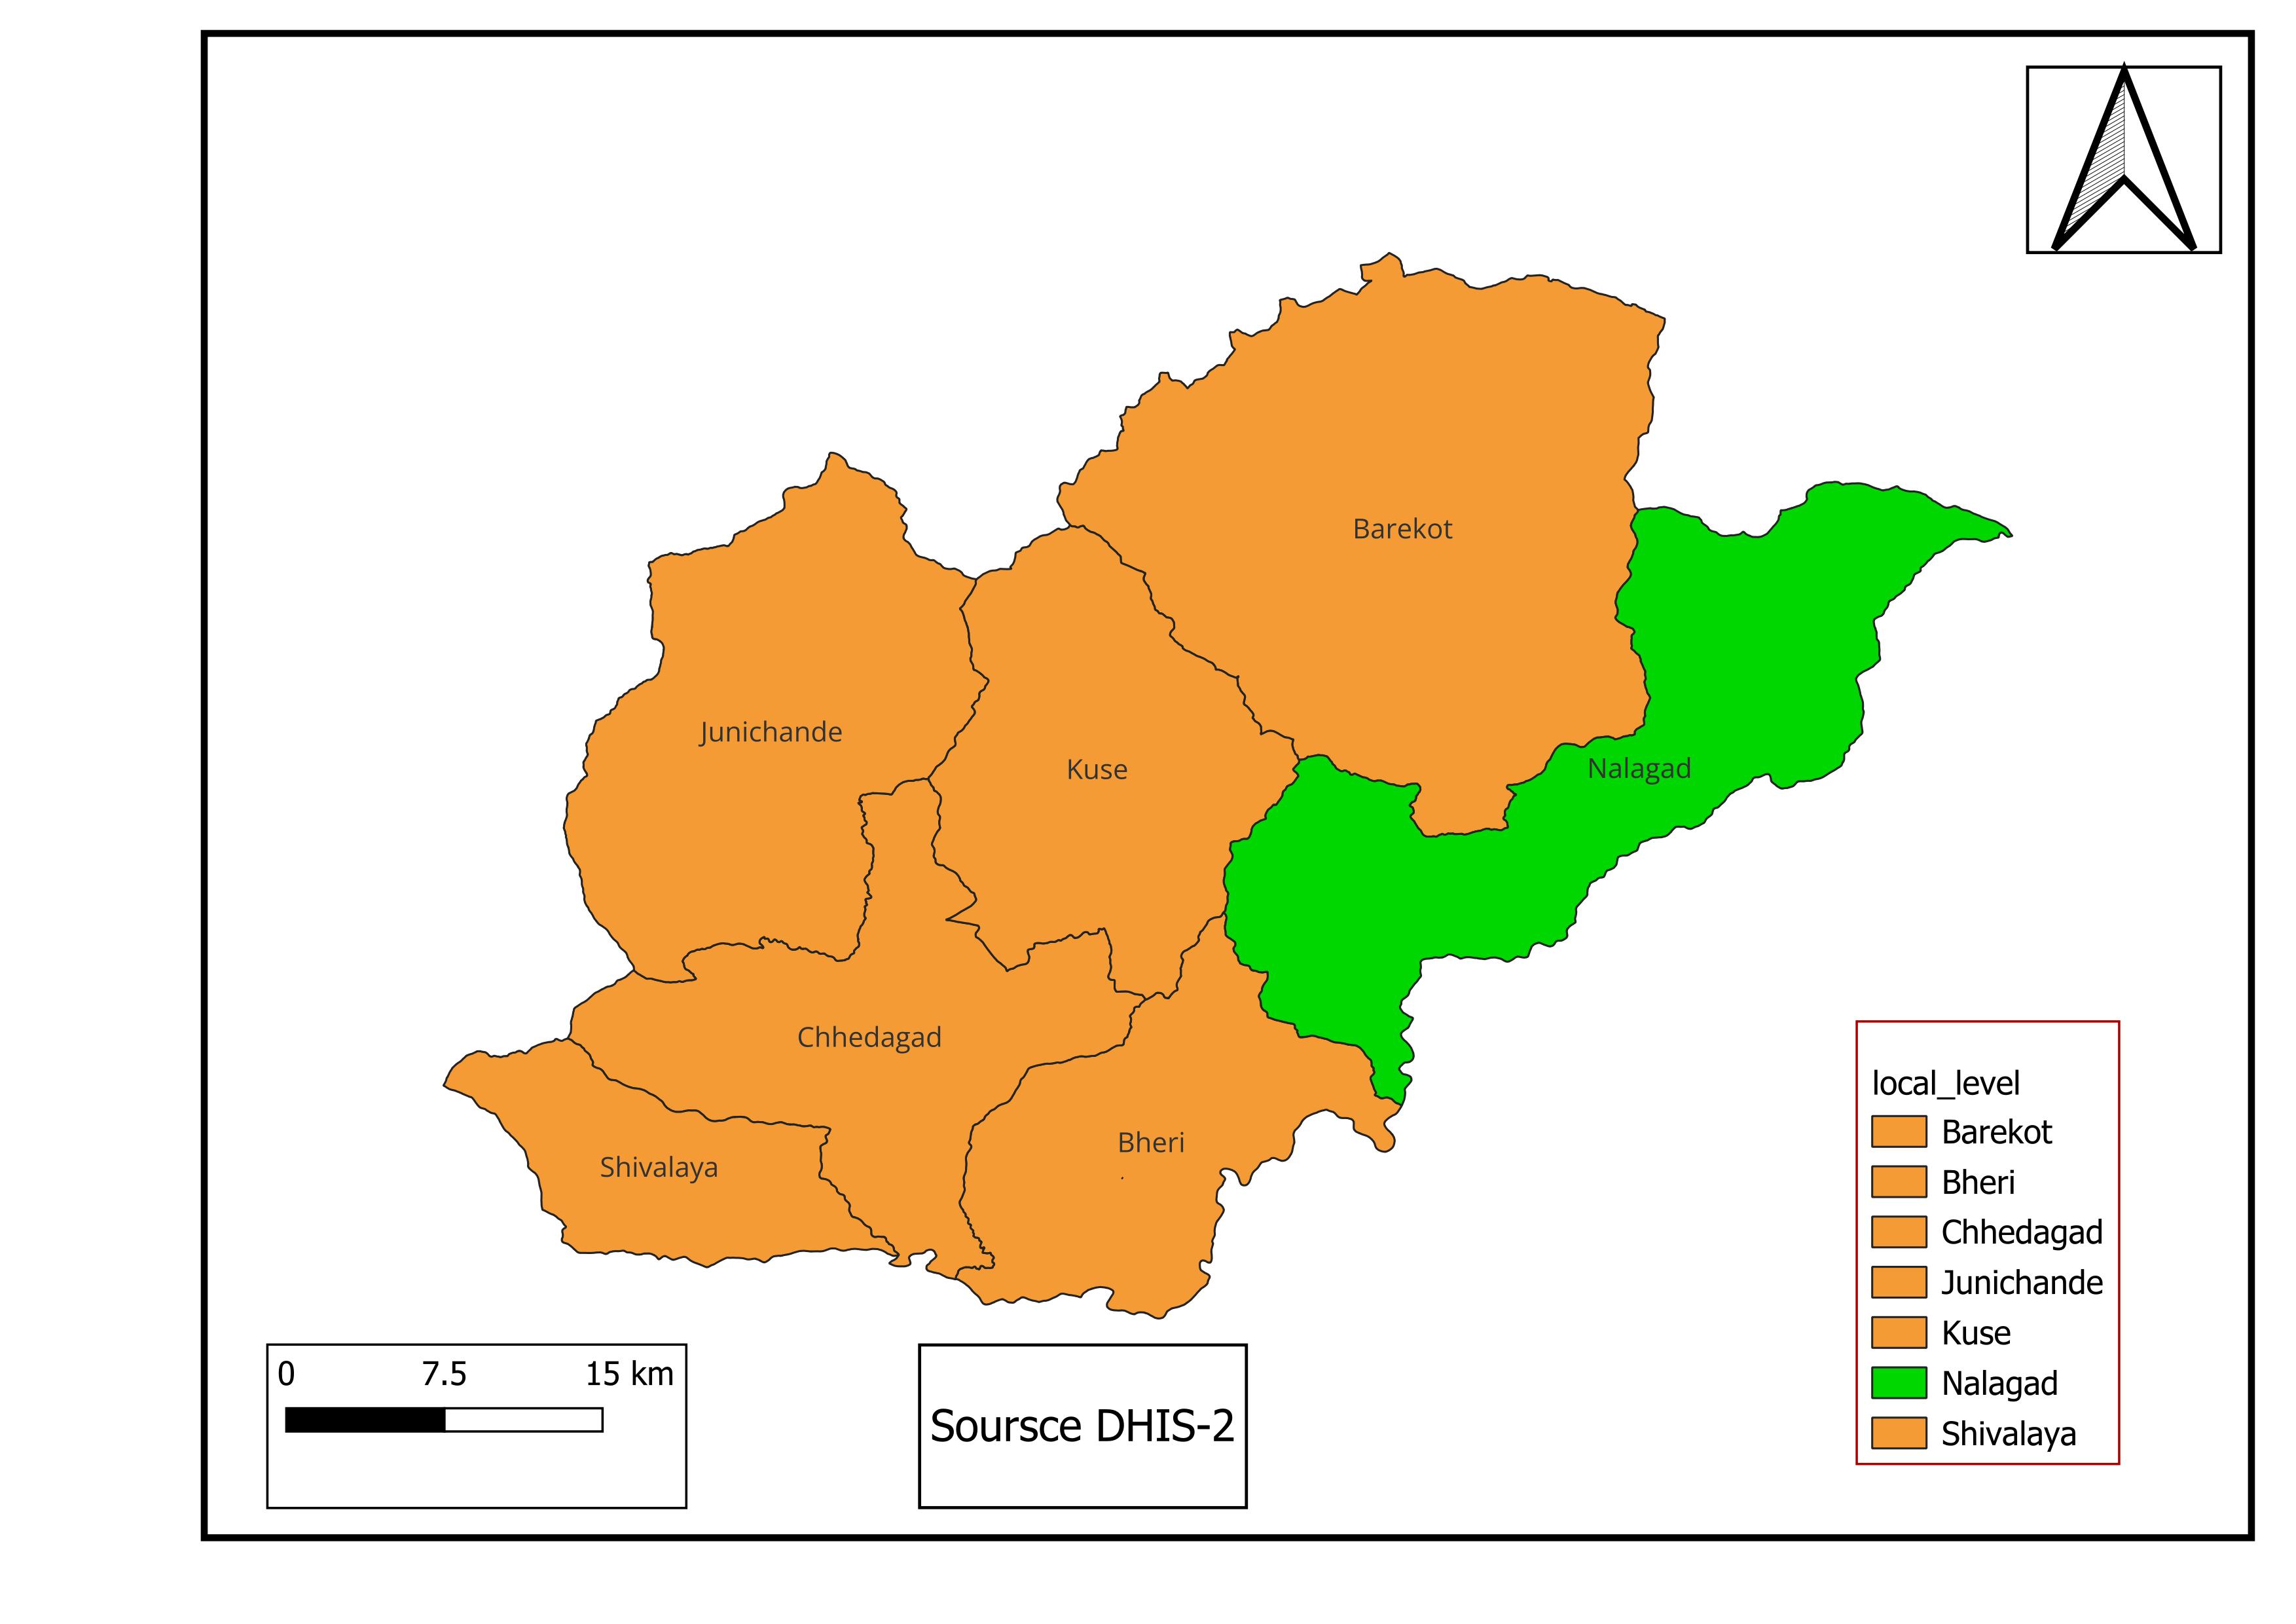
नेपाल सरकारको घना वस्ती भएको क्षेत्रहरुलाई जनसंख्याको आधारमा नगरपालिकाको रुप दिई क्रमिक गतिमा भौतिक सुविधा सम्पन्न वनाई स्थानीय आर्थिक गतिविधिको केन्द्रको रुपमा विकास गर्ने नीति अनुरुप वि.स. २०७३ सालमा नलगाड नगरपालिकाको स्थापना भएको हो । यस नगरपालिकाको संरचना साविकका डाँडागाउँ लहँ खगेनकोट रग्दा र भगवती गा.वि.स. लाई मिलाएर नलगाड खाेलाको नामबाट नामाकरण गरी नगरपालिकाको नाम नलगाड नगरपालिका रहन गएको हो । यस नगरपालिकाको क्षेत्रफल ३८७.४४ व कि.मि. रहेको छ । जुन जाजरकोट जील्लामा रहेका नगरपालीका मध्ये क्षेत्रफलको आधारमा सबैभन्दा ठुलो नगरपालिका हो । यहाँको कुल जनसंख्या २५,५९७ रहेको छ । यस नगरपालिकामा जम्मा १३ वटा वडाहरु रहेका छन् । यस नगरपालिकाको केन्द्र साविक खगेकोट गा.वि.स. को कार्यालय रहेको छ भने सीमाना पूर्वमा रुकुम जिल्ला, पश्चिममा कुसे गा.पा., उत्तरमा बारेकोट गा.पा. र डोल्पा जिल्ला रहनुको साथै दक्षिणमा भेरी नगरपालिका रहेको छ ।
जनसाङ्खिक सूचक
-
कूल जनसंख्या १
२९,४१४
/ -
१ बर्ष भन्दा मुनिको जनसंख्या १
५९७
/ -
पाँच बर्ष भन्दा मुनिको जनसंख्या १
३,५५१
/ -
किशोरावस्था (१०-१९ बर्ष) को जनसंख्या १
६,५५४
/ -
प्रजनन उमेरका महिला (१५ -४९ बर्ष ) १
७,६०९
/ -
अनुमानित गर्भवती महिलाहरु १
८५७
/ -
अनुमानित जिवित जन्मको संख्या १
६८०
/ -
परिवारमा अनुपस्थित (विदेशमा बस्ने) जनसंख्या २
१,०१४
-
मोबाइल फोन भएका घरधुरी (%) २
२१
-
टेलिभिजन भएका घरधुरी (%) २
३
-
लैङ्गिक अनुपात २
९९
-
१४ बर्ष र सो भन्दा कम उमेरका जनसंख्या २
११,६३९
-
६५ बर्ष र सो भन्दा माथि उमेरका जनसंख्या २
७२३
उमेर र लिंगको आधारमा जनसंख्या वितरण
जनगणना २०७८जातिगत आधारमा जनसंख्या वितरण
जनगणना २०७८वार्ड अनुसार जनसंख्या वितरण
स्थानीय तह २०७८स्वास्थ्य सेवा प्रवाह गर्ने संस्थाहरु

- अस्पताल १
- प्रास्वाके -
- स्वास्थ्य चौकी ५
- सामुदायिक स्वास्थ्य ईकाई ५
- शहरी स्वास्थ्य केन्द्र -
- गाउँघर क्लिनिक ९
- खोप क्लिनिक २२
- आधारभूत स्वस्थ सेवाकेन्द्र ७
- बर्थिंग सेन्टर ९
सरकारी संस्था
- अस्पताल तथा नर्सिंग होम -
- पोलिक्लिनिक -
- औषधि पसल ११
निजी (गैर-सरकारी संस्था समेत)
अन्य स्वास्थ्य केन्द्रहरु
- माइक्रोस्कोपी केन्द्र ३
- एआरटि केन्द्र -
- एचाईभी परीक्षण केन्द्र -
- क्षयरोग उपचार केन्द्र ६
- आयुर्वेद अस्पताल/केन्द्र १
- आँखा अस्पताल/केन्द्र -
अस्पताल शैयाहरू
- सार्वजनिक ५
- निजी -
थप सेवाहरू
- कम्प्युटर वा ल्यापटप भएका स्वास्थ्य संस्था १७
- इण्टरनेट सुविधा भएका स्वास्थ्य संस्था संख्या ६
- बिद्धुतको उपलब्धता भएका स्वास्थ्य संस्था संख्या ३
- सोलार ब्याकअप जडान भएका स्वास्थ्य संस्था संख्या ५
वडा अनुसार स्वास्थ्य संस्थाको जानकारी
| स्वास्थ्यसंस्थाको नाम | वार्ड न | बर्थिंग सेन्टर BEONC/CEONC | महिला स्वास्थ्य स्वयं सेवक संख्या | दक्ष प्रसुतिकर्मी संख्या | परिवार नियोजन *सेवा | स्वीकृत दरबन्दी | दरबन्दी अनुसार पदपूर्ति | करारका कर्मचारी |
|---|---|---|---|---|---|---|---|---|
| डाडा गाउँ क स्वास्थ्य चौकी | २ | बर्थिंग | २ | १ | ३ साधनहरू | ५ | ४ | १ |
| डाडा गाउँ ख स्वास्थ्य चौकी | ३ | बर्थिंग सेन्टर | ४ | २ | ४ साधनहरू | ५ | ४ | २ |
| लाहा स्वास्थ्य चौकी | ४ | बर्थिंग सेन्टर | ४ | २ | ३ साधनहरू | ५ | ३ | ३ |
| दल्ली प्रा स्वा केन्द्र | ७ | बि इ ओ एन सी | ९ | ५ | ५ साधनहरू | १० | ७ | ५ |
| रग्दा स्वास्थ्य चौकी | १० | बर्थिंग सेन्टर | ३ | २ | ३ साधनहरू | ५ | ४ | २ |
| भगवति स्वास्थ्य चौकी | १२ | बर्थिंग सेन्टर | ९ | २ | ३ साधनहरू | ५ | ४ | १ |
| आयुर्वेद औषधालय | ४ | - | ० | ० | ३ साधनहरू | २ | ० | २ |
| आधारभुत स्वास्थ्य सेवा केन्द्र, आनापानी | १ | बर्थिंग सेन्टर | ३ | ० | ३ साधनहरू | २ | ० | २ |
| आधारभुत स्वास्थ्य सेवा केन्द्र, भार गाउँ | ६ | -बर्थिंग से | ३ | ० | ३ साधनहरू | २ | २ | ० |
| आधारभुत स्वास्थ्य सेवा केन्द्र, सिर्के | ५ | - | २ | ० | ३ साधनहरू | २ | ० | २ |
| आधारभुत स्वास्थ्य सेवा केन्द्र, जिकुवा | ८ | - | ० | ० | ३ साधनहरू | २ | ० | २ |
| आधारभुत स्वास्थ्य सेवा केन्द्र, तान्त्रा | ९ | - | ३ | ० | ३ साधनहरू | २ | ० | २ |
| आधारभुत स्वास्थ्य सेवा केन्द्र, घ्यारगाउ | १० | - | ३ | ० | ३ साधनहरू | २ | ० | २ |
| रावत गाउँ सामुदायिक इकाई | १० | बर्थिंग से | ० | ० | ३ साधनहरू | २ | ० | २ |
| आधारभुत स्वास्थ्य सेवा केन्द्र, तल्लुबगर | १२ | - | ० | ० | ३ साधनहरू | २ | ० | २ |
| खातिगुर्ता सामुदायिक इकाई | १३ | - | ० | ० | ३ साधनहरू | २ | ० | २ |
| सिउना सामुदायिक इकाई | १३ | - | ० | ० | ३ साधनहरू | २ | ० | २ |
| कट्के सामुदायिक इकाई | ३ | - | ० | ० | ३ साधनहरू | २ | ० | १ |
| कुल कर्मचारी संख्या | ४५ | १४ | ५९ | २८ | ३५ | |||
स्वास्थ्य सेवाको लागि मानव संसाधन
- CEONC साइटहरू-
- BEONC साइटहरू१
- आइयुसीडी तथा इम्पलान्ट सेवा प्रदायक१
- एकीकृत बालरोग व्यवस्थापन (IMCI) प्रशिक्षित कर्मचारी११
- जनसंख्या (प्रति मस्वास्वका) ६५४
- जनसंख्या (प्रति स्वास्थ्यकर्मी) १०५१
- अनुमानित गर्भवति (प्रति दक्ष प्रसुतिकर्मी) ६१
- अनुमानित गर्भवति (प्रति बर्थिङ्ग सेन्टर) ९५
- जनसंख्या (प्रति स्वास्थ्य संस्था) (अस्पताल,प्रस्वाके र स्वाचौ सहित) -
- जनसंख्या (प्रति सरकारी अस्पताल) २९४१४
- जनसंख्या (प्रति अस्पताल र नर्सिंग होम (सबै) २९४१४
मातृशिशु बालस्वास्थ्य र परिवार नियोजन सेवा उपयोगको अवस्था
स्वास्थ्य सूचना व्यवस्थापन प्रणाली २०८०प्रमूख स्वास्थ्य सेवाहरूको उपयोगको तुलनात्मक अवस्था
| सूचक | नलगाड नगरपालिका | कर्णाली प्रदेश २०७८/७९ | राष्ट्रीय २०७८/७९ | |||
|---|---|---|---|---|---|---|
| २०७९/८० | २०७७/७८ | २०७८/७९ | ||||
| खाेप |
ग्राफ
तालिका
|
|||||
| बि.सि.जि. कभरेज | ९४.३ | ११६ | ९५.८ | ९२ | १०३.५ | |
| २३ महिनाभित्र पूर्ण खोप प्राप्त गरेका बालबालिका (%) | ८५.४ | ९४.२ | ९२.९ | ० | ० | |
| डि.पि.टि. - हेप बि - हिव ३ कभरेज | ८९.३ | ११५ | ९५.३ | ९४ | ९५.२ | |
| दादुरा रूबेला १ (९-११ महिना) कभरेज | ८६.६ | ११२.८ | ९१.२ | ९५ | ९४.७ | |
| जे.इ कभरेज | ७५.७ | ९८.७ | ७४.८ | ९६ | ९५.९ | |
| टि.डी. २ र टि. डी. २+ कभरेज | ६५.६ | ७९ | ७४. | ६६ | ७१.७ | |
| पोषण |
ग्राफ
तालिका
|
|||||
| कम जन्म तौल भएका नवजात शिशुको प्रतिशत | ५.७४ | ८.३३ | ८.९५ | ६.८ | ९.४ | |
| नयाँ तौल लिएका १ वर्ष मुनिका शिशुहरुको प्रतिशत | ११५ | १०८ | १४९ | १२० | १०४.१ | |
| नयाँ तौल लिएका २ वर्ष मुनिका शिशुहरु मध्ये अति जोखिम अवस्थाका बालबालिकाहरुको प्रतिशत | २.८ | २.९ | २.२ | ४.१ | ३.६ | |
| गर्भवती अवस्थामा १८० दिन आइरन चक्की प्राप्त गरेका गर्भवती महिलाहरुको प्रतिशत | ८१.३ | ६० | ५५ | ७३ | ६० | |
| सुत्केरी अवस्थामा भिटामिन ए प्राप्त गरेका महिलाहरुको प्रतिशत | १०० | ० | ० | ८८ | ७६.३ | |
| नवजात शिशु तथा बाल रोगको एकीकृत व्यस्थापन |
ग्राफ
तालिका
|
|||||
| नाभी मलम लगाएका नवजात शिशुको प्रतिशत | १०० | १०० | ९९.७ | ९६ | ८२.९ | |
| ब्याक्टेरियाको गम्भीर संक्रमण भएकामध्ये जेन्टामाईसिन सुईद्वारा पूर्ण उपचार पाएको प्रतिशत | ५० | ५० | १०० | ७५ | ४७.४ | |
| नयाँ निमोनिया बिरामीको दर (प्रति हजार पाँच वर्षमुनिका बालबालिकाहरुमा) | ६७ | ९९ | १०४ | ११३ | ३६.८ | |
| नयाँ एआरआई (स्वाशप्रश्वाका) बिरामी मध्ये कडा निमोनिया भएका बिरामीको प्रतिशत | ० | ३४६ | २७२ | ०.४१ | ०.१८ | |
| नयाँ झाडापखालाका बिरामीको दर (प्रति हजार पाँच वर्ष मुनिका बालबालिकाहरुमा) | २६४ | ३४६ | ९९ | ५७९ | ३५२.४ | |
| ५ वर्ष मुनिका झाडापखालाका बिरामी मध्ये जिंक र पुनर्जलीय झोलबाट उपचार गरेको प्रतिशत | १०० | १०० | ९९ | ९५ | ९४.५ | |
| जम्मा नवजात शिशु मृत्यु संख्या | ० | ० | ६ | १९९ | १९१४ | |
| सुरक्षित मातृत्व तथा परिवार नियोजन |
ग्राफ
तालिका
|
|||||
| प्परोटोकल अनुसार पहिलो पटक गर्भवती जाँच गराएका गर्भवती महिलाहरुको प्रतिशत | ५९.९ | ७२ | ७२ | १२२ | ९१.४ | |
| प्रजनन् उमेरका महिलाहरुमा परिवार नियोजनको प्रयोगकर्ता दर (आधुनिक साधन) | ३३.८ | ३२ | ३७ | ० | ० | |
| ४ पटक गर्भवती जाँच (महिना: ४,६,८,९/हप्ता: १६, २०-२४,३२ र ३६) महिलाहरुको प्रतिशत | ७७.६ | २१ | २५ | ७३ | ७९.४ | |
| स्वास्थ्य संस्था प्रसुति दर | ६२.४ | ६६.३ | ५५ | ८३ | ७९ | |
| दक्ष प्रसुतिकर्मी/स्वास्थ्यकर्मीद्वारा प्रसुति गराएको प्रतिशत | ९.१ | २२.१ | ९ | ७० | ७५ | |
| प्रोटोकल अनुसार ४ पटक (आ.व २०७८/७९ सम्म ३ पटक) सुत्केरी जाँच गराउने आमाहरुको प्रतिशत | ६७ | ५१ | ८५ | ५३ | ४०.८ | |
| जम्मा मातृ मृत्यु संख्या | ० | ० | ० | १७ | २३१ | |
| परिवार नियोजन सेवाका नयाँ सेवाग्राही दर (प्रजनन उमेरका महिलाहरु मध्ये) | ५१.७ | ० | ३४ | १९ | ११.५ | |
| औलो रोग, क्षय रोग, कुष्ठरोग र एचआईभी |
ग्राफ
तालिका
|
|||||
| औलोको स्लाइड नमुना पोजेटिभ दर | ५१.७ | ५१ | ८३ | ०.२५ | ०.१७ | |
| डेंगुको जम्मा विरामी संख्या | ० | ० | ० | ० | ० | |
| आयातित औलोरोगको प्रतिशत (नयाँ औलो रोग मध्ये | ० | ० | ० | ६३ | ८९.५ | |
| जम्मा औलो रोग मध्ये प्लाज्मोडियम फाल्सिपारमको अनुपात | ० | ० | ० | २.१ | २२.८ | |
| नयाँ क्षयरोगी बिरामी पत्ता लागेको दर | १०८ | ७७ | ८६ | ९७ | १२९.१ | |
| क्षयरोगको उपचार सफलता दर | १०० | ९०.५ | ८६.४० | ९१ | ९१.५ | |
| कुष्ठरोगको रोग प्रकोप दर (प्रति १०००० मा) | ० | ० | ० | ०.५ | ० | |
| ए. आर. टी. उपचारमा रहेका जम्मा एच. आइ. भी. पोजेटिभको संख्या | ० | ० | ० | ६९१ | २२१५२ | |
| उपचारात्मक सेवा |
ग्राफ
तालिका
|
|||||
| ओ पि डी मा आएका बिरामी मध्ये नयाँ बिरामीको दर | ८० | ८३ | ८७ | १०५ | ९२ | |
शीर्ष १० स्वास्थ्य अवस्थाको सूची
स्वास्थ्य सूचना व्यवस्थापन प्रणाली २०७९-८०स्वास्थ्य क्षेत्रमा बजेट
- सशर्त स्वास्थ्यमा छुट्याएको बजेट
- समानीकरणबाट विनियोजित स्वास्थ्य बजेट
- अन्य श्रोतबाट बिनियोजित स्वास्थ्य बजेट
| बजेट | नलगाड नगरपालिका | |||||
|---|---|---|---|---|---|---|
| २०८०/८१ | २०७९/८० | |||||
| ग्राफ | ||||||
| पालिकाको कुल बजेट (रु ) | ६५६,६६५,२२३ | |||||
| स्वास्थ्य बजेट (सबै स्रोत) | ५०,००० | २४६,३२९,१५९ | ||||
| सशर्त स्वास्थ्यमा छुट्याएको बजेट | २२,६८९,२११ | |||||
| समानीकरणबाट विनियोजित स्वास्थ्य बजेट | ५०,००० | २२३,६३९,९४८ | ||||
| अन्य श्रोतबाट बिनियोजित स्वास्थ्य बजेट | - | - | ||||
| बजेट खर्च (%) | ५०,००० | ९५ | ||||
| तालिका | ||||||
महत्वपूर्ण सम्पर्क
Nalagad Municipality
ठेगाना : नलगाड नगरपालिका
टेलिफोन : //
वेबसाइट : http://tribeninalgaadmun.gov.np/

यो प्रोफाइल अमेरिकी अन्तर्राष्ट्रिय विकास नियोग (युएसएआइडी) मार्फत अमेरिकी जनताहरुको सहयोगका कारण सम्भव बनेको हो । यो प्रतिवेदन भित्रका विषयवस्तु र सामग्री स्वास्थ्यका लागि सक्षम प्रणालीका एकल जिम्मेवारी हुन् र तिनले युएसएआइडी वा अमेरिकी सरकारको विचारको प्रतिविम्बित गर्छन् भन्ने जरुरी छैन ।