संक्षिप्त परिचय त्रिपुरासुन्दरी नगरपालिका
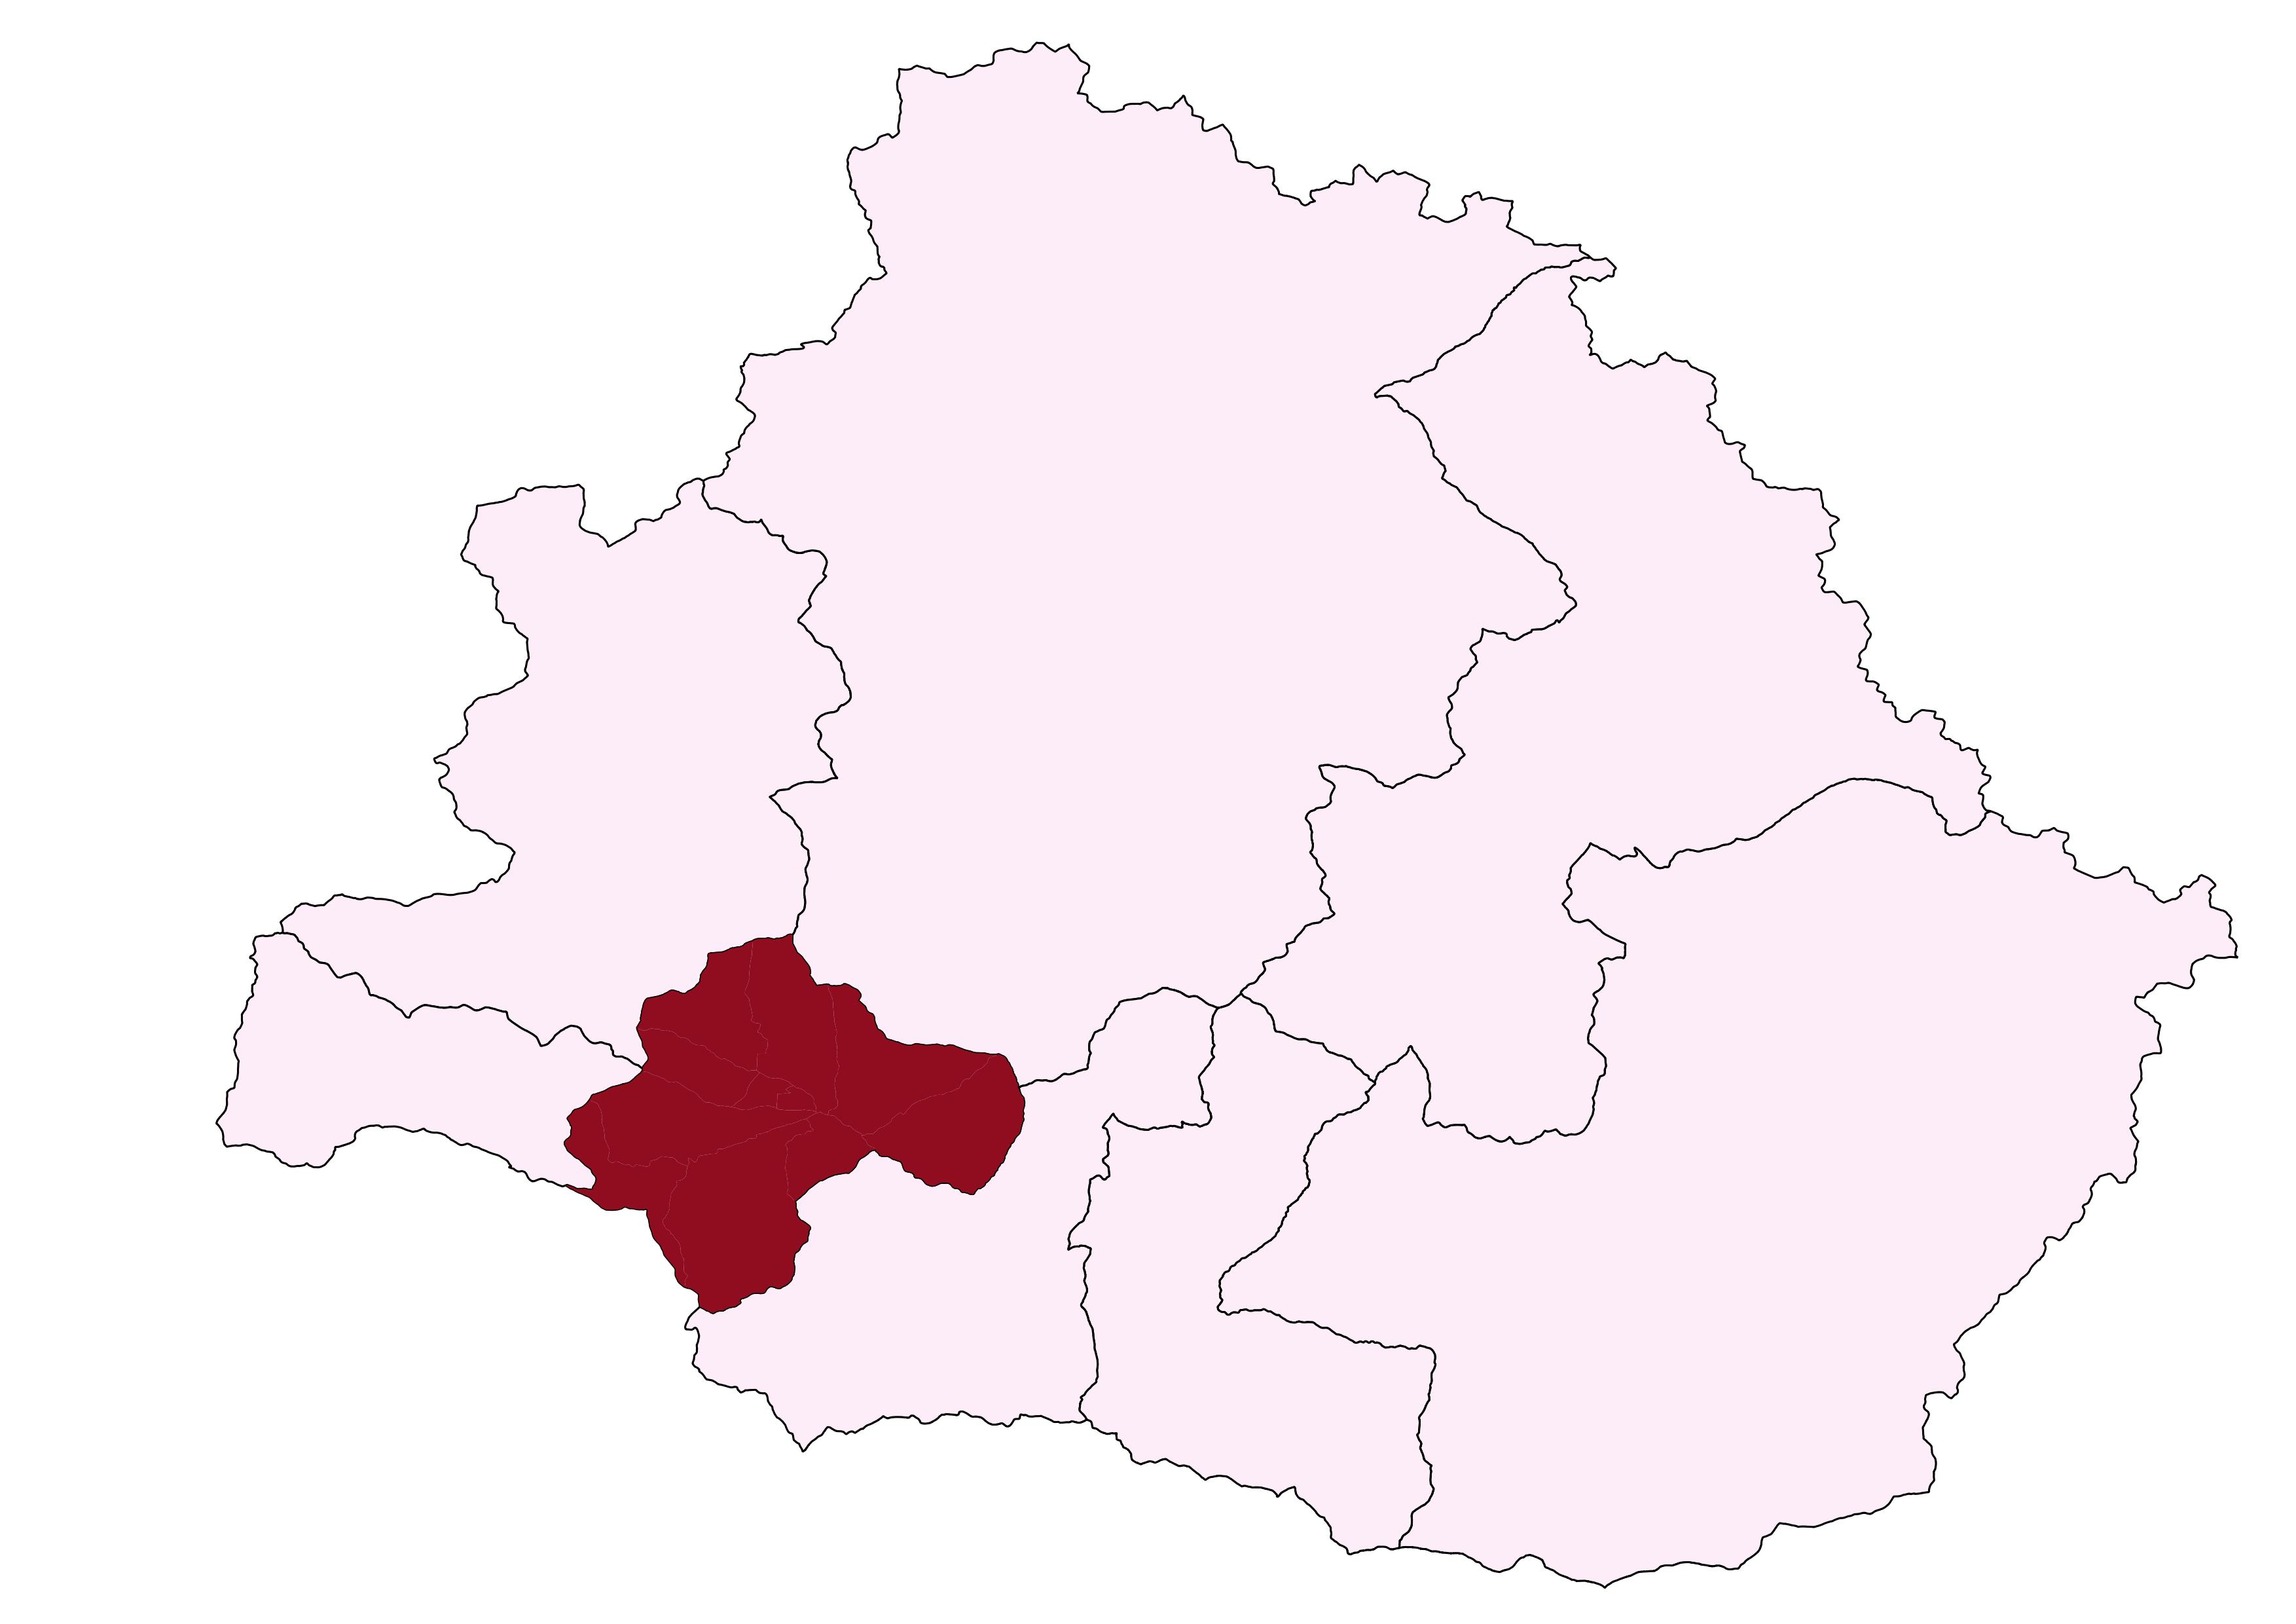
डोल्पा आठवटा स्ठानिय तहहरु मध्ये २ नगरपालिका र छ वटा गाउपालिका सहित राज्य पुनर्सरचना भएको प्रदेश नं. ६ मा पर्ने कर्णाली अञ्चलको सबै भन्दा ठुलो जिल्ला हो । साविकका त्रिपुराकोट, पाहाडा, लिकु, ल्हां, र सुं गा.वि.सको संयोजनमा यस त्रिपुरासुन्दरी नगरपालीकाको निर्माण भएको हो । यो नगरपालिका ३९३.४५ वर्ग कि.मि. क्षेत्रफलमा फैलिएको छ । समुन्द्र सतह देखी २००० मिटर देखी ५००० मिटर सम्मको उचाईमा रहेको छ । यस नगरपालिकाको उतरमा फोक्सुण्डो गांउपालीका, दक्षिणमा रूकुम जिल्लाको सिमाना, पश्चिममा मुड्केचुला तथा जगदुला गाउंपालीकाको सिमाना पर्दछ भने पूर्वमा डोल्पाको अर्को ठुलि भेरी नगरपालीकाको सिमानासंग जोडिएको छ । यस नगरपालीकामा जम्मा ११ वटा वडाहरू रहेका छन ।
जनसाङ्खिक सूचक
-
कूल जनसंख्या २
१२,३६१
२०७८ -
१ बर्ष भन्दा मुनिको जनसंख्या २
३०९
२०७८ -
पाँच बर्ष भन्दा मुनिको जनसंख्या २
१,५१२
२०७८ -
किशोरावस्था (१०-१९ बर्ष) को जनसंख्या २
२,६२३
२०७८ -
प्रजनन उमेरका महिला (१५ -४९ बर्ष ) २
३,२२४
२०७८ -
अनुमानित गर्भवती महिलाहरु २
४१२
२०७८ -
अनुमानित जिवित जन्मको संख्या २
३२४
२०७८ -
परिवारमा अनुपस्थित (विदेशमा बस्ने) जनसंख्या २
२२
२०६८ -
मोबाइल फोन भएका घरधुरी (%) २
८८१
२०६८ -
टेलिभिजन भएका घरधुरी (%) २
१५६
२०६८ -
लैङ्गिक अनुपात २
९७
२०६८ -
१४ बर्ष र सो भन्दा कम उमेरका जनसंख्या २
४,२८०
२०७८ -
६५ बर्ष र सो भन्दा माथि उमेरका जनसंख्या
२५१
२०६८
उमेर र लिंगको आधारमा जनसंख्या वितरण
जनगणना २०६८जातिगत आधारमा जनसंख्या वितरण
जनगणना २०६८वार्ड अनुसार जनसंख्या वितरण
जनगणना २०६८स्वास्थ्य सेवा प्रवाह गर्ने संस्थाहरु

- अस्पताल -
- प्रास्वाके -
- स्वास्थ्य चौकी ५
- सामुदायिक स्वास्थ्य ईकाई २
- शहरी स्वास्थ्य केन्द्र -
- गाउँघर क्लिनिक १५
- खोप क्लिनिक १७
- आधारभूत स्वस्थ सेवाकेन्द्र ५
- बर्थिंग सेन्टर ४
सरकारी संस्था
- अस्पताल तथा नर्सिंग होम -
- पोलिक्लिनिक -
- औषधि पसल ६
निजी (गैर-सरकारी संस्था समेत)
अन्य स्वास्थ्य केन्द्रहरु
- माइक्रोस्कोपी केन्द्र -
- एआरटि केन्द्र -
- एचाईभी परीक्षण केन्द्र -
- क्षयरोग उपचार केन्द्र ५
- आयुर्वेद अस्पताल/केन्द्र १
- आँखा अस्पताल/केन्द्र -
अस्पताल शैयाहरू
- सार्वजनिक -
- निजी -
थप सेवाहरू
वडा अनुसार स्वास्थ्य संस्थाको जानकारी
| स्वास्थ्यसंस्थाको नाम | वार्ड न | बर्थिंग सेन्टर BEONC/CEONC | महिला स्वास्थ्य स्वयं सेवक संख्या | दक्ष प्रसुतिकर्मी संख्या | परिवार नियोजन *सेवा | स्वीकृत दरबन्दी | दरबन्दी अनुसार पदपूर्ति | करारका कर्मचारी |
|---|---|---|---|---|---|---|---|---|
| त्रिपुरकोट स्वास्थ्य चौकी | १ | हो | ९ | २ | ४ साधनहरू | ५ | ५ | २ |
| सुँ स्वास्थ्य चौकी | ३ | हो | ९ | १ | ३ साधनहरू | ५ | ३ | ३ |
| फुल्चिङ स्वास्थ्य चौकी | ६ | होइन | ९ | ० | ३ साधनहरू | ५ | ३ | २ |
| पहाडा स्वास्थ्य चौकी | ७ | हो | ९ | १ | ३ साधनहरू | ५ | ३ | २ |
| लिकु स्वास्थ्य चौकी | १० | हो | ९ | २ | ३ साधनहरू | ५ | ४ | १ |
| सामुदायिक स्वास्थ्य इकाई केन्द्र, ल्हाँ | ५ | होइन | ० | ० | ३ साधनहरू | ० | ० | ३ |
| अाधारभुत स्वास्थ्य सेवा केन्द्र | २ | होइन | ० | ० | ३ साधनहरू | ० | ० | ३ |
| अाधारभुत स्वास्थ्य सेवा केन्द्र | ४ | होइन | ० | ० | ३ साधनहरू | ० | ० | ३ |
| अाधारभुत स्वास्थ्य सेवा केन्द्र | ८ | होइन | ० | ० | ३ साधनहरू | ० | ० | ३ |
| अाधारभुत स्वास्थ्य सेवा केन्द्र | ९ | होइन | ० | ० | ३ साधनहरू | ० | ० | ३ |
| अाधारभुत स्वास्थ्य सेवा केन्द्र | ११ | होइन | ० | ० | ३ साधनहरू | ० | ० | ३ |
| कुल कर्मचारी संख्या | ४५ | ६ | २५ | १८ | २८ | |||
स्वास्थ्य सेवाको लागि मानव संसाधन
- CEONC साइटहरू-
- BEONC साइटहरू-
- आइयुसीडी तथा इम्पलान्ट सेवा प्रदायक१
- एकीकृत बालरोग व्यवस्थापन (IMCI) प्रशिक्षित कर्मचारी१०
- जनसंख्या (प्रति मस्वास्वका) २७५
- जनसंख्या (प्रति स्वास्थ्यकर्मी) ६८७
- अनुमानित गर्भवति (प्रति दक्ष प्रसुतिकर्मी) ६९
- अनुमानित गर्भवति (प्रति बर्थिङ्ग सेन्टर) १०३
- जनसंख्या (प्रति स्वास्थ्य संस्था) (अस्पताल,प्रस्वाके र स्वाचौ सहित) -
- जनसंख्या (प्रति सरकारी अस्पताल) -
- जनसंख्या (प्रति अस्पताल र नर्सिंग होम (सबै) -
मातृशिशु बालस्वास्थ्य र परिवार नियोजन सेवा उपयोगको अवस्था
स्वास्थ्य सूचना व्यवस्थापन प्रणाली २०७८प्रमूख स्वास्थ्य सेवाहरूको उपयोगको तुलनात्मक अवस्था
| सूचक | त्रिपुरासुन्दरी नगरपालिका | कर्णाली प्रदेश २०७८/७९ | राष्ट्रीय २०७८/७९ | |||
|---|---|---|---|---|---|---|
| २०७६/७७ | २०७७/७८ | २०७८/७९ | ||||
| खाेप |
ग्राफ
तालिका
|
|||||
| बि.सि.जि. कभरेज | १०७.३ | ११२.१ | ७४ | ९२ | १०३.५ | |
| २३ महिनाभित्र पूर्ण खोप प्राप्त गरेका बालबालिका (%) | ० | ० | ० | ० | ० | |
| डि.पि.टि. - हेप बि - हिव ३ कभरेज | १०५.६ | १०२.२ | ८४.८ | ९४ | ९५.२ | |
| दादुरा रूबेला १ (९-११ महिना) कभरेज | ११३.४ | १००.४ | ८७.४ | ९५ | ९४.७ | |
| जे.इ कभरेज | ७८.३ | ८५.१ | ८५.२ | ९६ | ९५.९ | |
| टि.डी. २ र टि. डी. २+ कभरेज | ११३.८ | ८५.८ | ४६.४ | ६६ | ७१.७ | |
| पोषण |
ग्राफ
तालिका
|
|||||
| कम जन्म तौल भएका नवजात शिशुको प्रतिशत | १.७ | ०.८४ | ०.६१ | ६.८ | ९.४ | |
| नयाँ तौल लिएका १ वर्ष मुनिका शिशुहरुको प्रतिशत | २२१.१ | २२५.१ | १६६.१ | १२० | १०४.१ | |
| नयाँ तौल लिएका २ वर्ष मुनिका शिशुहरु मध्ये अति जोखिम अवस्थाका बालबालिकाहरुको प्रतिशत | २७१.५ | २३७.८ | २००.७ | ४.१ | ३.६ | |
| गर्भवती अवस्थामा १८० दिन आइरन चक्की प्राप्त गरेका गर्भवती महिलाहरुको प्रतिशत | ५०.६ | ३९.९ | २८.३ | ७३ | ६० | |
| सुत्केरी अवस्थामा भिटामिन ए प्राप्त गरेका महिलाहरुको प्रतिशत | ६५.७ | ६८.५ | ५१.४ | ८८ | ७६.३ | |
| नवजात शिशु तथा बाल रोगको एकीकृत व्यस्थापन |
ग्राफ
तालिका
|
|||||
| नाभी मलम लगाएका नवजात शिशुको प्रतिशत | ९०.९ | ९२.९ | ८२.८ | ९६ | ८२.९ | |
| ब्याक्टेरियाको गम्भीर संक्रमण भएकामध्ये जेन्टामाईसिन सुईद्वारा पूर्ण उपचार पाएको प्रतिशत | ० | ० | ० | ७५ | ४७.४ | |
| नयाँ निमोनिया बिरामीको दर (प्रति हजार पाँच वर्षमुनिका बालबालिकाहरुमा) | ६४.९ | ३२.९ | १२.५ | ११३ | ३६.८ | |
| नयाँ एआरआई (स्वाशप्रश्वाका) बिरामी मध्ये कडा निमोनिया भएका बिरामीको प्रतिशत | ०.१३ | ० | ० | ०.४१ | ०.१८ | |
| नयाँ झाडापखालाका बिरामीको दर (प्रति हजार पाँच वर्ष मुनिका बालबालिकाहरुमा) | ४३१.४ | ६७०.२ | ४७२.९ | ५७९ | ३५२.४ | |
| ५ वर्ष मुनिका झाडापखालाका बिरामी मध्ये जिंक र पुनर्जलीय झोलबाट उपचार गरेको प्रतिशत | ८३.७ | ८८.१ | ८२.३ | ९५ | ९४.५ | |
| जम्मा नवजात शिशु मृत्यु संख्या | ० | ३ | ३ | १९९ | १९१४ | |
| सुरक्षित मातृत्व तथा परिवार नियोजन |
ग्राफ
तालिका
|
|||||
| प्परोटोकल अनुसार पहिलो पटक गर्भवती जाँच गराएका गर्भवती महिलाहरुको प्रतिशत | ५४.८ | ७९ | ५५.४ | १२२ | ९१.४ | |
| प्रजनन् उमेरका महिलाहरुमा परिवार नियोजनको प्रयोगकर्ता दर (आधुनिक साधन) | ० | ० | ० | ० | ० | |
| ४ पटक गर्भवती जाँच (महिना: ४,६,८,९/हप्ता: १६, २०-२४,३२ र ३६) महिलाहरुको प्रतिशत | ४१.४ | ३७ | २४.२ | ७३ | ७९.४ | |
| स्वास्थ्य संस्था प्रसुति दर | ५०.६ | ५८.४ | ४५.८ | ८३ | ७९ | |
| दक्ष प्रसुतिकर्मी/स्वास्थ्यकर्मीद्वारा प्रसुति गराएको प्रतिशत | ४३.५ | ५०.४ | ३९.४ | ७० | ७५ | |
| प्रोटोकल अनुसार ४ पटक (आ.व २०७८/७९ सम्म ३ पटक) सुत्केरी जाँच गराउने आमाहरुको प्रतिशत | १४.२ | ५.९ | ४२.२ | ५३ | ४०.८ | |
| जम्मा मातृ मृत्यु संख्या | ० | ० | २ | १७ | २३१ | |
| परिवार नियोजन सेवाका नयाँ सेवाग्राही दर (प्रजनन उमेरका महिलाहरु मध्ये) | २४.६ | २५.४ | १९.८ | १९ | ११.५ | |
| औलो रोग, क्षय रोग, कुष्ठरोग र एचआईभी |
ग्राफ
तालिका
|
|||||
| औलोको स्लाइड नमुना पोजेटिभ दर | ० | ० | ० | ०.२५ | ०.१७ | |
| डेंगुको जम्मा विरामी संख्या | ० | ० | ० | ० | ० | |
| आयातित औलोरोगको प्रतिशत (नयाँ औलो रोग मध्ये | ० | ० | ० | ६३ | ८९.५ | |
| जम्मा औलो रोग मध्ये प्लाज्मोडियम फाल्सिपारमको अनुपात | ० | ० | ० | २.१ | २२.८ | |
| नयाँ क्षयरोगी बिरामी पत्ता लागेको दर | ० | १० | १७ | ९७ | १२९.१ | |
| क्षयरोगको उपचार सफलता दर | ० | ८३ | १३७.५ | ९१ | ९१.५ | |
| कुष्ठरोगको रोग प्रकोप दर (प्रति १०००० मा) | ० | ० | १०० | ०.५ | ० | |
| ए. आर. टी. उपचारमा रहेका जम्मा एच. आइ. भी. पोजेटिभको संख्या | ० | ० | ० | ६९१ | २२१५२ | |
| उपचारात्मक सेवा |
ग्राफ
तालिका
|
|||||
| ओ पि डी मा आएका बिरामी मध्ये नयाँ बिरामीको दर | ६३.३ | ८७.२ | ६४.८ | १०५ | ९२ | |
शीर्ष १० स्वास्थ्य अवस्थाको सूची
स्वास्थ्य सूचना व्यवस्थापन प्रणाली २०७८-२०७९स्वास्थ्य क्षेत्रमा बजेट
- सशर्त स्वास्थ्यमा छुट्याएको बजेट
- समानीकरणबाट विनियोजित स्वास्थ्य बजेट
- अन्य श्रोतबाट बिनियोजित स्वास्थ्य बजेट
| बजेट | त्रिपुरासुन्दरी नगरपालिका | |||||
|---|---|---|---|---|---|---|
| २०७६/७७ | २०७७/७८ | २०७८/७९ | ||||
| ग्राफ | ||||||
| पालिकाको कुल बजेट (रु ) | ३८०,२६०,९६९ | ४२६,५८४,७२० | ४३५,६००,००० | |||
| स्वास्थ्य बजेट (सबै स्रोत) | २७,५८६,००० | ३८,७००,००० | ४१,१२५,००० | |||
| सशर्त स्वास्थ्यमा छुट्याएको बजेट | २२,३१३,००० | ३१,८००,००० | ३१,६००,००० | |||
| समानीकरणबाट विनियोजित स्वास्थ्य बजेट | ५,२७३,००० | ६,९००,००० | ९,५२५,००० | |||
| अन्य श्रोतबाट बिनियोजित स्वास्थ्य बजेट | ||||||
| बजेट खर्च (%) | - | - | - | |||
| तालिका | ||||||
महत्वपूर्ण सम्पर्क
Tripurasundari Municipality
ठेगाना : त्रिपुराकोट, बगर, डोल्पा
टेलिफोन : ९९४८७०१३७,९९४८७०१३८
नगर प्रमुख
नाम : जनचन्द्र रोकाया
सम्पर्क : ९८५१०२९२४८,९८४८६५९६३७

यो प्रोफाइल अमेरिकी अन्तर्राष्ट्रिय विकास नियोग (युएसएआइडी) मार्फत अमेरिकी जनताहरुको सहयोगका कारण सम्भव बनेको हो । यो प्रतिवेदन भित्रका विषयवस्तु र सामग्री स्वास्थ्यका लागि सक्षम प्रणालीका एकल जिम्मेवारी हुन् र तिनले युएसएआइडी वा अमेरिकी सरकारको विचारको प्रतिविम्बित गर्छन् भन्ने जरुरी छैन ।