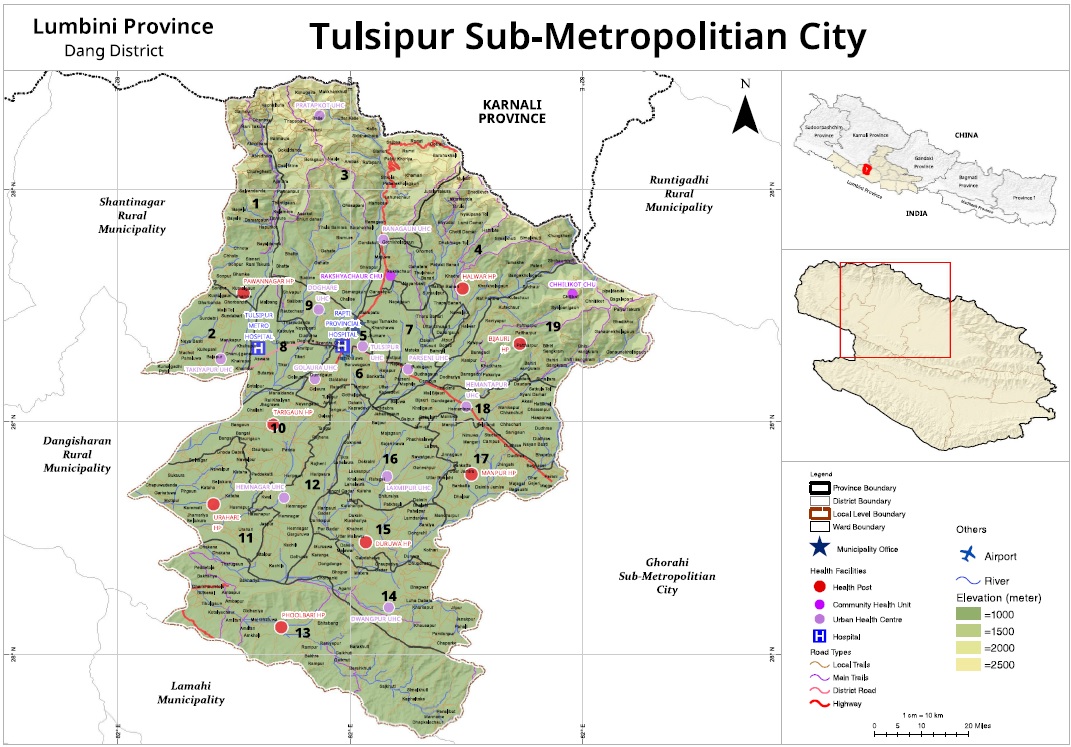
संक्षिप्त परिचय तुल्सीपुर उपमहानगरपालिका

२०७३ साल फागुन २७ गतेको मन्त्रीपरिषदको निर्णय बमोजिम तुलसीपुर उप-महानगरपालिकामा साविक गा.वि.स. मानपुर,बिजौरी,डुरुवा,फुलबारी, र पवननगर गाभेर पुन : नया नगरपालिकाको नवसंरचना बमोजिम तुलसीपुर उपमहानगरपालिका कायम भएको हो । लुम्विनी प्रदेशमा रहेको यस नगरीमा १९ वटा वडा कायम छन ।
जनसाङ्खिक सूचक
-
कूल जनसंख्या ७
१८८,४४८
/ -
१ बर्ष भन्दा मुनिको जनसंख्या ७
३,२३६
/ -
पाँच बर्ष भन्दा मुनिको जनसंख्या ७
१५,२५४
/ -
किशोरावस्था (१०-१९ बर्ष) को जनसंख्या ७
३८,९५९
/ -
प्रजनन उमेरका महिला (१५ -४९ बर्ष ) ७
४६,८००
/ -
अनुमानित गर्भवती महिलाहरु ७
३,९१६
/ -
अनुमानित जिवित जन्मको संख्या ७
३,२९९
/ -
परिवारमा अनुपस्थित (विदेशमा बस्ने) जनसंख्या २
१४,८५१
-
मोबाइल फोन भएका घरधुरी (%) २
७८
-
टेलिभिजन भएका घरधुरी (%) २
३२
-
लैङ्गिक अनुपात २
८९
-
१४ बर्ष र सो भन्दा कम उमेरका जनसंख्या २
४८,२३०
-
६५ बर्ष र सो भन्दा माथि उमेरका जनसंख्या २
९,७५५
-
कूल प्रजनन् दर १०
२
७ एचएमआईएस प्रक्षेपण
२ जनगणना
१० बार्षिक प्रतिवेदन
उमेर र लिंगको आधारमा जनसंख्या वितरण
जनगणना २०७८जातिगत आधारमा जनसंख्या वितरण
जनगणना २०७८वार्ड अनुसार जनसंख्या वितरण
जनगणना २०७८स्वास्थ्य सेवा प्रवाह गर्ने संस्थाहरु
- अस्पताल २
- प्रास्वाके -
- स्वास्थ्य चौकी ८
- सामुदायिक स्वास्थ्य ईकाई ३
- शहरी स्वास्थ्य केन्द्र ११
- गाउँघर क्लिनिक ३८
- खोप क्लिनिक ६२
- आधारभूत स्वस्थ सेवाकेन्द्र -
- बर्थिंग सेन्टर ८
सरकारी संस्था
- अस्पताल तथा नर्सिंग होम ५
- पोलिक्लिनिक २३
- औषधि पसल ५५
निजी (गैर-सरकारी संस्था समेत)
अन्य स्वास्थ्य केन्द्रहरु
- माइक्रोस्कोपी केन्द्र २४
- एआरटि केन्द्र १
- एचाईभी परीक्षण केन्द्र १
- क्षयरोग उपचार केन्द्र १२
- आयुर्वेद अस्पताल/केन्द्र २
- आँखा अस्पताल/केन्द्र १
अस्पताल शैयाहरू
- सार्वजनिक २६६
- निजी १८२
वडा अनुसार स्वास्थ्य संस्थाको जानकारी
| स्वास्थ्यसंस्थाको नाम | वार्ड न | बर्थिंग सेन्टर BEONC/CEONC | महिला स्वास्थ्य स्वयं सेवक संख्या | दक्ष प्रसुतिकर्मी संख्या | परिवार नियोजन *सेवा | स्वीकृत दरबन्दी | दरबन्दी अनुसार पदपूर्ति | करारका कर्मचारी |
|---|---|---|---|---|---|---|---|---|
| उरहरि स्वास्थ्य चौकी | ११ | प्रसुती केन्द्र | १४ | २ | ६ साधनहरू | ६ | ६ | ४ |
| बिजौरि स्वास्थ्य चौकी | १९ | प्रसुती केन्द्र | ९ | १ | ५ साधनहरू | ६ | ६ | ४ |
| डुरुवा स्वास्थ्य चौकी | १५ | प्रसुती केन्द्र | १२ | २ | ६ साधनहरू | ६ | ६ | ४ |
| मानपुर स्वास्थ्य चौकी | १७ | प्रसुती केन्द्र | ११ | २ | ६ साधनहरू | ६ | ६ | ४ |
| हलवार स्वास्थ्य चौकी | ४ | प्रसुती गृह | १६ | २ | ६ साधनहरू | ६ | ६ | ४ |
| टरिगाउँ स्वास्थ्य चौकी | १० | - | ११ | २ | ५ साधनहरू | ६ | ६ | १ |
| फुलबारि स्वास्थ्य चौकी | १३ | प्रसुती केन्द्र | १२ | २ | ५ साधनहरू | ६ | ६ | ४ |
| पवननगर स्वास्थ्य चौकी | १ | प्रसुती केन्द्र | ८ | २ | ५ साधनहरू | ६ | ६ | ४ |
| छिलीकोट सामुदायिक स्वास्थ्य ईकाई | १९ | - | १ | ० | ४ साधनहरू | ० | ० | ३ |
| गोलौरा शहरि स्वास्थ्य केन्द्र | ६ | - | ३ | ० | ४ साधनहरू | ० | २ | २ |
| दोघरे शहरि स्वास्थ्य केन्द्र | ९ | - | ५ | १ | ४ साधनहरू | ० | ४ | १ |
| प्रतापकोट शहरि स्वास्थ्य केन्द्र | ३ | - | २ | ० | ४ साधनहरू | ० | ० | ४ |
| हेमनगर शहरि स्वास्थ्य केन्द्र | १२ | - | १३ | ० | ४ साधनहरू | ० | १ | ३ |
| पर्सेनि शहरि स्वास्थ्य केन्द्र | ७ | - | ११ | २ | ६ साधनहरू | ० | ४ | १ |
| रानागाऊँ शहरि स्वास्थ्य केन्द्र | ३ | - | ५ | १ | ५ साधनहरू | ० | ३ | १ |
| तकियापुर शहरि स्वास्थ्य केन्द्र | २ | - | १० | ० | ४ साधनहरू | ० | १ | ३ |
| ड्वाङपुर शहरि स्वास्थ्य केन्द्र | १४ | - | ११ | ० | ४ साधनहरू | ० | १ | ४ |
| हेमन्तपुर शहरि स्वास्थ्य केन्द्र | १८ | - | ११ | १ | ५ साधनहरू | ० | २ | २ |
| लक्ष्मिपुर शहरि स्वास्थ्य केन्द्र | १६ | - | ११ | ० | ४ साधनहरू | ० | १ | ३ |
| तमेट्रो अस्पताल | ८ | - | १० | ४ | ६ साधनहरू | - | ११ | २२ |
| रक्षाचौर सामुदायिक स्वास्थ्य ईकाई | ४ | - | ० | ० | ४ साधनहरू | ० | ० | ३ |
| तुलसीपुर बसपार्क शहरि स्वास्थ्य केन्द्र | ५ | - | ५ | ० | ४ साधनहरू | ० | १ | ३ |
| कुल कर्मचारी संख्या | १९१ | २४ | ४८ | ७९ | ८४ | |||
स्वास्थ्य सेवाको लागि मानव संसाधन
स्थानीय तह २०७८
- CEONC साइटहरू१
- BEONC साइटहरू-
- आइयुसीडी तथा इम्पलान्ट सेवा प्रदायक१६
- एकीकृत बालरोग व्यवस्थापन (IMCI) प्रशिक्षित कर्मचारी२२
- जनसंख्या (प्रति मस्वास्वका) ९८७
- जनसंख्या (प्रति स्वास्थ्यकर्मी) २३८५
- अनुमानित गर्भवति (प्रति दक्ष प्रसुतिकर्मी) १६३
- अनुमानित गर्भवति (प्रति बर्थिङ्ग सेन्टर) ४९०
- जनसंख्या (प्रति स्वास्थ्य संस्था) (अस्पताल,प्रस्वाके र स्वाचौ सहित) -
- जनसंख्या (प्रति सरकारी अस्पताल) ९४२२४
- जनसंख्या (प्रति अस्पताल र नर्सिंग होम (सबै) २६९२१
मातृशिशु बालस्वास्थ्य र परिवार नियोजन सेवा उपयोगको अवस्था
स्वास्थ्य सूचना व्यवस्थापन प्रणाली २०८१प्रमूख स्वास्थ्य सेवाहरूको उपयोगको तुलनात्मक अवस्था
| सूचक | तुल्सीपुर उपमहानगरपालिका | लुम्बिनी प्रदेश २०७८/७९ | राष्ट्रीय २०७८/७९ | |||
|---|---|---|---|---|---|---|
| २०७६/७७ | २०७७/७८ | २०७८/७९ | ||||
| खाेप |
ग्राफ
तालिका
|
|||||
| बि.सि.जि. कभरेज | ११३ | ९८.८ | १२४.९ | १०३.१ | १०३.५ | |
| २३ महिनाभित्र पूर्ण खोप प्राप्त गरेका बालबालिका (%) | ० | ० | ० | ० | ० | |
| डि.पि.टि. - हेप बि - हिव ३ कभरेज | ९३ | ८३.४ | १०८ | ९६.६ | ९५.२ | |
| दादुरा रूबेला १ (९-११ महिना) कभरेज | ९८ | ८८.५ | ११४.९ | ९६.७ | ९४.७ | |
| जे.इ कभरेज | ११४ | १०३ | १०९ | ९८.९ | ९५.९ | |
| टि.डी. २ र टि. डी. २+ कभरेज | ६९ | ६४.१ | ७९.२ | ७३.९ | ७१.७ | |
| पोषण |
ग्राफ
तालिका
|
|||||
| कम जन्म तौल भएका नवजात शिशुको प्रतिशत | ७ | ७.८ | ३.४ | १२ | ९.४ | |
| नयाँ तौल लिएका १ वर्ष मुनिका शिशुहरुको प्रतिशत | ४९.२ | ६७. | ९८.४ | १०९ | १०४.१ | |
| नयाँ तौल लिएका २ वर्ष मुनिका शिशुहरु मध्ये अति जोखिम अवस्थाका बालबालिकाहरुको प्रतिशत | ४ | ३.५ | ४.२ | ३.५ | ३.६ | |
| गर्भवती अवस्थामा १८० दिन आइरन चक्की प्राप्त गरेका गर्भवती महिलाहरुको प्रतिशत | ६३.१ | ५५.५ | ६८.९ | ७५.८ | ६० | |
| सुत्केरी अवस्थामा भिटामिन ए प्राप्त गरेका महिलाहरुको प्रतिशत | ११८ | ११७.८ | ११५.७ | ९८.२ | ७६.३ | |
| नवजात शिशु तथा बाल रोगको एकीकृत व्यस्थापन |
ग्राफ
तालिका
|
|||||
| नाभी मलम लगाएका नवजात शिशुको प्रतिशत | ७७ | ९८.७ | ९८.८ | ९४.२ | ८२.९ | |
| ब्याक्टेरियाको गम्भीर संक्रमण भएकामध्ये जेन्टामाईसिन सुईद्वारा पूर्ण उपचार पाएको प्रतिशत | २२ | ० | ४२.८ | ३९.५ | ४७.४ | |
| नयाँ निमोनिया बिरामीको दर (प्रति हजार पाँच वर्षमुनिका बालबालिकाहरुमा) | ५६ | २१ | २९.९ | २९.३ | ३६.८ | |
| नयाँ एआरआई (स्वाशप्रश्वाका) बिरामी मध्ये कडा निमोनिया भएका बिरामीको प्रतिशत | ०.२ | ०.०५ | ०.०८ | ०.०५ | ०.१८ | |
| नयाँ झाडापखालाका बिरामीको दर (प्रति हजार पाँच वर्ष मुनिका बालबालिकाहरुमा) | २७६ | २६८.५ | २८९.५ | ३३९ | ३५२.४ | |
| ५ वर्ष मुनिका झाडापखालाका बिरामी मध्ये जिंक र पुनर्जलीय झोलबाट उपचार गरेको प्रतिशत | १०५.५ | ९७.८ | १०० | ९८.७ | ९४.५ | |
| जम्मा नवजात शिशु मृत्यु संख्या | ६ | १९ | १५ | ५७३ | १९१४ | |
| सुरक्षित मातृत्व तथा परिवार नियोजन |
ग्राफ
तालिका
|
|||||
| प्परोटोकल अनुसार पहिलो पटक गर्भवती जाँच गराएका गर्भवती महिलाहरुको प्रतिशत | ८९ | ८१ | ९८ | ९३.५ | ९१.४ | |
| प्रजनन् उमेरका महिलाहरुमा परिवार नियोजनको प्रयोगकर्ता दर (आधुनिक साधन) | ० | ० | ० | ० | ० | |
| ४ पटक गर्भवती जाँच (महिना: ४,६,८,९/हप्ता: १६, २०-२४,३२ र ३६) महिलाहरुको प्रतिशत | ६२ | ५६.१ | ७०.९ | ७९.७ | ७९.४ | |
| स्वास्थ्य संस्था प्रसुति दर | १०२ | १०९.६ | १०२.८ | ९४.२ | ७९ | |
| दक्ष प्रसुतिकर्मी/स्वास्थ्यकर्मीद्वारा प्रसुति गराएको प्रतिशत | १०२ | १०९.६ | १०२.८ | ८९.८ | ७५ | |
| प्रोटोकल अनुसार ४ पटक (आ.व २०७८/७९ सम्म ३ पटक) सुत्केरी जाँच गराउने आमाहरुको प्रतिशत | ९ | ३४.८ | ५२.३ | ५३.७ | ४०.८ | |
| जम्मा मातृ मृत्यु संख्या | १ | ० | ० | ७४ | २३१ | |
| परिवार नियोजन सेवाका नयाँ सेवाग्राही दर (प्रजनन उमेरका महिलाहरु मध्ये) | ९ | ८.३ | ९.६ | १२.४ | ११.५ | |
| औलो रोग, क्षय रोग, कुष्ठरोग र एचआईभी |
ग्राफ
तालिका
|
|||||
| औलोको स्लाइड नमुना पोजेटिभ दर | ० | ०.४५ | ०.३२ | ०.२७ | ०.१७ | |
| डेंगुको जम्मा विरामी संख्या | ० | ० | ० | ० | ० | |
| आयातित औलोरोगको प्रतिशत (नयाँ औलो रोग मध्ये | ० | ० | १०० | ९५.५ | ८९.५ | |
| जम्मा औलो रोग मध्ये प्लाज्मोडियम फाल्सिपारमको अनुपात | ० | ० | ० | ३८.७ | २२.८ | |
| नयाँ क्षयरोगी बिरामी पत्ता लागेको दर | १५९ | १३१ | २०९.८ | १५७.४ | १२९.१ | |
| क्षयरोगको उपचार सफलता दर | ९६ | ९३ | ९२.९ | ९१ | ९१.५ | |
| कुष्ठरोगको रोग प्रकोप दर (प्रति १०००० मा) | ० | ०.२४ | ०.१६ | ०.९ | ० | |
| ए. आर. टी. उपचारमा रहेका जम्मा एच. आइ. भी. पोजेटिभको संख्या | १०१ | ११४ | २६ | ४३२६ | २२१५२ | |
| उपचारात्मक सेवा |
ग्राफ
तालिका
|
|||||
| ओ पि डी मा आएका बिरामी मध्ये नयाँ बिरामीको दर | ७४.५ | ८०.१ | ९५.१ | ९४.५ | ९२ | |
शीर्ष १० स्वास्थ्य अवस्थाको सूची
स्वास्थ्य सूचना व्यवस्थापन प्रणाली २०८१०८२स्वास्थ्य क्षेत्रमा बजेट
स्थानीय तह २०७७
- सशर्त स्वास्थ्यमा छुट्याएको बजेट
- समानीकरणबाट विनियोजित स्वास्थ्य बजेट
- अन्य श्रोतबाट बिनियोजित स्वास्थ्य बजेट
| बजेट | तुल्सीपुर उपमहानगरपालिका | |||||
|---|---|---|---|---|---|---|
| २०७८/७९ | २०७९/८० | २०८०/८१ | ||||
| ग्राफ | ||||||
| पालिकाको कुल बजेट (रु ) | ३,३९०,०००,००० | १,८६४,७७९,००० | ||||
| स्वास्थ्य बजेट (सबै स्रोत) | ११८,०१८,००० | १२०,१९५,००० | ९८,०५९,५७५ | |||
| सशर्त स्वास्थ्यमा छुट्याएको बजेट | ५०,६००,००० | ५८,००९,००० | ५७,७२१,००० | |||
| समानीकरणबाट विनियोजित स्वास्थ्य बजेट | ६७,४१८,००० | ५७,५०३,००० | ४०,३३८,५७५ | |||
| अन्य श्रोतबाट बिनियोजित स्वास्थ्य बजेट | ४,६८३,००० | - | ||||
| बजेट खर्च (%) | ८५ | ८६ | ८८ | |||
| तालिका | ||||||
महत्वपूर्ण सम्पर्क
Tulsipur Sub-Metropolitian City
ठेगाना : तुलसीपुर उप-महानगरपालिका, प्रदेश नं ५, दाङ
टेलिफोन : ०८२-५२०२३३
वेबसाइट : tulsipurmun.gov.np

यो प्रोफाइल अमेरिकी अन्तर्राष्ट्रिय विकास नियोग (युएसएआइडी) मार्फत अमेरिकी जनताहरुको सहयोगका कारण सम्भव बनेको हो । यो प्रतिवेदन भित्रका विषयवस्तु र सामग्री स्वास्थ्यका लागि सक्षम प्रणालीका एकल जिम्मेवारी हुन् र तिनले युएसएआइडी वा अमेरिकी सरकारको विचारको प्रतिविम्बित गर्छन् भन्ने जरुरी छैन ।