संक्षिप्त परिचय कर्णाली प्रदेश
बिरेन्द्रनगर राजधानी भएको भूभागकाे अाधारमा कर्णाली प्रदेश नेपालकाे सबैभन्दा ठूलाे प्रदेश हाे । यसकाे कुल क्षेत्रफल २७,९८४ बर्ग किमी रहेकाे छ र करिब १७ लाख जनसँख्या यहाँ बसाेबास गर्दछन् । यसकाे पूर्वमा गण्डकी प्रदेश, पश्चिममा सुदुरपश्चिम प्रदेश, उत्त्तरमा चीन र दक्षिणमा लुम्बिनी प्रदेश रहेका छन् । यस प्रदेशमा जम्मा २५ वटा नगरपालिका र ५४ वटा गाँउपालिका रहेका छन् भने ७१८ वटा वडाहरु रहेका छन् । रारा ताल, से फाेङ्कसुन्डाे ताल, कुपिन्डे दह, कमल दह, र डुल्लु यस प्रदेशका मुख्य अाकर्षण स्थलहरु रहेका छन् । जलश्राेत र जडिबुडी यस प्रदेशका मुख्य श्राेतहरु रहेका छन् । करिब ९५ प्रतिशत जनसँख्या नेपाली भाषी रहेका छन् भने प्रति व्यक्ति अाय ८०६ USD रहेकाे छ । करीब ८५% जनसँख्या राेजगारीका लागि अन्य स्थानमा जाने गर्दछन् ।
जनसाङ्खिक सूचक
-
कूल जनसंख्या २
१,६८८,४१२.००
२०७८ -
१ बर्ष भन्दा मुनिको जनसंख्या २
३१,४८१.००
२०७८ -
पाँच बर्ष भन्दा मुनिको जनसंख्या २
१६८,८०१.००
२०७८ -
किशोरावस्था (१०-१९ बर्ष) को जनसंख्या २
४०५,११६.००
२०७८ -
प्रजनन उमेरका महिला (१५ -४९ बर्ष ) २
८७१,६५०.००
२०७८ -
अनुमानित गर्भवती महिलाहरु १
४५,०१४.००
२०७९/८० -
अनुमानित जिवित जन्मको संख्या १
३५,४४९.००
२०७९/८० -
परिवारमा अनुपस्थित (विदेशमा बस्ने) जनसंख्या २
९४,३२०.००
२०७८ -
स्मार्ट मोबाईल फोन भएका घरधुरी (%) २
५८.४०
२०७८ -
टेलिभिजन भएका घरधुरी (%) २
१७.६०
२०७८ -
लैङ्गिक अनुपात २
९५.२७
२०७८ -
१४ बर्ष र सो भन्दा कम उमेरका जनसंख्या २
५५८,८९१.००
२०७८ -
६५ बर्ष र सो भन्दा माथि उमेरका जनसंख्या २
८६,४९५.००
२०७८ -
कूल प्रजनन् दर १३
२.६०
२०७८ -
शाक्षरता दर २
७६.१०
२०७८ -
पुरूष शाक्षरता दर २
८३.३०
२०७८ -
महिला शाक्षरता दर २
६९.४०
२०७८ -
शाैचालय भएका घरधुरी (%) २
९७.४०
२०७८ -
घरमा नै खानेपानीको धारा जडान भएका घरधुरी (%) २
८०.१०
२०७८ -
कुनै एक अपांगता भएका जनसंख्या (%) २
३.१०
२०७८ -
मानव बिकास सुचाकं १९
०.५४
२०२० -
बहुपक्षिय गरिबी दर २०
३९.५०
२०२१
उमेर र लिंगको आधारमा जनसंख्या वितरण
जनगणना २०७८जातिगत आधारमा जनसंख्या वितरण
जनगणना २०७८वार्ड अनुसार जनसंख्या वितरण
जनगणना २०७८स्वास्थ्य सेवा प्रवाह गर्ने संस्थाहरु
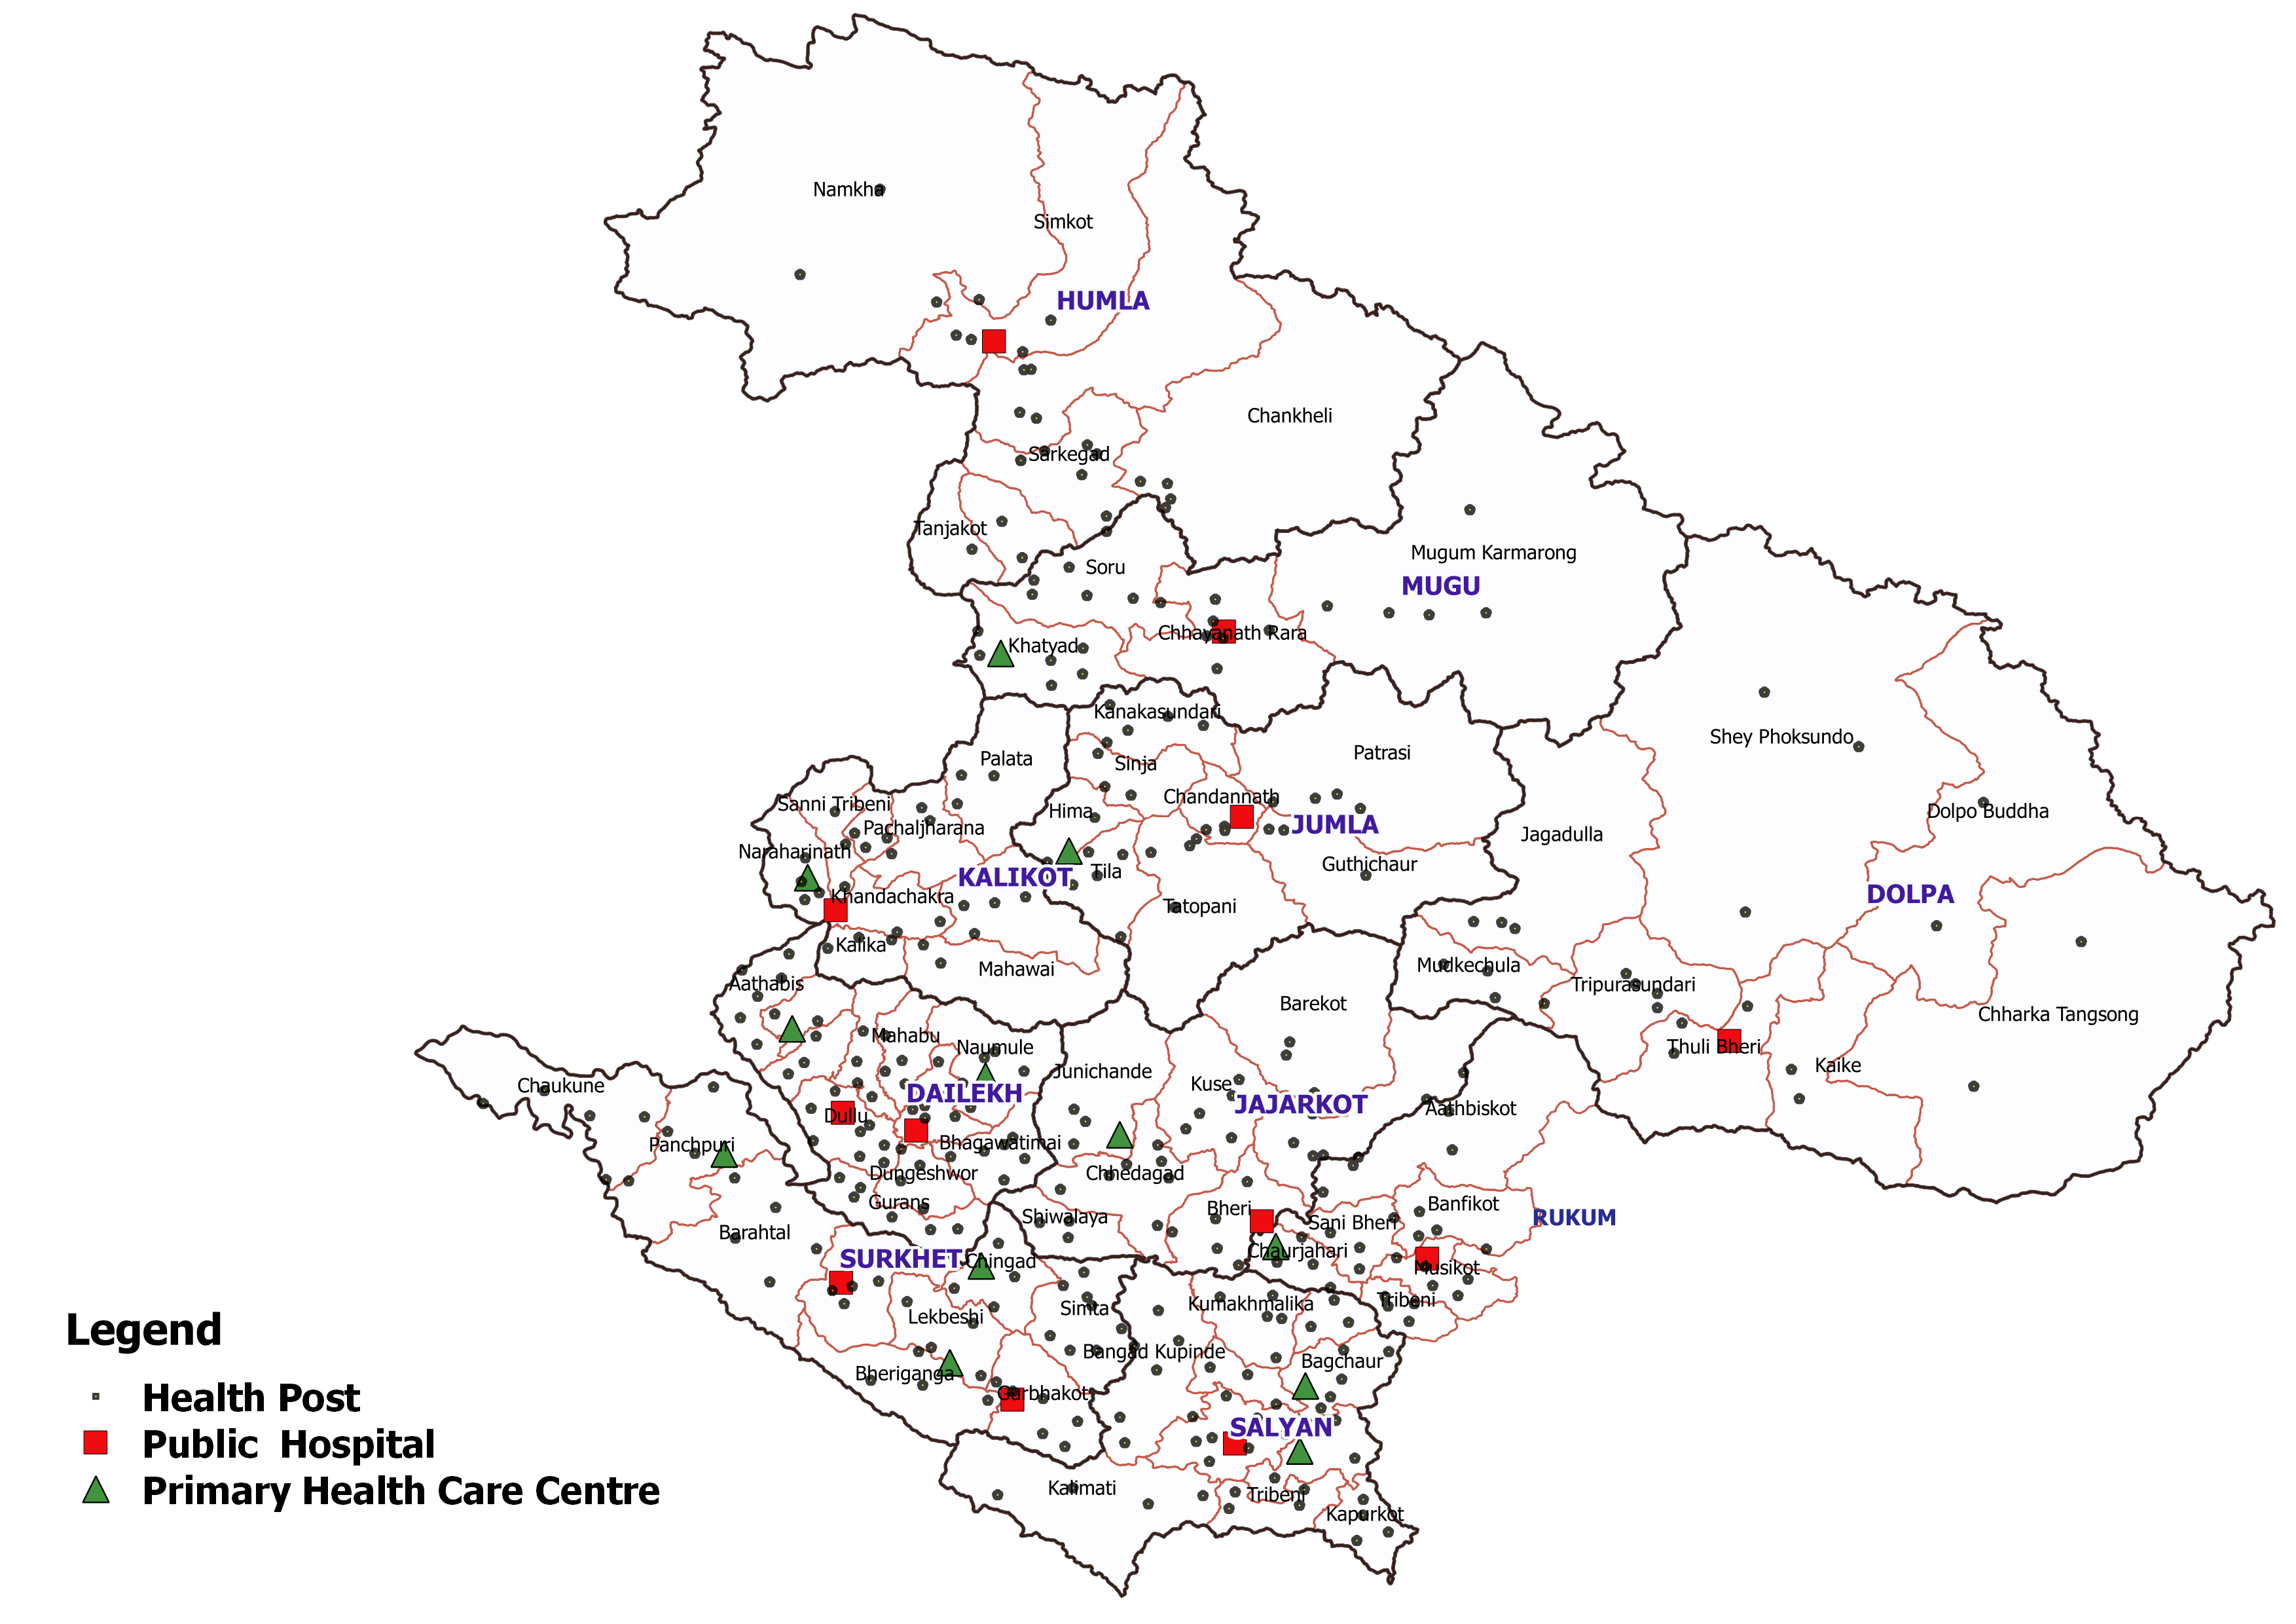
- अस्पताल १५
- प्रास्वाके १४
- स्वास्थ्य चौकी ३३३
- सामुदायिक स्वास्थ्य ईकाई १०१
- शहरी स्वास्थ्य केन्द्र २५
- गाउँघर क्लिनिक १०१४
- खोप क्लिनिक १३७०
- आधारभूत स्वस्थ सेवाकेन्द्र २३३
- बर्थिंग सेन्टर ३५९
सरकारी संस्था
- अस्पताल तथा नर्सिंग होम ८
- पोलिक्लिनिक २९
- औषधि पसल ४४२
निजी (गैर-सरकारी संस्था समेत)
अन्य स्वास्थ्य केन्द्रहरु
- माइक्रोस्कोपी केन्द्र ४७
- एआरटि केन्द्र ७
- एचाईभी परीक्षण केन्द्र ७
- क्षयरोग उपचार केन्द्र ४००
- आयुर्वेद अस्पताल/केन्द्र १८
- आँखा अस्पताल/केन्द्र १२
अस्पताल शैयाहरू
- सार्वजनिक ९८४
- निजी १५०
थप सेवाहरू
- सि.इ.अो.एन.सी केन्द्र १३
- बी.इ.अो.एन.सी केन्द्र ११
- सुरक्षित सेवा केन्द्र ५४
- २
वडा अनुसार स्वास्थ्य संस्थाको जानकारी
| District | Hospital | Phcc | Hp | BHSC/CHU/UHC | बर्थिंग सेन्टर | BEONC | CEONC | महिला स्वास्थ्य स्वयं सेवक | IUCD/Implant sites | दक्ष प्रसुतिकर्मी | स्वीकृत दरबन्दी | दरबन्दी अनुसार पदपूर्ति | करारका कर्मचारी | Building in Standard Design |
|---|---|---|---|---|---|---|---|---|---|---|---|---|---|---|
| रुकुम (पश्चिम भाग) | ४ | १ | २४ | ३१ | २२ | १ | २ | २४६ | - | ३५ | - | - | - | - |
| सल्यान | १ | २ | ४५ | २३ | ४६ | २ | १ | ४२४ | - | ५१ | - | - | - | - |
| सुर्खेत | २ | २ | ४७ | ५१ | ५० | ३ | २ | ९९० | - | ५४ | - | - | - | - |
| दैलेख | २ | २ | ५६ | २१ | ७७ | ३ | १ | ८२० | - | ५५ | - | - | - | - |
| जाजरकोट | १ | ३ | ३१ | ९ | २८ | ३ | १ | २७० | - | ३४ | - | - | - | - |
| डोल्पा | १ | - | २३ | - | १५ | ० | १ | १९८ | - | १६ | - | - | - | - |
| जुम्ला | - | १ | २९ | ५ | २६ | १ | १ | ५४७ | - | ३८ | - | - | - | - |
| कालिकोट | १ | १ | २८ | ३१ | ३३ | १ | १ | २९८ | - | ४० | - | - | - | - |
| मुगु | १ | १ | २४ | ९ | २७ | १ | १ | २१४ | - | १४ | - | - | - | - |
| हुम्ला | २ | - | २६ | ६ | ३१ | ० | १ | २३७ | - | २७ | - | - | - | - |
| कुल कर्मचारी संख्या | ४२४४ | ३६४ | ० | ० | ० | |||||||||
स्वास्थ्य सेवाको लागि मानव संसाधन
- दक्ष प्रसुतीकर्मी३६४
- CEONC साइटहरू११
- BEONC साइटहरू१४
- आइयुडी/ईम्प्लाण्ट प्रदायक-
- एकीकृत बालरोग व्यवस्थापन (IMCI) प्रशिक्षित कर्मचारी-
- जनसंख्या (प्रति मस्वास्वका) ३९८
- जनसंख्या (प्रति स्वास्थ्यकर्मी) -
- अनुमानित गर्भवति (प्रति दक्ष प्रसुतिकर्मी) १२४
- अनुमानित गर्भवति (प्रति बर्थिङ्ग सेन्टर) १२५
- जनसंख्या (प्रति स्वास्थ्य संस्था) (अस्पताल,प्रस्वाके र स्वाचौ सहित) ४६६४
- जनसंख्या (प्रति सरकारी अस्पताल) ११२५६१
- जनसंख्या (प्रति अस्पताल र नर्सिंग होम (सबै) ७३४०९
स्वास्थ्य सँरचना
| जिल्ला | आफ्नै भवन भएका स्वास्थ्य सँस्था (%) | मापदण्ड अनुसार आफ्नैभएका स्वास्थ्य सँस्था (%) | निर्धारित मापदण्ड अनुसार बनेका प्रसुति केन्द्रभएका स्वास्थ्य सँस्था (%) | कर्मचारी आवास भएका स्वास्थ्य सँस्था (%) | २४ घन्टा बिद्धुतको उपलब्धता भएका स्वास्थ्य संस्था संख्या (%) | कम्प्युटर र इन्टरनेट (सुचारु रुपमा)उपलब्धभएका स्वास्थ्य सँस्था (%) | स्ट्रेचरउपलब्धभएका स्वास्थ्य सँस्था (%) | एम्बुलेन्स सेवाको उपलब्धता भएका स्वास्थ्य संस्था (%) | मोटरबाटो पुगेका स्वास्थ्य संस्था(%) |
|---|---|---|---|---|---|---|---|---|---|
| डोल्पा | ६१ | ५२ | २९ | २९ | ४५ | ० | ७४ | ० | - |
| मुगु | ५० | ६४ | ३४ | २६ | १४ | ५४ | १०० | ६ | - |
| हुम्ला | ६१ | ४५ | ४१ | २८ | २५ | २७ | ७८ | ० | - |
| जुम्ला | ६७ | ६१ | ५१ | ४१ | १६ | ५१ | १०० | ३ | - |
| कालिकोट | ३२ | ३३ | १४ | १५ | २ | ३१ | ३३ | ३ | - |
| दैलेख | ८७ | ६७ | २८ | १३ | ३९ | ३६ | १०० | १५ | - |
| जाजरकोट | ४३ | ४३ | १५ | ११ | ४४ | ३५ | १०० | ३ | - |
| रुकुम (पश्चिम भाग) | ३४ | ३१ | ३५ | १० | ३५ | ४७ | ५६ | ३ | - |
| सल्यान | ६० | ४८ | १२ | १४ | ४८ | ४२ | १०० | १५ | - |
| सुर्खेत | ७६ | ६८ | ४४ | ३९ | ४२ | ५८ | १०० | ११ | - |
प्रादेशिक निति, रणनिती, योजना तथा निर्देशिका
| पारित भएका | मस्यौदा |
|---|---|
| नियमित तथ्याँक गुणस्तर लेखाजोखा निर्देशिका | |
| अनुगमन, मुल्याँकन तथा सुपरिबेक्षण निर्देशिका | |
| स्वास्थ्य एेन |
| पारित भएका | मस्यौदा |
|---|---|
| स्वास्थ्य निति २०७६ |
स्वास्थ्य क्षेत्रमा बजेट
- सशर्त स्वास्थ्यमा छुट्याएको बजेट
- समानीकरणबाट विनियोजित स्वास्थ्य बजेट
- अन्य श्रोतबाट बिनियोजित स्वास्थ्य बजेट
| बजेट | ||||||
|---|---|---|---|---|---|---|
| २०७५/७६ | २०७६/७७ | २०७७/७८ | ||||
| ग्राफ | ||||||
| Total Province Budget | २८,२८२,८२८,००० | ३४,३५३,४२५,००० | ३३,७४१,३५३,००० | |||
| स्वास्थ्य बजेट (सबै स्रोत) | १,४९३,६०९,००० | ६७९,५४६,९४७ | ||||
| सशर्त स्वास्थ्यमा छुट्याएको बजेट | ८४७,३१७,००० | ६७७,५३३,००० | ||||
| समानीकरणबाट विनियोजित स्वास्थ्य बजेट | ६४६,२९२,००० | २,०१३,९४७ | ||||
| अन्य श्रोतबाट बिनियोजित स्वास्थ्य बजेट | ||||||
| प्रति संस्था औसत स्वास्थ्य बजेट(रू.) | १,४९३,६०९,००० | ६७९,५४६,९४७ | ||||
| प्रति व्यक्ति औसत स्वास्थ्यको बजेट (रू.) | १,४९३,६०९,००० | ६७९,५४६,९४७ | ||||
| बजेट खर्च (%) | ५० | ५९ | - | |||
| जम्मा बजेट मध्ये स्वास्थ्यमा बिनियोजित बजेट (%) | - | - | - | |||
| स्वास्थ्य बिमा कार्यक्रम संचालन भएका जिल्लाको संख्या | - | - | - | |||
| जम्मा बिमितहरुको संख्या | - | - | - | |||
| तालिका | ||||||
स्वास्थ्य सेवाको लागि तत्परता
आधारभूत स्वास्थ्य सेवाको उपलब्धता
स्वास्थ्य सेवाको लागि आवश्यक आधारभूत सामाग्रीहरुको उपलब्धता
गुण्स्तर स्वास्थ्य सेवा प्रदान गर्नको लागि न्युनतम मापदण्डको अवस्था
| सुचकहरु | व्यवस्थापन निकाय | |||
|---|---|---|---|---|
| सरकारी | निजी | प्रादेशिक अवस्था | राष्ट्रियअवस्था | |
| हात धुनको लागि साबुन र पानी वा सेनिटाइजरको व्यवस्था भएको स्वास्थ्य सँस्था (%) | ९७ | ९८ | ९९ | ९८ |
| सँक्रामक फोहरको सुरक्षित बिसर्जन गर्ने स्वास्थ्य सँस्था (%) | ५७ | ७७ | ६४ | ५९ |
| सामाग्रीहरु र प्रशोधन समयको बारेमा सहि जानकारी भएको स्वास्थ्य सँस्था (%) | ६७ | ९४ | ५० | ६९ |
| तालिम प्राप्त कर्मचारी भएको स्वास्थ्य सँस्था(%) | ९५ | ७७ | ९२ | ९४ |
| "स्वास्थ्य सेवाको गुणस्तर सुधार पद्धति" िनर्देशिका भएको स्वास्थ्य सँस्था(%) | २१ | १६ | १७ | २० |
| क्लिनिकल प्रोटोकलको उपलब्धता भएको स्वास्थ्य सँस्था (%) | १४ | ० | १३ | १३ |
| चार tracer सामाग्रीहरुको उपलब्धता भएको स्वास्थ्य सँस्था(%) | ५९ | ९३ | ७३ | ६२ |
| प्रतीक्षालय भएको स्वास्थ्य सँस्था (%) | ७४ | ९२ | ६६ | ७५ |
| Tracer औषधी भएको स्वास्थ्य सँस्था (%) | ४२ | २७ | ५० | ४१ |
| सबै नौ वस्तुहरुको उपलबधता भएको स्वास्थ्य सँस्था(%) | १ | ० | ० | १ |
स्वास्थ्य सेवाको गुणस्तर
परिवार नियोजन सेवा
बिरामी शिशु सेवा
गर्भवति महिलाहरुकाे शारिरक जाँच तथा परामर्श सेवा
स्वास्थ्य समानता
जातिगत तथा आर्थिक अवस्था अनुसार विभिन्न सेवाहरुको उपयोगको अवस्था
| समुहहरु | नवजात शिशु मृत्यु दर /१००० जिवित जन्ममा | पाँच बर्ष मूनिका बालबालिकाहरुको मृत्यु दर/१००० जनसँख्या | जम्मा प्रजनन दर | पुड्कोपन भएका पाँच बर्ष मूनिका बालबालिका(%) | BMI<१८.५ भएका १५-४९ वर्षका महिलाहरु (%) | BMI<१८.५ भएका १५-४९ वर्षका महिलाहरु (%) | सँस्थागत प्रसूति (%) | परिवार योजना सेवाको माग पूर्ति भएको (%) | झाडापखाला भएका पाँच बर्ष मूनिका बालबालिका(%) | रक्तअल्पता भएका १५-४९ वर्षका महिलाहरु (%) |
|---|---|---|---|---|---|---|---|---|---|---|
| दलित | ६३ | ४३ | ३ | ४० | २१ | ७३ | ४५ | ६३ | ८ | ३८ |
| जनजाति | ४२ | २४ | २ | ३२ | १२ | ८३ | ५८ | ७१ | ७ | ४० |
| मधेषी | ५१ | २७ | ३ | ४२ | २८ | ६४ | ४८ | ७२ | १० | ५६ |
| मुश्लिम | ४७ | २५ | ४ | ३८ | ३१ | ६८ | ५२ | ५३ | ११ | ५२ |
| ब्राहमण/क्षेत्री | ३९ | २३ | २ | ३५ | १५ | ८७ | ६८ | ६९ | ६ | ३७ |
| नेवार | ३३ | ९ | २ | २७ | ९ | ८९ | ७५ | ७४ | १२ | २६ |
| राष्टिय अवस्था | ३९ | २१ | २ | ३६ | १७ | ७८ | ५७ | ६९ | ८ | ४१ |
| प्रादेशिक अवस्था | ५८ | २९ | ३ | ५५ | १५ | ७५ | ३६ | ५८ | ६ | ३५ |
| निम्न आयश्रोत भएको घरधुरी | ६१ | ३२ | ३ | ५९ | ० | ७३ | २८ | ५७ | ६ | ३६ |
| मध्यम आएश्रोत भएको घरधुरी | ० | ० | २ | ३३ | ० | ० | ८२ | ६६ | ४ | २८ |
| उच्च आयश्रोत भएको घरधुरी | ० | ० | २ | ३२ | ० | ० | ८६ | ५७ | १० | ३३ |
जातिगत तथा आर्थिक अवस्था अनुसार मातृ, बाल स्वास्थ्य सम्बन्धि सेवाहरुको उपयोगको अवस्था
| सुचकहरु | आर्थिक अवस्था | जातिगत आधार | |||||
|---|---|---|---|---|---|---|---|
| निम्न आयश्रोत | मध्यम आयश्रोत | उच्च आयश्रोत | लाभान्वित जातीय समूह | पिछडिएको जातीय समूह | प्रादेशिक अवस्था | राष्ट्रियअवस्था | |
| कुनै पनि एक परिवार नियाोजन साधानको प्रयाोग (%) | ४३ | ५३ | ४७ | ४५ | ४३ | ४५ | ४३ |
| कम्तिमा एक पटक गर्भवति अवस्थामा गर्भ जाँच गराएका महिलाहरुको प्रतिशत | ८३ | ९९ | ९७ | ८४ | ८८ | ८५ | ९४ |
| प्रोटोकल अनुसार चार पटक गर्भवति अवस्थामा गर्भ जाँच गराएका महिलाहरुको प्रतिशत | ४७ | ७५ | ९० | ४९ | ५८ | ५२ | ६९ |
| स्वास्थ्य सँस्थामा सुत्केरी भएका महिलाहरुको प्रतिशत | २८ | ८२ | ८६ | ३० | ४६ | ३६ | ५७ |
| दक्ष प्रसुतिकर्मीद्वारा सुत्केरी भएका महिलाहरुको प्रतिशत | २८ | ८४ | ८२ | ३१ | ४४ | ३५ | ५८ |
| आफै सुत्केरी भएका महिलाहरुको प्रतिशत | ११ | २ | ० | १२ | ५ | १० | १० |
| "स्वास्थ्य सेवा लिनको लागि अनुमति लिनुपर्ने" समस्याको रुपमा लिएका महिलाहरुको प्रतिशत | ३७ | १८ | १० | ३३ | ३३ | ३३ | २४ |
| पैसालाई समस्याको रुपमा लिएका महिलाहरुको प्रतिशत | ६४ | ४८ | २९ | ६१ | ५६ | ५९ | ५५ |
| स्वास्थ्य सँस्था सम्मको दुरीलाई समस्याको रुपमा रुपमा लिएका महिलाहरुको प्रतिशत | ८१ | ४५ | २८ | ७४ | ६९ | ७२ | ५३ |
| एक्लै स्वास्थ्य सँसथा जान नसक्नेलाई समस्याको रुपमा लिएका महिलाहरुको प्रतिशत | ८३ | ६९ | ५२ | ७९ | ७८ | ७९ | ६८ |
| महिला स्वास्थ्यकर्मी स्वास्थ्य सँस्थामा नहुनुलाई समस्याको रुपमा लिएका महिलाहरुको प्रतिशत | ७० | ५७ | ४५ | ६८ | ६५ | ६७ | ६७ |
सुचकहरु: लक्ष्य र उपलब्धि
| सुचकहरु | प्रादेशिक अवस्था | राष्ट्रियअवस्था | लक्ष्य २०२५ | लक्ष्य २०३० |
|---|---|---|---|---|
| मातृ मृत्युदर अनुपात | - | २३९ | ८६ | ७० |
| गर्भावस्था सम्बन्धित मृत्युदर अनुपात | - | २५९ | - | - |
| किशोर अवस्थामा बच्चा जन्माउने दर | ८१ | ६३ | - | - |
| पाँच भन्दा कम उमेरका बच्चाहरूको मृत्यु दर | ३० | २८ | २६ | २० |
| शिशु मृत्यु दर | २७ | २५ | - | १० |
| नवजात शिशु मृत्यु दर | ११ | १६ | १४ | १२ |
| कुल प्रजनन दर | ३ | २ | २ | २ |
| परिवार नियोजन प्रयाोग दर, आधुनिक विधिहरू | ३६ | ३६ | ३३ | ७५ |
| सँस्थागत सुत्केरी दर | ७८ | ६६ | ७८ | ९० |
| दक्ष प्रसुतिकर्मीद्वारा सुत्केरी भएका महिलाहरुको प्रतिशत | ६३ | ६२ | ७९ | ९० |
| पूर्ण खोप लगाएको प्रतिशत | ७० | ७० | १०० | १०० |
| पुड्कोपना दर (५ वर्ष मुनीका बालबालिका मध्य) | ४८ | ३२ | २२ | १५ |
| ख्याउटेपना दर (५ वर्ष मुनीका बालबालिका मध्य) | १८ | १२ | ६ | ३ |
| औषत उमेर (जन्मदा खेरी) ७७.८ | ६७ | ६९ | - | - |
| HIV प्रकोप दर | १ | - | - | - |
मातृशिशु बालस्वास्थ्य र परिवार नियोजन सेवा उपयोगको अवस्था
स्वास्थ्य सूचना व्यवस्थापन प्रणाली २०७९/८०प्रमूख स्वास्थ्य सेवाहरूको उपयोगको तुलनात्मक अवस्था
| सूचक | कर्णाली प्रदेश | राष्ट्रीय २०७६/७७ | |||
|---|---|---|---|---|---|
| २०७७/७८ | २०७८/७९ | २०७९/८० | |||
| खाेप |
ग्राफ
तालिका
|
||||
| बि.सि.जि. कभरेज | १०७ | ९२ | ९०.७ | ८६ | |
| डि.पि.टि. - हेप बि - हिव ३ कभरेज | १०१ | ९४ | ८८.६ | ७८ | |
| दादुरा रूबेला १ (९-११ महिना) कभरेज | ९५ | ९५ | ८६ | ८० | |
| जे.इ कभरेज | ९६ | ९५ | ८६.७ | ७८ | |
| टि.डी. २ र टि. डी. २+ कभरेज | ७३ | ६६ | ६५.२ | ५९ | |
| पोषण |
ग्राफ
तालिका
|
||||
| कम जन्म तौल भएका नवजात शिशुको प्रतिशत | ७ | ६.८ | ७.१ | १३ | |
| नयाँ तौल लिएका १ वर्ष मुनिका शिशुहरुको प्रतिशत | ११८.१ | ११९.४ | ११३.१ | ७७ | |
| नयाँ तौल लिएका २ वर्ष मुनिका शिशुहरु मध्ये अति जोखिम अवस्थाका बालबालिकाहरुको प्रतिशत | ३.६ | ४.१ | ३ | ६.५ | |
| गर्भवती अवस्थामा १८० दिन आइरन चक्की प्राप्त गरेका गर्भवती महिलाहरुको प्रतिशत | ७३.७ | ७२.३ | ७७ | ४४ | |
| सुत्केरी अवस्थामा भिटामिन ए प्राप्त गरेका महिलाहरुको प्रतिशत | ९२.६ | ८८.४ | ९७ | ५७ | |
| नवजात शिशु तथा बाल रोगको एकीकृत व्यस्थापन |
ग्राफ
तालिका
|
||||
| नाभी मलम लगाएका नवजात शिशुको प्रतिशत | ८१.३ | ९५.५ | ९६.८ | ७९ | |
| ब्याक्टेरियाको गम्भीर संक्रमण भएकामध्ये जेन्टामाईसिन सुईद्वारा पूर्ण उपचार पाएको प्रतिशत | ६५.५ | ७५.४ | ८८.६ | ४५ | |
| नयाँ निमोनिया बिरामीको दर (प्रति हजार पाँच वर्षमुनिका बालबालिकाहरुमा) | ९४.९ | ११२.५ | ७३.६ | ७० | |
| नयाँ एआरआई (स्वाशप्रश्वाका) बिरामी मध्ये कडा निमोनिया भएका बिरामीको प्रतिशत | ०.२४ | ०.४१ | ०.२८ | ०.२२ | |
| नयाँ झाडापखालाका बिरामीको दर (प्रति हजार पाँच वर्ष मुनिका बालबालिकाहरुमा) | ६२५.६ | ५७६.९ | २१६ | ३५० | |
| ५ वर्ष मुनिका झाडापखालाका बिरामी मध्ये जिंक र पुनर्जलीय झोलबाट उपचार गरेको प्रतिशत | ९६.३ | ९३ | ९७.३ | ९५ | |
| जम्मा नवजात शिशु मृत्यु संख्या | २१८ | १९९ | ० | १७७९ | |
| सुरक्षित मातृत्व तथा परिवार नियोजन |
ग्राफ
तालिका
|
||||
| पहिलो पटक गर्भवती जाँच गराएका गर्भवती महिलाहरुको प्रतिशत | ९१ | ८९.९ | ११८.३ | ६८ | |
| प्रोटोकल अनुसार ४ पटक गर्भवती जाँच गराउने महिलाहरुको प्रतिशत | ७६ | ७२.३ | ८५ | ५३ | |
| स्वास्थ्य संस्था प्रसुति दर | १५६.६ | १५२.२ | ८३.४ | ६६ | |
| दक्ष प्रसुतिकर्मीद्वारा प्रसुति गराएको प्रतिशत | ६९.५ | ६९.८ | ५३.४ | ६२ | |
| प्रोटोकल अनुसार ३ पटक सुत्केरी जाँच गराउने आमाहरुको प्रतिशत | ४० | ५२.६ | ५७.४ | १९ | |
| जम्मा मातृ मृत्यु संख्या | २० | १७ | १७ | २१५ | |
| परिवार नियोजन सेवाका नयाँ सेवाग्राही दर (विवाहित प्रजनन उमेरका महिलाहरु मध्ये) | १९.४ | १८.७ | १६.१ | ११ | |
| औलो रोग, क्षय रोग, कुष्ठरोग र एचआईभी |
ग्राफ
तालिका
|
||||
| औलोको स्लाइड नमुना पोजेटिभ दर | ०.४७ | ०.२५ | ०.०९ | ०.२५ | |
| आयातित औलोरोगको प्रतिशत (नयाँ औलो रोग मध्ये | ५० | ६२.५ | ७२.७ | ८४ | |
| जम्मा औलो रोग मध्ये प्लाज्मोडियम फाल्सिपारमको अनुपात | ५.९ | २.१ | ११.८ | ९ | |
| नयाँ क्षयरोगी बिरामी पत्ता लागेको दर | ६५.३ | ९७.२ | ९१.४ | ९१ | |
| क्षयरोगको उपचार सफलता दर | ९३.४ | ९०.९ | ९३.२ | ९० | |
| कुष्ठरोगको नयाँ बिरामी दर (प्रति १०००० मा) | ०.३७ | ०.४ | ०.४२ | ०.९ | |
| ए. आर. टी. उपचारमा रहेका जम्मा एच. आइ. भी. पोजेटिभको संख्या | ६५१ | ६९० | ७१० | ५०७६७ | |
| उपचारात्मक सेवा |
ग्राफ
तालिका
|
||||
| ओ पि डी मा आएका बिरामी मध्ये नयाँ बिरामीको दर | १०३ | १०४.५ | ४१ | ८४ | |
| नसर्ने रोग |
ग्राफ
तालिका
|
||||
| सिअाेपिडी सँख्या | ३०९८५ | २०६०८ | २५५०७ | ० | |
| अर्बुदराेग | १४३ | १९ | २८ | ० | |
| मधुमेह | ६५९८ | ६६०४ | १२७८७ | ० | |
| मिर्गाैला सम्बन्धी समस्या भएका | २४० | १५४ | ४१२ | ० | |
| आयुर्वेदिक सेवा |
ग्राफ
तालिका
|
||||
| जम्मा सेवाग्राहीकाे सँख्या (अाेपिडी) | १०३०४६ | २०६०८ | १७६८९६ | ० | |
| पन्चकर्मा सेवा लिएका जम्मा सेवाग्राही सँख्या | ९३७६ | ० | २७६०० | ० | |
| जम्मा पुरुष सेवाग्राहीकाे सँख्या | ४८६०० | ९४४२८ | ८२५०३ | ० | |
| जम्मा महिला सेवाग्राहीकाे सँख्या | ११२१७७ | २१३१२७ | १८९७३२ | ० | |
शीर्ष १० स्वास्थ्य अवस्थाको सूची
स्वास्थ्य सूचना व्यवस्थापन प्रणाली २०७८/७९जोखिमयुक्त व्यवहारको अवस्था
| जोखिमयुक्त व्यवहारहरु | प्रादेशिक अवस्था | राष्ट्रियअवस्था |
|---|---|---|
| श्रुतीजन्य पदार्थ सेवन | ||
| हाल श्रुती जन्य पदार्थ (धुवा रहित वा धुवा युक्त) सेवन गर्नेहरुको प्रतिशत | ३० | २९ |
| हाल दैनिक धुम्रपान सेवन गर्नेको प्रतिशत | १६ | १३ |
| मध्यपान सेवन | ||
| बितेको ३० दिन भित्रमा अत्याधिक मद्यपान सेवन (६ वा ६ भन्दा बढी स्टान्डर्ड ड्रिंक्स) गर्नेको प्रतिशत ( | ९ | ७ |
| हाल मद्यपान सेवन गर्नेको प्रतिशत (बितेको ३० दिन भित्रमा मद्यपान सेवन गरेको) | २० | २१ |
| जीवनमा कहिल्यै मद्यपान सेवन नगर्नेको प्रतिशत | ० | ० |
| आहार | ||
| औसतमा १ दिनमा ५ सर्भिङ भन्दा थोरै फलफुल ररवा तरकारी खानेको प्रतिशत | ९७ | ९७ |
| नुन | ||
| औसत नुन सेवन प्रतिदिन (ग्राममा)(स्पट युरिन परिक्षणमा आधारित) | १० | ९ |
| शारीरिक क्रियाकलाप | ||
| अपर्याप्त शारीरिक गतिविधि गर्नेको प्रतिशत (प्रति हप्ता १५० मिनेट भन्दा कम समय मध्यम परिश्रम पर्ने वा | ४ | ७ |
| मुख स्वास्थ्य | ||
| दाँत, मुख वा गिजाको समस्या (दुख्ने, सुन्निने, रगत आउने वा असजिलो हुने) हुनेको प्रतिशत | २२ | १४ |
| पाठेघरको मुखको क्यान्सरको स्क्रीनिङ (३०(४९ वर्ष उमेरको महिला) | ||
| पाठेघरको मुखको क्यान्सरको (सर्विकल क्यान्सर) को परिक्षण गराउनेको प्रतिशत | १६ | ८ |
| दुर्घटना, हिँसा तथा चोटपटक | ||
| बिगत १२ महिनामा, सडक दुर्घटनामा पर्नेको प्रतिशत | ५ | १४ |
| बडी मास इन्डेक्स र मोटोपन | ||
| औसत body mass index (BMI (kg/m2) | २१ | २३ |
| अधिक वजन र मोटोपन हुनेको प्रतिशत (BMI <25 kg/m2) | ११ | २४ |
| Hypertension, Diabetes and Raised Cholesterol | ||
| रक्तचाप बढी हुनेको प्रतिशत (SBP≥ १४० र/वा DBP ≥ ९० mmज्न वा हाल उच्च रक्तचापको लागि औषधी खाइरहेको) | २१ | २३ |
| रगतमा चिनीको मात्रा बढी हुनेको प्रतिशत ( फास्टिङ ब्लड ग्लुकोज ≥१२६ mg/dl वा हाल रगतमा बढी मात्रामा च | १ | ६ |
| जम्मा कोलेस्टेरोल (रगतमा चिल्लोपना) को मात्रा बढी हुनेको प्रतिशत ९≥ ५.० mm वा ≥ १९० mg/dl वा हाल कोल | ५ | ११ |
| स्वास्थ्यकर्मीबाट रक्तचाप नाप्नेको प्रतिशत (४०-६९ बर्ष भित्रको) | ४३ | ६१ |
| स्वास्थ्यकर्मीबाट रगतमा चिनीको मात्रा नाप्नेको प्रतिशत (४० -६९ बर्ष भित्रको) | ९ | २१ |
महामारीतथा प्रकोपको अवस्था
| जिल्ला | २०७४/७५ | २०७५/७६ | २०७६/७७ | २०७७/७८ | २०७८/७९ |
|---|---|---|---|---|---|
| डोल्पा | |||||
| मुगु | |||||
| हुम्ला | |||||
| जुम्ला | |||||
| कालिकोट | |||||
| दैलेख | |||||
| जाजरकोट | |||||
| रुकुम (पश्चिम भाग) | |||||
| सल्यान | |||||
| सुर्खेत |
स्वास्थ्यका साझेदारहरु
| साझेदार सँस्थाको नाम | भौगोलिककार्यक्षेत्र | बिषयगत क्षेत्र |
|---|---|---|
| एड्स हेल्थ केयर फाउण्डेशन | प्रदेश अस्पताल | एच आइ भि एड्स |
| ASCEND | सबै जिल्लाहरु | Neglected Tropical Diseases |
| सि एम सी नेपाल | ५ जिल्लाहरु | मानसिक स्वास्थ्य |
| पि एस एम | सबै जिल्लाहरु | |
| सुअाहारा | ५ जिल्लाहरु | पाेषण, सरसफाइ, र कृषि |
| अाइ एन एफ | सबै जिल्लाहरु | क्षयराेग र कुष्ठराेग |
| अाइपास | २ जिल्लाहरु | याैन प्रजनन् स्वास्थ्य र अधिकार |
| नेपाल रेडक्रस साेसाइटी | सबै जिल्लाहरु | सरसफाइ र आपतकालिन स्वास्थ्य |
| निक साइमन इन्इटिच्युट | सबै जिल्लाहरु | अस्पताल प्रणाली सुदृिढकरण |
| फेज नेपाल | मुगु र हुम्ला | स्वास्थ्य र पाेषण |
| पलान इन्टरनेशनल | जुम्ला | |
| सेभ द िचल्g | ४ जिल्लाहरु | |
| स्वच्छता | ४ जिल्लाहरु | |
| टि पि अाे नेपाल | ५ जिल्लाहरु | |
| यूएनडिपी | सबै जिल्लाहरु | |
| यूनिसेफ | सबै जिल्लाहरु | |
| स्वास्थ्यकाे लागि सक्षम प्रणाली | सबै जिल्लाहरु | |
| वाटर एड | सबै जिल्लाहरु | |
| विश्व खाध्य कार्यक्रम | सबै जिल्लाहरु | |
| विश्व स्वास्थ्य सँगठन | सबै जिल्लाहरु | |
| भकारी | ५ जिल्लाहरु | खाध्य सुरक्षा |
| ह्याण्डीक्याप इन्टरनेसनल | सबै जिल्लाहरु | शारीरिक पुनर्स्थापना |
महत्वपूर्ण सम्पर्क
Karnali Pradesh
ठेगाना : वीरेन्द्रनगर, सुर्खेत
टेलिफोन : ०८३-५२०२१६
वेबसाइट : https://hsd.karnali.gov.np/

यो प्रोफाइल अमेरिकी अन्तर्राष्ट्रिय विकास नियोग (युएसएआइडी) मार्पmत अमेरिकी जनताहरुको सहयोगका कारण सम्भव बनेको हो । यो प्रतिवेदन भित्रका विषयवस्तु र सामग्री स्वास्थ्यका लागि सक्षम प्रणालीका एकल जिम्मेवारी हुन् र तिनले युएसएआइडी वा अमेरिकी सरकारको विचारको प्रतिविम्बित गर्छन् भन्ने जरुरी छैन ।